46221 Investment Properties for Sale
Browse homes for sale and investment properties in 46221. Refine your search by price, property type, or more.
Best cash flowing properties in 46221
Active
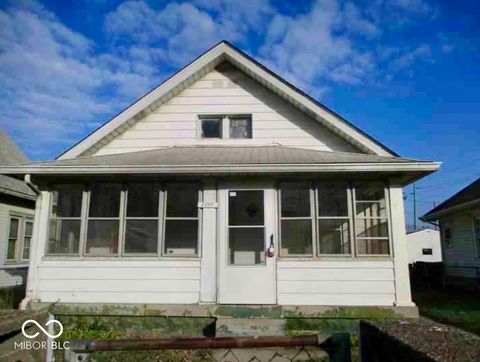
$69,900
1
bds
|
1
ba
|
562
sqft
|
built
1910
1736 S Belmont Ave, Indianapolis, IN 46221
$483
Cash flow
8.1%
Cash-on-Cash Return
8.3%
Cap rate
1.0%
Rent to Value Ratio
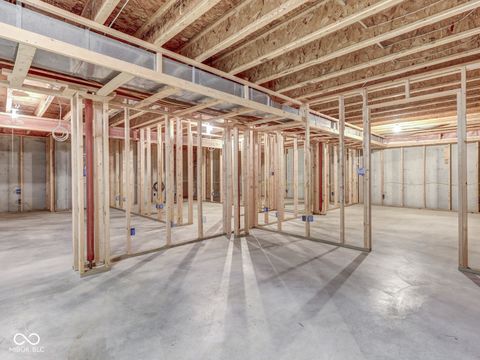
Active
$94,900
3
bds
|
1
ba
|
1,100
sqft
|
built
1890
1123 S Pershing Ave, Indianapolis, IN 46221
$480
Cash flow
26.4%
Cash-on-Cash Return
12.2%
Cap rate
1.5%
Rent to Value Ratio
63 out of 64 properties for sale in 46221
Limited Results Shown
Create a free account, or log in to reveal all property listings and enjoy the complete experience.
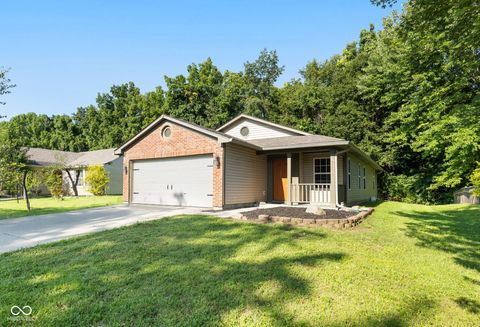
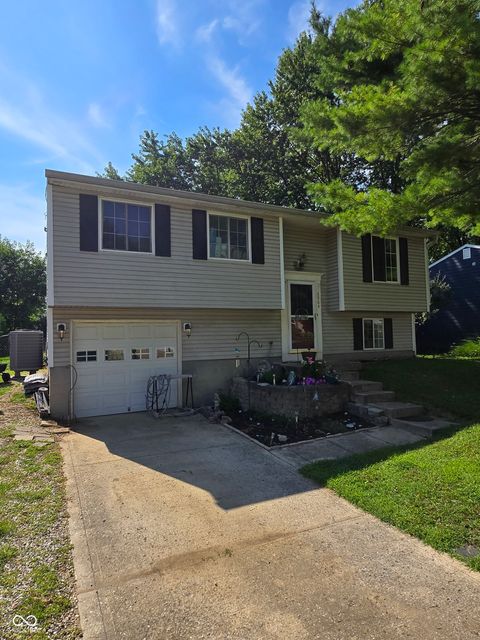
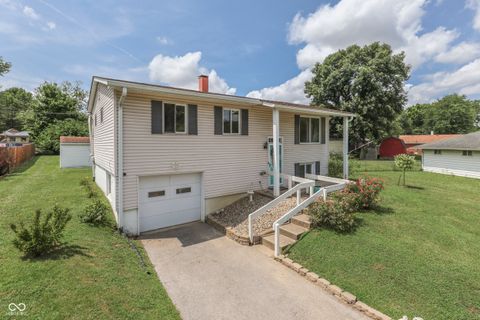
Active
$249,500
3
bds
|
2
ba
|
1,485
sqft
|
built
1980
5307 Honey Manor Dr, Indianapolis, IN 46221
$-36
Cash flow
-0.8%
Cash-on-Cash Return
6.0%
Cap rate
0.7%
Rent to Value Ratio
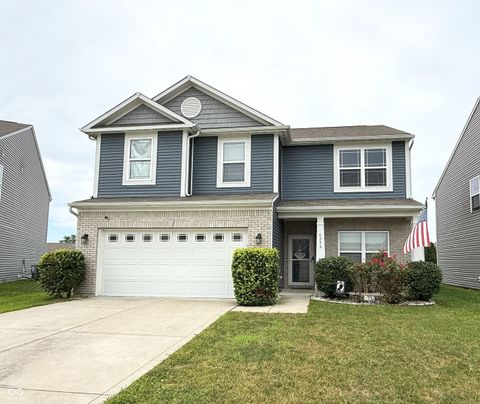
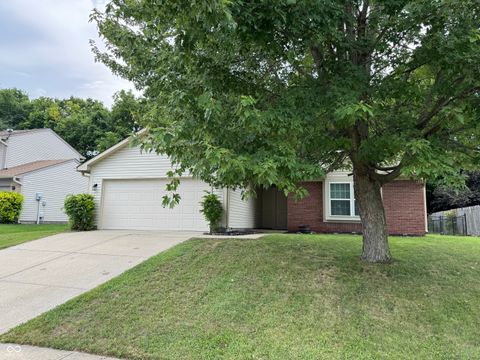
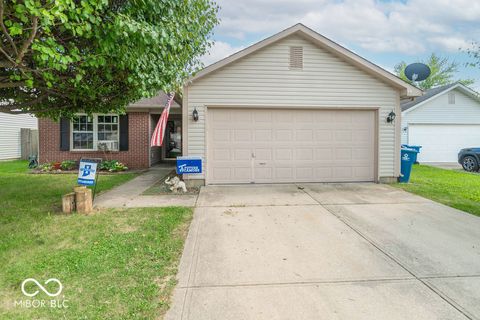
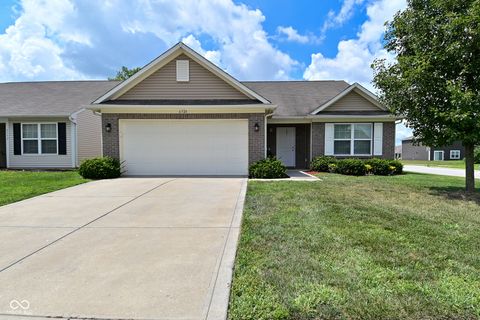
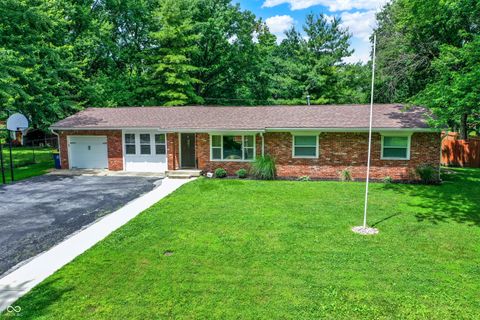
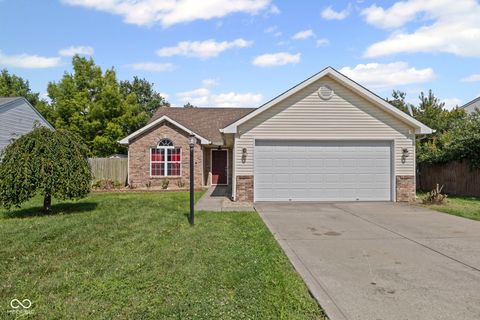
Active
$239,900
3
bds
|
2
ba
|
1,236
sqft
|
built
1999
6227 Long River Ln, Indianapolis, IN 46221
$-141
Cash flow
-3.1%
Cash-on-Cash Return
5.4%
Cap rate
0.7%
Rent to Value Ratio
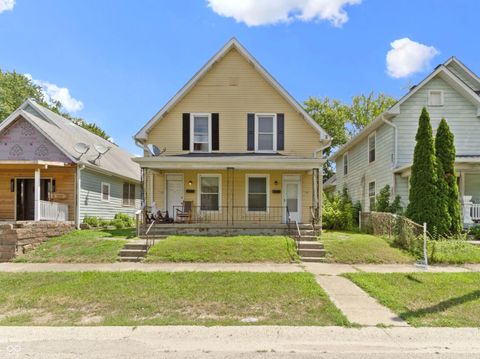
Active
$177,500
2
bds
|
1
ba
|
994
sqft
|
built
1920
624 Warren Ave, Indianapolis, IN 46221
$-219
Cash flow
-6.4%
Cash-on-Cash Return
4.7%
Cap rate
0.6%
Rent to Value Ratio
Active
$239,900
bds
|
0
ba
|
0
sqft
|
built
1939
3135 Kentucky Ave, Indianapolis, IN 46221
$-263
Cash flow
-5.7%
Cash-on-Cash Return
4.8%
Cap rate
0.6%
Rent to Value Ratio
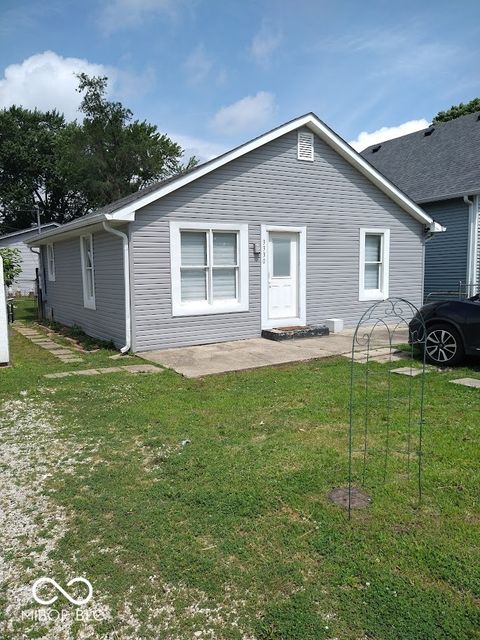
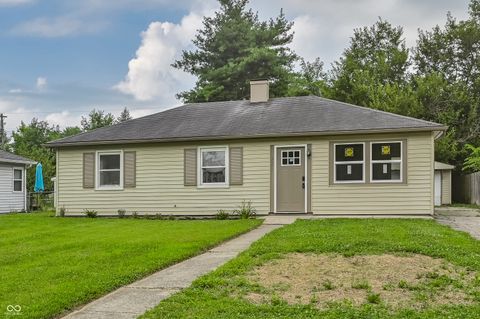
Active
$172,000
3
bds
|
1
ba
|
1,008
sqft
|
built
1900
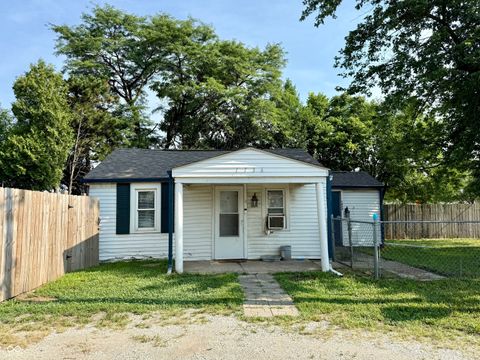
657 Birch Ave, Indianapolis, IN 46221
$16
Cash flow
0.5%
Cash-on-Cash Return
6.3%
Cap rate
0.8%
Rent to Value Ratio
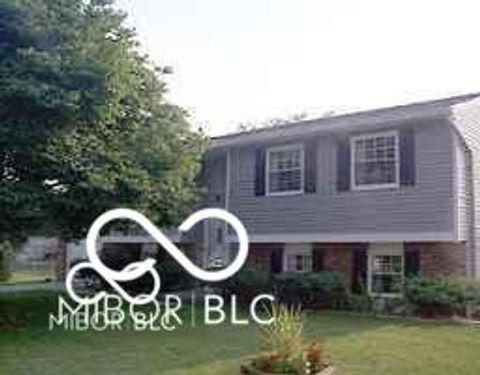
Active
$215,000
3
bds
|
0
ba
|
0
sqft
|
built
1990
653 Birch Ave, Indianapolis, IN 46221
$-411
Cash flow
-10.0%
Cash-on-Cash Return
3.9%
Cap rate
0.5%
Rent to Value Ratio
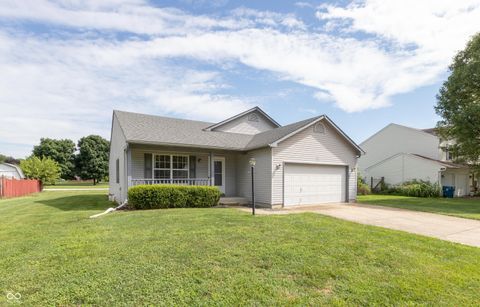
Active
$280,000
4
bds
|
3
ba
|
2,360
sqft
|
built
2006
5848 Sable Dr, Indianapolis, IN 46221
$68
Cash flow
1.3%
Cash-on-Cash Return
6.4%
Cap rate
0.8%
Rent to Value Ratio
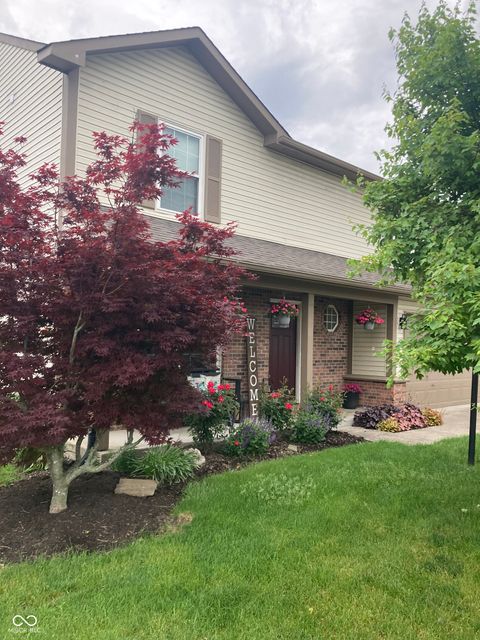
Active
$279,000
4
bds
|
2
ba
|
2,148
sqft
|
built
1973
6811 Cordova Dr, Indianapolis, IN 46221
$-49
Cash flow
-0.9%
Cash-on-Cash Return
5.9%
Cap rate
0.7%
Rent to Value Ratio
Active
$94,500
2
bds
|
1
ba
|
974
sqft
|
built
1920
833 S Tremont St, Indianapolis, IN 46221
$413
Cash flow
22.8%
Cash-on-Cash Return
11.4%
Cap rate
1.4%
Rent to Value Ratio
Active
$264,900
3
bds
|
2
ba
|
1,478
sqft
|
built
2005
7406 Graymont Dr, Indianapolis, IN 46221
$4
Cash flow
0.1%
Cash-on-Cash Return
6.2%
Cap rate
0.8%
Rent to Value Ratio
Active
$278,000
4
bds
|
3
ba
|
2,178
sqft
|
built
2016
6240 Emerald Lake Ct, Indianapolis, IN 46221
$72
Cash flow
1.4%
Cash-on-Cash Return
6.5%
Cap rate
0.8%
Rent to Value Ratio
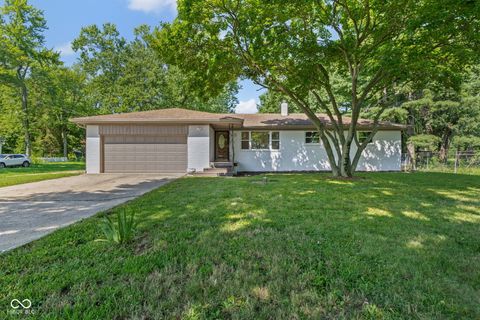
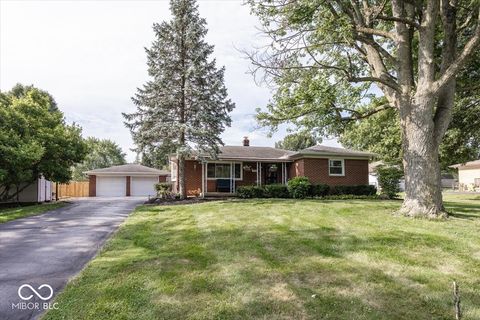
Active
$369,999
3
bds
|
2
ba
|
1,486
sqft
|
built
1960
5324 Mann Rd, Indianapolis, IN 46221
$37
Cash flow
0.5%
Cash-on-Cash Return
6.3%
Cap rate
0.8%
Rent to Value Ratio
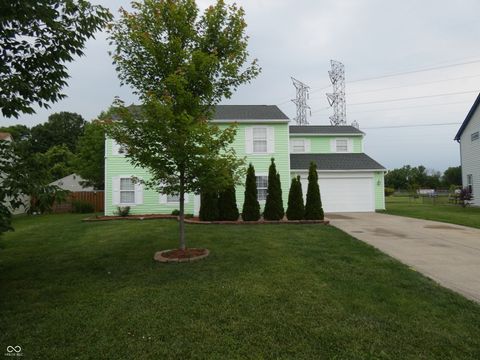
Active
$329,900
5
bds
|
3
ba
|
2,192
sqft
|
built
1995
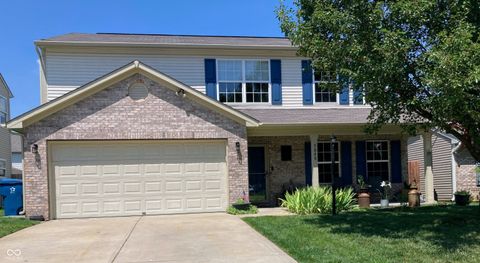
6714 Colleens Way, Indianapolis, IN 46221
$-324
Cash flow
-5.1%
Cash-on-Cash Return
5.0%
Cap rate
0.6%
Rent to Value Ratio
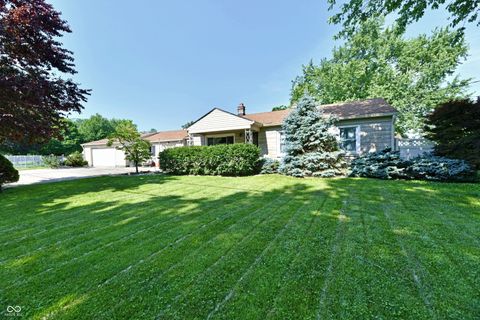
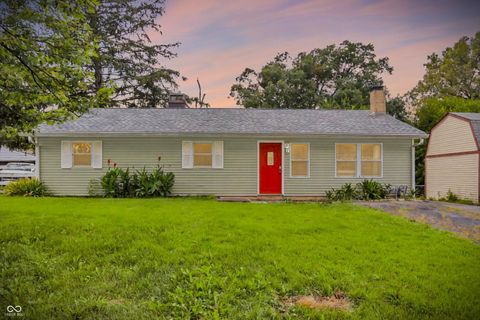
Active
$260,000
4
bds
|
2
ba
|
1,732
sqft
|
built
1952
4020 S Lynhurst Dr, Indianapolis, IN 46221
$48
Cash flow
1.0%
Cash-on-Cash Return
6.4%
Cap rate
0.8%
Rent to Value Ratio
Active
$230,000
3
bds
|
2
ba
|
1,200
sqft
|
built
1998
6042 Rocky River Dr, Indianapolis, IN 46221
$-92
Cash flow
-2.1%
Cash-on-Cash Return
5.7%
Cap rate
0.7%
Rent to Value Ratio
Active
$225,000
3
bds
|
1
ba
|
1,164
sqft
|
built
1958
4909 W Markwood Ave, Indianapolis, IN 46221
$-49
Cash flow
-1.1%
Cash-on-Cash Return
5.9%
Cap rate
0.7%
Rent to Value Ratio
Active
$315,000
3
bds
|
3
ba
|
2,156
sqft
|
built
1975
5403 Honey Comb Ln, Indianapolis, IN 46221
$-372
Cash flow
-6.2%
Cash-on-Cash Return
4.7%
Cap rate
0.6%
Rent to Value Ratio
Active
$101,900
2
bds
|
1
ba
|
1,050
sqft
|
built
1940
3251 Mars Hill St, Indianapolis, IN 46221
$375
Cash flow
19.2%
Cash-on-Cash Return
10.6%
Cap rate
1.3%
Rent to Value Ratio

Active
$150,000
3
bds
|
1
ba
|
855
sqft
|
built
1920
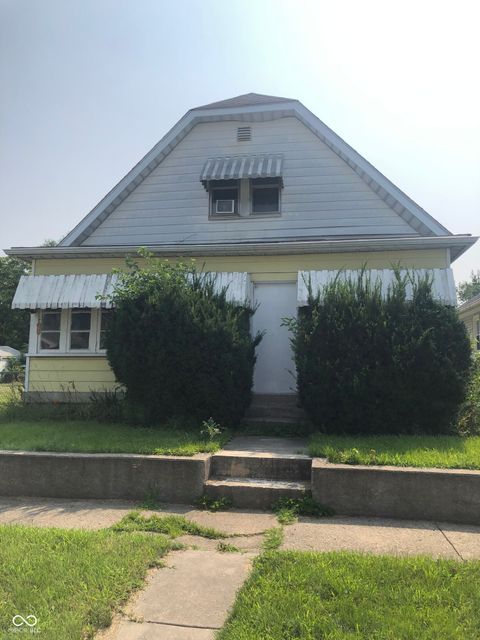
1845 W Wilkins St, Indianapolis, IN 46221
$198
Cash flow
6.9%
Cash-on-Cash Return
7.7%
Cap rate
0.9%
Rent to Value Ratio
Active
$175,000
3
bds
|
1
ba
|
1,176
sqft
|
built
1948
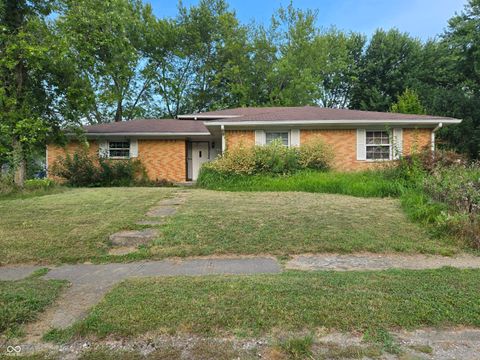
3330 S Mooresville Rd, Indianapolis, IN 46221
$208
Cash flow
6.2%
Cash-on-Cash Return
7.6%
Cap rate
0.9%
Rent to Value Ratio
Active
$245,000
4
bds
|
2
ba
|
1,988
sqft
|
built
1976
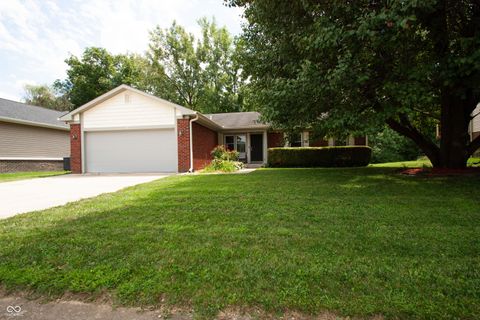
6711 Granner Cir, Indianapolis, IN 46221
$-13
Cash flow
-0.3%
Cash-on-Cash Return
6.1%
Cap rate
0.7%
Rent to Value Ratio
Active
$275,000
3
bds
|
3
ba
|
2,062
sqft
|
built
2002
5410 Claybrooke Dr, Indianapolis, IN 46221
$-191
Cash flow
-3.6%
Cash-on-Cash Return
5.3%
Cap rate
0.7%
Rent to Value Ratio
Active
$284,900
3
bds
|
3
ba
|
1,776
sqft
|
built
1998
7338 Jackie Ct, Indianapolis, IN 46221
$-98
Cash flow
-1.8%
Cash-on-Cash Return
5.7%
Cap rate
0.7%
Rent to Value Ratio
Active
$225,000
3
bds
|
2
ba
|
1,058
sqft
|
built
1997
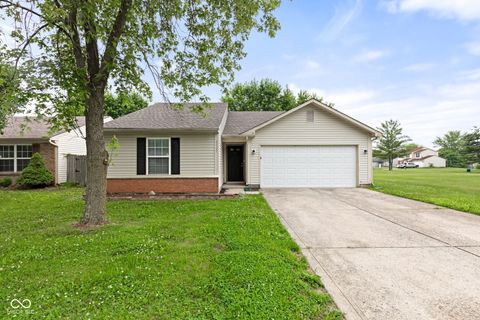
5353 Rolling River Ct, Indianapolis, IN 46221
$-66
Cash flow
-1.5%
Cash-on-Cash Return
5.8%
Cap rate
0.7%
Rent to Value Ratio
Active
$150,000
2
bds
|
1
ba
|
912
sqft
|
built
1925
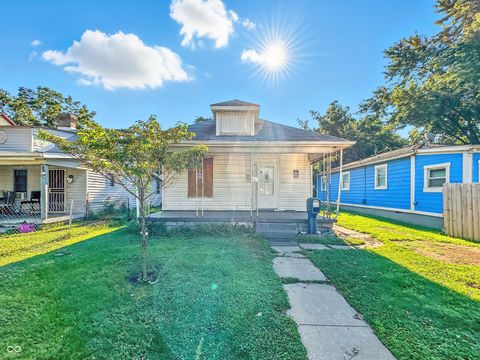
1837 W Wilkins St, Indianapolis, IN 46221
$129
Cash flow
4.5%
Cash-on-Cash Return
7.2%
Cap rate
0.9%
Rent to Value Ratio
Active
$310,000
3
bds
|
2
ba
|
1,225
sqft
|
built
1961
3436 Christie Ct, Indianapolis, IN 46221
$-484
Cash flow
-8.1%
Cash-on-Cash Return
4.3%
Cap rate
0.5%
Rent to Value Ratio
Active
$279,500
3
bds
|
2
ba
|
1,583
sqft
|
built
2013
6326 Emerald Field Way, Indianapolis, IN 46221
$-190
Cash flow
-3.5%
Cash-on-Cash Return
5.3%
Cap rate
0.6%
Rent to Value Ratio
Active
$110,000
2
bds
|
1
ba
|
768
sqft
|
built
1910
2110 W Mc Carty St, Indianapolis, IN 46221
$472
Cash flow
22.4%
Cash-on-Cash Return
11.3%
Cap rate
1.4%
Rent to Value Ratio
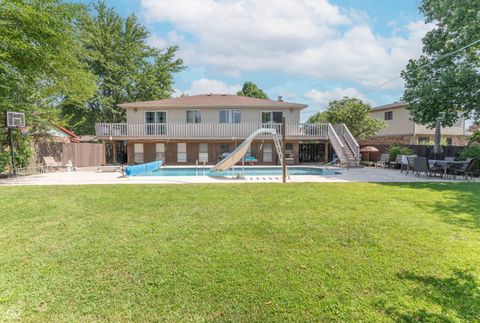
Active
$355,000
3
bds
|
2
ba
|
2,663
sqft
|
built
2001
6051 Copeland Mills Ct, Indianapolis, IN 46221
$-183
Cash flow
-2.7%
Cash-on-Cash Return
5.5%
Cap rate
0.7%
Rent to Value Ratio
Active
$235,000
3
bds
|
2
ba
|
1,319
sqft
|
built
2000
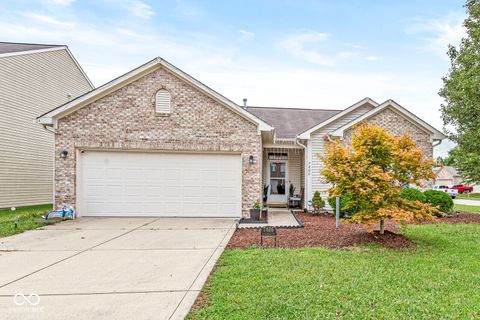
5804 Rolling Bluff Ln, Indianapolis, IN 46221
$-49
Cash flow
-1.1%
Cash-on-Cash Return
5.9%
Cap rate
0.7%
Rent to Value Ratio
Active
$269,900
3
bds
|
2
ba
|
1,428
sqft
|
built
1963
4132 Tincher Rd, Indianapolis, IN 46221
$-3
Cash flow
-0.1%
Cash-on-Cash Return
6.1%
Cap rate
0.7%
Rent to Value Ratio
Active
$180,000
3
bds
|
2
ba
|
1,786
sqft
|
built
1979
6904 Chauncey Dr, Indianapolis, IN 46221
$251
Cash flow
7.3%
Cash-on-Cash Return
7.8%
Cap rate
0.9%
Rent to Value Ratio
Active
$259,900
3
bds
|
2
ba
|
1,451
sqft
|
built
1996
6430 Furnas Rd, Indianapolis, IN 46221
$-97
Cash flow
-1.9%
Cash-on-Cash Return
5.7%
Cap rate
0.7%
Rent to Value Ratio
Active
$194,900
2
bds
|
0
ba
|
0
sqft
|
built
1900
1133 S Richland St, Indianapolis, IN 46221
$-377
Cash flow
-10.1%
Cash-on-Cash Return
3.8%
Cap rate
0.5%
Rent to Value Ratio
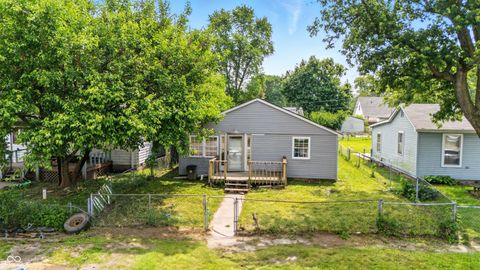
Active
$204,900
3
bds
|
1
ba
|
1,268
sqft
|
built
1957
3571 W Perry St, Indianapolis, IN 46221
$-15
Cash flow
-0.4%
Cash-on-Cash Return
6.1%
Cap rate
0.7%
Rent to Value Ratio
Active
$244,900
3
bds
|
2
ba
|
1,692
sqft
|
built
1962
4546 Laclede St, Indianapolis, IN 46221
$-13
Cash flow
-0.3%
Cash-on-Cash Return
6.1%
Cap rate
0.7%
Rent to Value Ratio
Active
$205,000
3
bds
|
2
ba
|
1,368
sqft
|
built
1980
5707 Mills Rd, Indianapolis, IN 46221
$54
Cash flow
1.4%
Cash-on-Cash Return
6.5%
Cap rate
0.8%
Rent to Value Ratio
Active
$307,000
3
bds
|
3
ba
|
2,147
sqft
|
built
2001
5548 Fair Ridge Pl, Indianapolis, IN 46221
$-231
Cash flow
-3.9%
Cash-on-Cash Return
5.2%
Cap rate
0.7%
Rent to Value Ratio