46221 Investment Properties for Sale
Browse homes for sale and investment properties in 46221. Refine your search by price, property type, or more.
Best cash flowing properties in 46221
Active
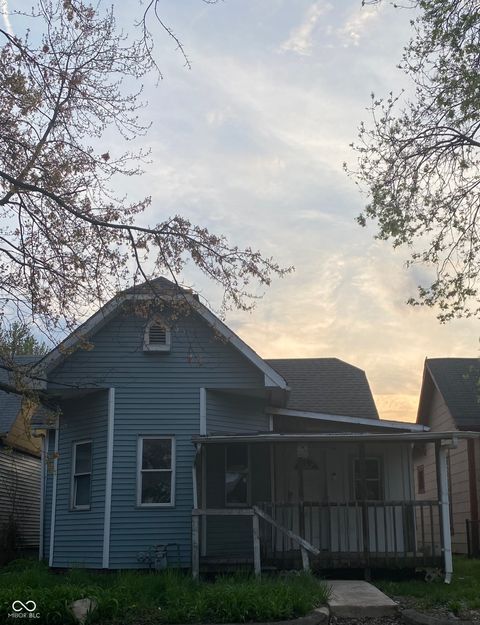
$59,900
3
bds
|
2
ba
|
1,156
sqft
|
built
1920
644 Warren Ave, Indianapolis, IN 46221
$897
Cash flow
17.4%
Cash-on-Cash Return
18.0%
Cap rate
2.2%
Rent to Value Ratio
Active
$380,000
3
bds
|
4
ba
|
4,080
sqft
|
built
1827
7540 S Mooresville Rd, Indianapolis, IN 46221
$431
Cash flow
5.9%
Cash-on-Cash Return
7.6%
Cap rate
0.9%
Rent to Value Ratio
50 out of 55 properties for sale in 46221
Limited Results Shown
Create a free account, or log in to reveal all property listings and enjoy the complete experience.
Active
$249,900
2
bds
|
0
ba
|
0
sqft
|
built
1935
1809 W Morris St, Indianapolis, IN 46221
$-383
Cash flow
-8.0%
Cash-on-Cash Return
4.3%
Cap rate
0.5%
Rent to Value Ratio

Active
$150,000
2
bds
|
1
ba
|
912
sqft
|
built
1925
1837 W Wilkins St, Indianapolis, IN 46221
$114
Cash flow
4.0%
Cash-on-Cash Return
7.2%
Cap rate
0.9%
Rent to Value Ratio
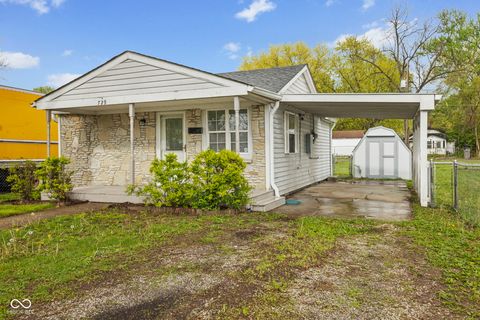
Active
$140,000
2
bds
|
1
ba
|
638
sqft
|
built
1952
729 S Holmes Ave, Indianapolis, IN 46221
$28
Cash flow
1.0%
Cash-on-Cash Return
6.5%
Cap rate
0.8%
Rent to Value Ratio
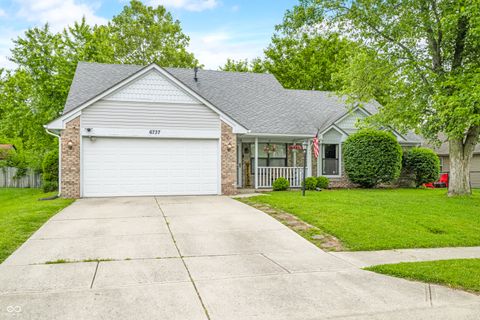
Active
$260,000
4
bds
|
2
ba
|
1,618
sqft
|
built
1994
6737 Raritan Dr, Indianapolis, IN 46221
$-184
Cash flow
-3.7%
Cash-on-Cash Return
5.4%
Cap rate
0.7%
Rent to Value Ratio
Active
$289,900
3
bds
|
3
ba
|
1,848
sqft
|
built
1998
6412 Cradle River Dr, Indianapolis, IN 46221
$-292
Cash flow
-5.3%
Cash-on-Cash Return
5.1%
Cap rate
0.6%
Rent to Value Ratio

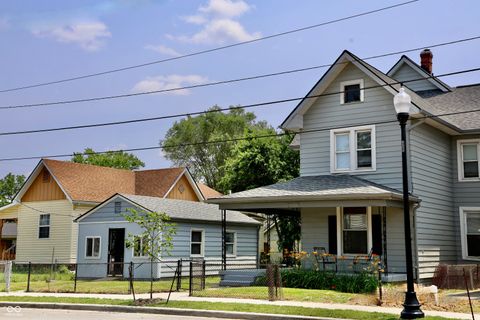
Active
$140,000
2
bds
|
1
ba
|
902
sqft
|
built
1908
1035 S Tremont St, Indianapolis, IN 46221
$97
Cash flow
3.6%
Cash-on-Cash Return
7.1%
Cap rate
0.9%
Rent to Value Ratio
Active
$59,900
3
bds
|
2
ba
|
1,156
sqft
|
built
1920
644 Warren Ave, Indianapolis, IN 46221
$897
Cash flow
17.4%
Cash-on-Cash Return
18.0%
Cap rate
2.2%
Rent to Value Ratio

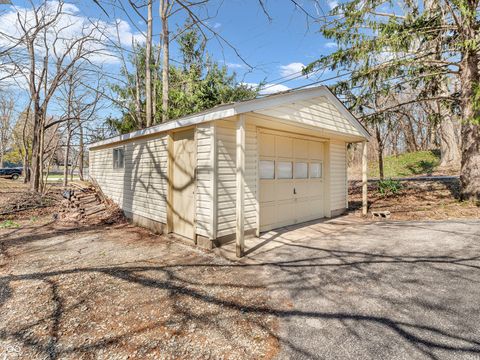
Active
$95,000
1
bds
|
0
ba
|
1,344
sqft
|
built
1939
3321 S Rybolt Ave, Indianapolis, IN 46221
$263
Cash flow
14.4%
Cash-on-Cash Return
9.6%
Cap rate
1.2%
Rent to Value Ratio
Active
$380,000
3
bds
|
4
ba
|
4,080
sqft
|
built
1827
7540 S Mooresville Rd, Indianapolis, IN 46221
$431
Cash flow
5.9%
Cash-on-Cash Return
7.6%
Cap rate
0.9%
Rent to Value Ratio
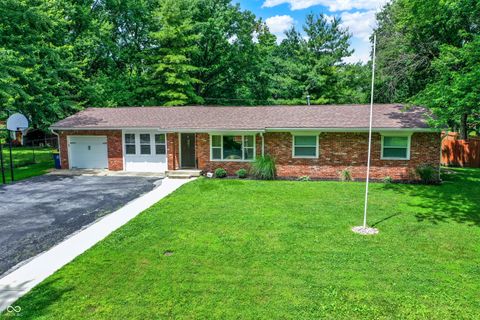
Active
$269,900
3
bds
|
2
ba
|
1,428
sqft
|
built
1963
4132 Tincher Rd, Indianapolis, IN 46221
$-3
Cash flow
-0.1%
Cash-on-Cash Return
6.1%
Cap rate
0.7%
Rent to Value Ratio