60142 Investment Properties for Sale
Browse homes for sale and investment properties in 60142. Refine your search by price, property type, or more.
Best cash flowing properties in 60142
Active
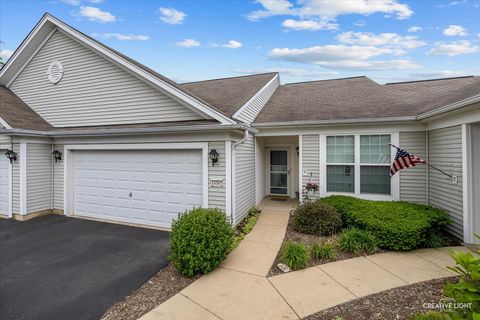
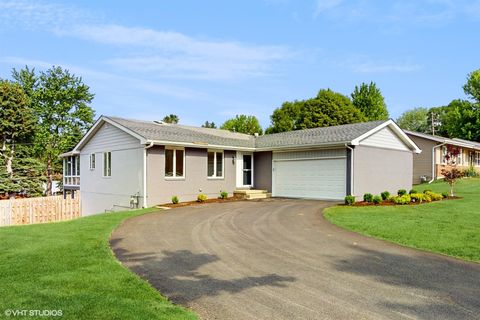
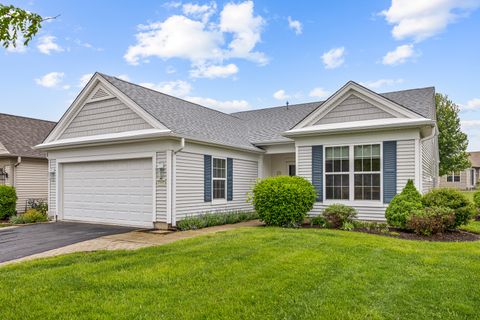
$269,900
2
bds
|
2
ba
|
1,152
sqft
|
built
2004
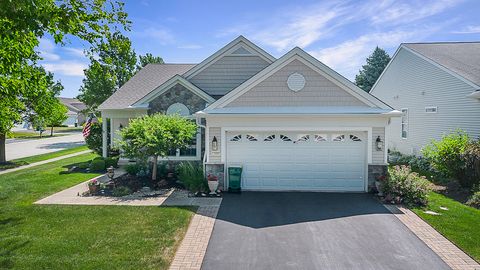
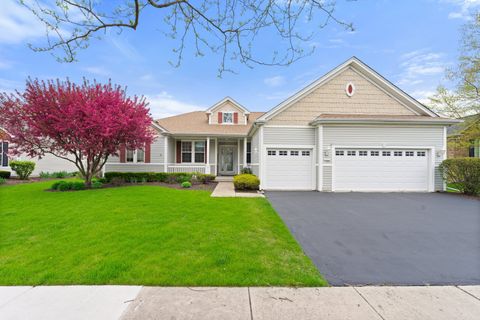
14065 Moraine Hills Dr, Huntley, IL 60142
$-215
Cash flow
-4.2%
Cash-on-Cash Return
4.7%
Cap rate
0.9%
Rent to Value Ratio
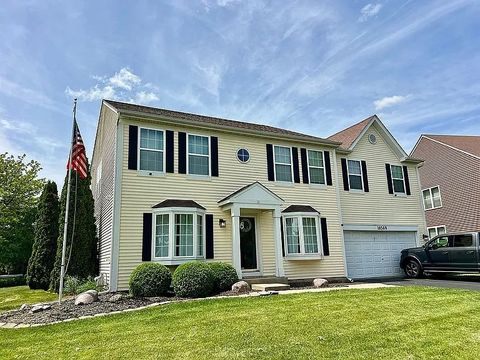
Active
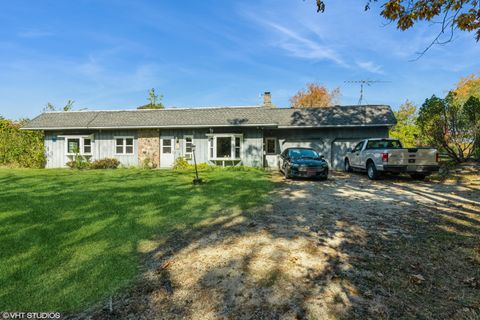
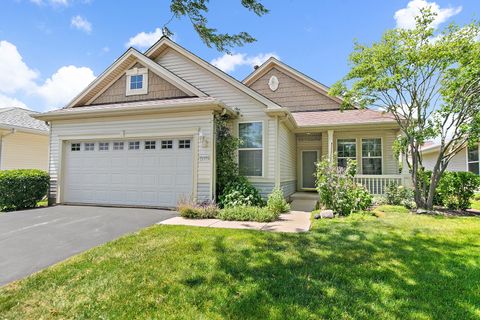
$325,000
2
bds
|
2
ba
|
1,675
sqft
|
built
1986
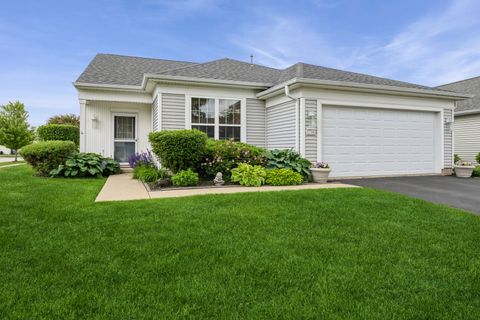
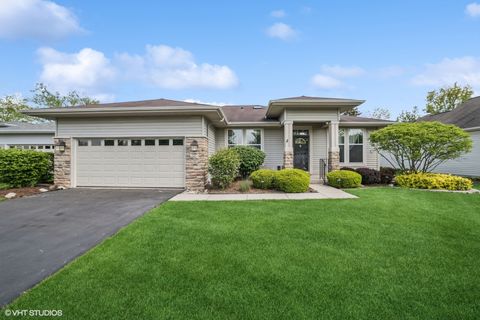
6519 Rowland Rd, Huntley, IL 60142
$-264
Cash flow
-4.2%
Cash-on-Cash Return
4.7%
Cap rate
0.8%
Rent to Value Ratio
29 out of 31 properties for sale in 60142
Limited Results Shown
Create a free account, or log in to reveal all property listings and enjoy the complete experience.
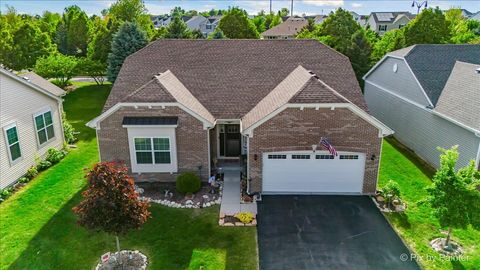
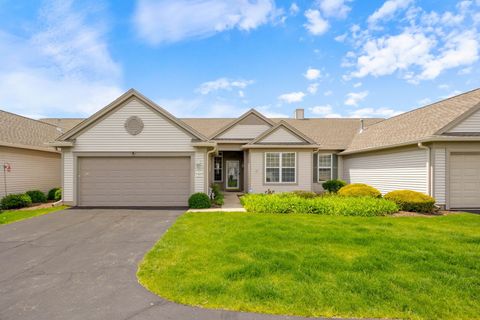
Active
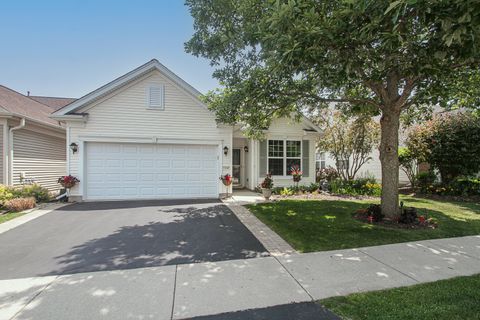
$324,500
2
bds
|
2
ba
|
1,197
sqft
|
built
2006
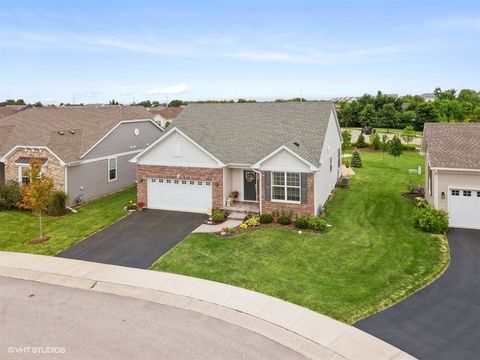
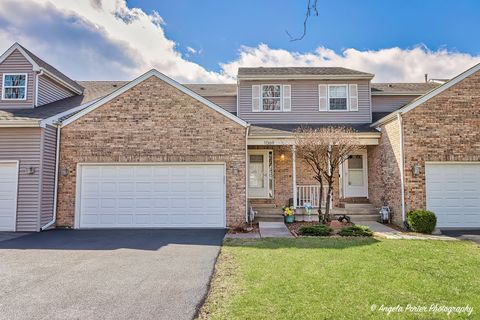
11646 Evergreen Ln, Huntley, IL 60142
$-384
Cash flow
-6.2%
Cash-on-Cash Return
4.3%
Cap rate
0.7%
Rent to Value Ratio
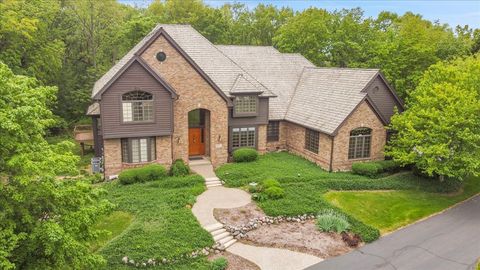
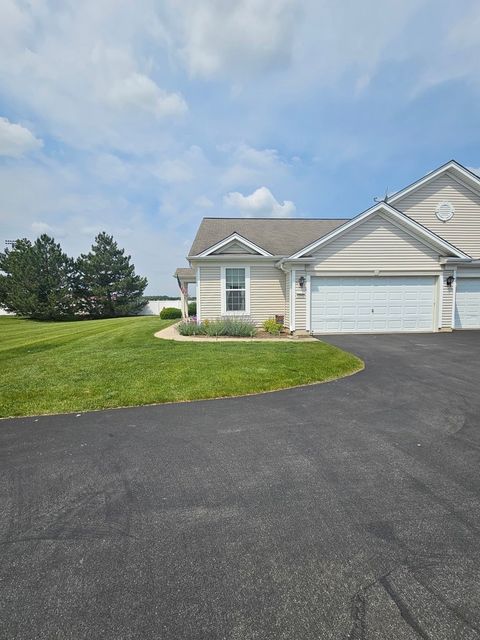
Active
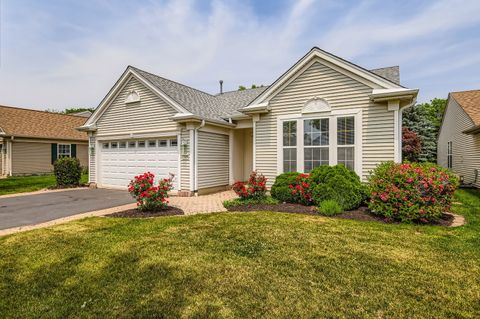
$389,900
3
bds
|
2
ba
|
1,924
sqft
|
built
2003
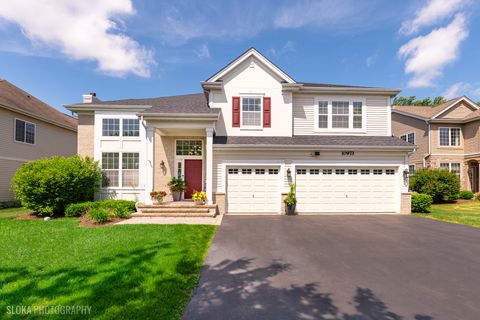
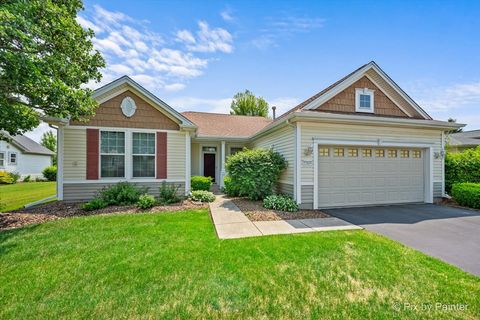
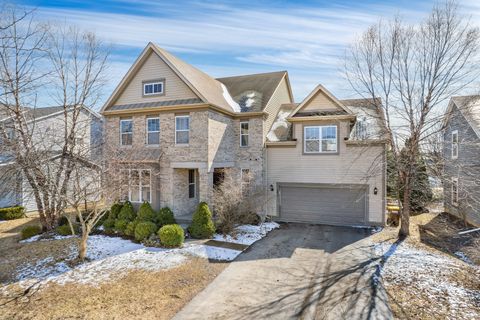
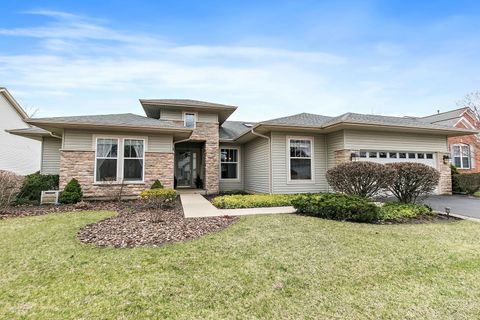
13490 Honeysuckle Dr, Huntley, IL 60142
$-653
Cash flow
-8.7%
Cash-on-Cash Return
3.7%
Cap rate
0.7%
Rent to Value Ratio
Active
$389,900
3
bds
|
3
ba
|
2,806
sqft
|
built
1986
10607 Mathew St, Huntley, IL 60142
$-340
Cash flow
-4.5%
Cash-on-Cash Return
4.6%
Cap rate
0.7%
Rent to Value Ratio
Active
$350,000
2
bds
|
2
ba
|
1,326
sqft
|
built
1999
11773 Wildrose Dr, Huntley, IL 60142
$-498
Cash flow
-7.4%
Cash-on-Cash Return
4.0%
Cap rate
0.7%
Rent to Value Ratio
Active
$435,500
3
bds
|
2
ba
|
1,792
sqft
|
built
2021
11995 Robb Ct, Huntley, IL 60142
$-932
Cash flow
-11.2%
Cash-on-Cash Return
3.7%
Cap rate
0.7%
Rent to Value Ratio
Active
$995,000
5
bds
|
6
ba
|
7,656
sqft
|
built
1996
16001 Burr Oak Dr, Huntley, IL 60142
$-2,574
Cash flow
-13.5%
Cash-on-Cash Return
2.6%
Cap rate
0.5%
Rent to Value Ratio
Active
$589,900
4
bds
|
4
ba
|
3,586
sqft
|
built
2006
10973 Greywall Ln, Huntley, IL 60142
$-1,246
Cash flow
-11.0%
Cash-on-Cash Return
3.1%
Cap rate
0.6%
Rent to Value Ratio

Active
$395,900
2
bds
|
2
ba
|
1,788
sqft
|
built
2001
13005 Big Horn Dr, Huntley, IL 60142
$-683
Cash flow
-9.0%
Cash-on-Cash Return
3.6%
Cap rate
0.6%
Rent to Value Ratio
Active
$574,900
4
bds
|
4
ba
|
3,515
sqft
|
built
2003
10592 Capitol Ln, Huntley, IL 60142
$-1,108
Cash flow
-10.1%
Cash-on-Cash Return
3.4%
Cap rate
0.6%
Rent to Value Ratio
Active
$364,900
2
bds
|
2
ba
|
1,566
sqft
|
built
2005
11837 Messiner Dr, Huntley, IL 60142
$-925
Cash flow
-13.2%
Cash-on-Cash Return
3.2%
Cap rate
0.7%
Rent to Value Ratio
Active
$389,900
3
bds
|
2
ba
|
1,924
sqft
|
built
2006
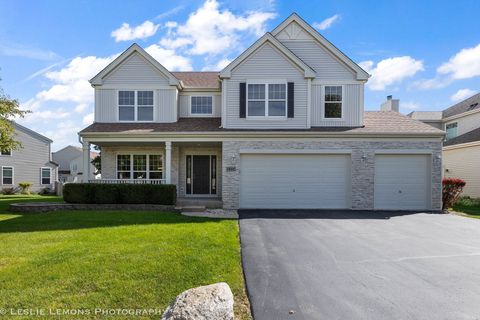
11768 Chatfield Xing, Huntley, IL 60142
$-1,004
Cash flow
-13.4%
Cash-on-Cash Return
3.1%
Cap rate
0.7%
Rent to Value Ratio

Active
$474,900
4
bds
|
3
ba
|
2,220
sqft
|
built
2005
9312 Bristol Ln, Huntley, IL 60142
$-1,192
Cash flow
-13.1%
Cash-on-Cash Return
2.7%
Cap rate
0.5%
Rent to Value Ratio
Active
$445,000
2
bds
|
2
ba
|
1,969
sqft
|
built
2005
11642 Sunderlin Dr, Huntley, IL 60142
$-1,219
Cash flow
-14.3%
Cash-on-Cash Return
2.4%
Cap rate
0.6%
Rent to Value Ratio
Active
$415,000
2
bds
|
2
ba
|
1,984
sqft
|
built
2004
12140 Hideaway Dr, Huntley, IL 60142
$-825
Cash flow
-10.4%
Cash-on-Cash Return
3.3%
Cap rate
0.7%
Rent to Value Ratio
Active
$440,000
2
bds
|
2
ba
|
1,428
sqft
|
built
2019
11820 Zenk Ct, Huntley, IL 60142
$-1,246
Cash flow
-14.8%
Cash-on-Cash Return
2.8%
Cap rate
0.6%
Rent to Value Ratio
Active
$359,900
2
bds
|
2
ba
|
1,624
sqft
|
built
2000
12849 Milbrook Dr, Huntley, IL 60142
$-610
Cash flow
-8.8%
Cash-on-Cash Return
3.6%
Cap rate
0.7%
Rent to Value Ratio
Active
$440,000
2
bds
|
2
ba
|
1,906
sqft
|
built
2005
11692 Sunderlin Dr, Huntley, IL 60142
$-842
Cash flow
-10.0%
Cash-on-Cash Return
3.4%
Cap rate
0.6%
Rent to Value Ratio
Active
$498,000
5
bds
|
5
ba
|
3,003
sqft
|
built
2001
10569 Lancaster St, Huntley, IL 60142
$-842
Cash flow
-8.8%
Cash-on-Cash Return
3.7%
Cap rate
0.7%
Rent to Value Ratio
Active
$339,500
2
bds
|
2
ba
|
1,543
sqft
|
built
2004
13663 Whittingham Ln, Huntley, IL 60142
$-631
Cash flow
-9.7%
Cash-on-Cash Return
3.4%
Cap rate
0.6%
Rent to Value Ratio

Active
$539,900
4
bds
|
3
ba
|
3,044
sqft
|
built
2022
10119 Central Park Blvd, Huntley, IL 60142
$-652
Cash flow
-6.3%
Cash-on-Cash Return
4.2%
Cap rate
0.7%
Rent to Value Ratio
Active
$285,000
2
bds
|
2
ba
|
1,192
sqft
|
built
2006
13592 Delaney Rd, Huntley, IL 60142
$-653
Cash flow
-12.0%
Cash-on-Cash Return
2.9%
Cap rate
0.8%
Rent to Value Ratio
Active
$584,900
3
bds
|
3
ba
|
2,641
sqft
|
built
1999
13004 Illinois Dr, Huntley, IL 60142
$-1,525
Cash flow
-13.6%
Cash-on-Cash Return
2.6%
Cap rate
0.5%
Rent to Value Ratio
Active
$439,500
2
bds
|
2
ba
|
1,796
sqft
|
built
1999
12984 Stone Creek Ct, Huntley, IL 60142
$-609
Cash flow
-7.2%
Cash-on-Cash Return
4.0%
Cap rate
0.6%
Rent to Value Ratio
Active
$585,000
4
bds
|
5
ba
|
4,565
sqft
|
built
2004
10905 Manhattan Dr, Huntley, IL 60142
$-1,478
Cash flow
-13.2%
Cash-on-Cash Return
3.2%
Cap rate
0.6%
Rent to Value Ratio
Active
$535,000
4
bds
|
3
ba
|
5,721
sqft
|
built
2007
11253 Victoria Ln, Huntley, IL 60142
$-793
Cash flow
-7.7%
Cash-on-Cash Return
3.9%
Cap rate
0.7%
Rent to Value Ratio
Active
$279,900
2
bds
|
3
ba
|
2,280
sqft
|
built
1994
11369 Timer Dr, Huntley, IL 60142
$-657
Cash flow
-12.2%
Cash-on-Cash Return
2.9%
Cap rate
0.7%
Rent to Value Ratio
Active
$550,000
2
bds
|
3
ba
|
2,575
sqft
|
built
1999
12669 Cold Springs Dr, Huntley, IL 60142
$-1,435
Cash flow
-13.6%
Cash-on-Cash Return
2.5%
Cap rate
0.6%
Rent to Value Ratio