60462 Investment Properties for Sale
Browse homes for sale and investment properties in 60462. Refine your search by price, property type, or more.
Best cash flowing properties in 60462
Active
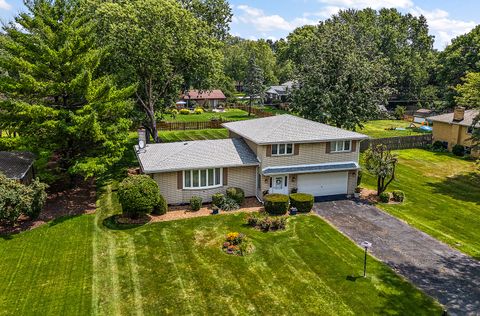
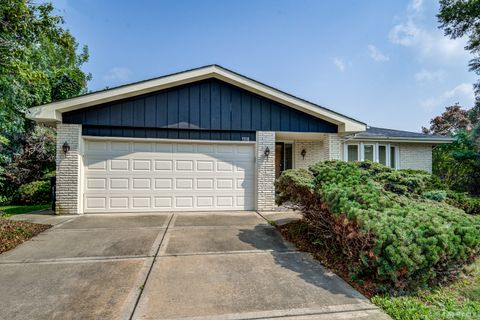
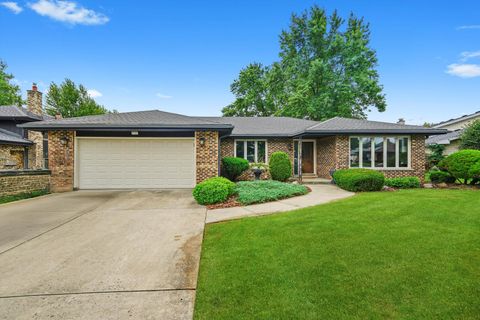
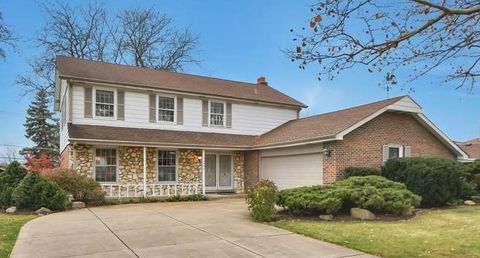
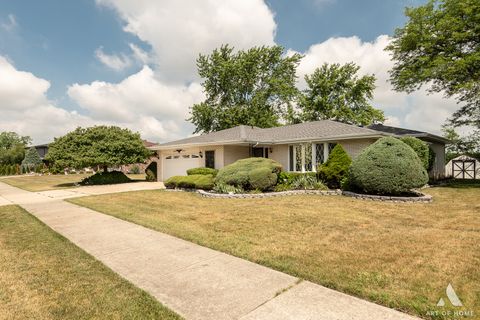
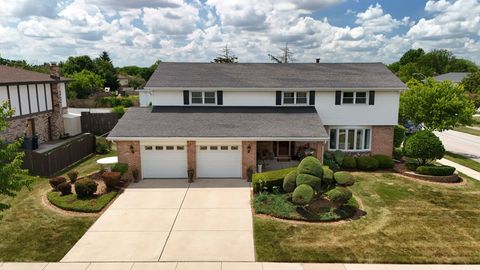
$399,000
3
bds
|
3
ba
|
2,542
sqft
|
built
1967
14939 S 81st Ct, Orland Park, IL 60462
$85
Cash flow
1.1%
Cash-on-Cash Return
5.9%
Cap rate
0.8%
Rent to Value Ratio
Active
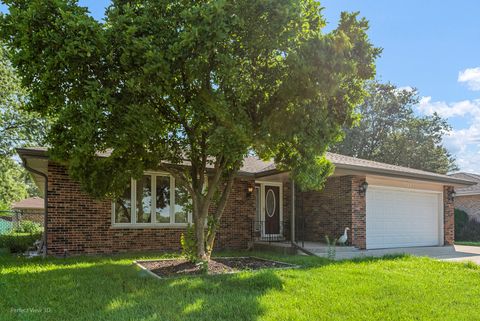
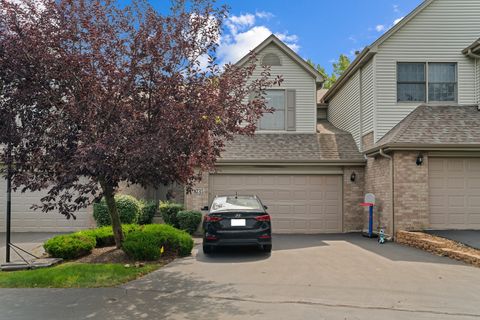
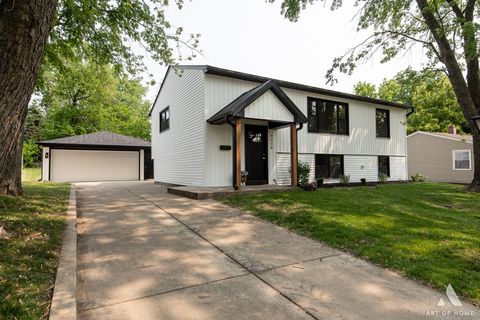
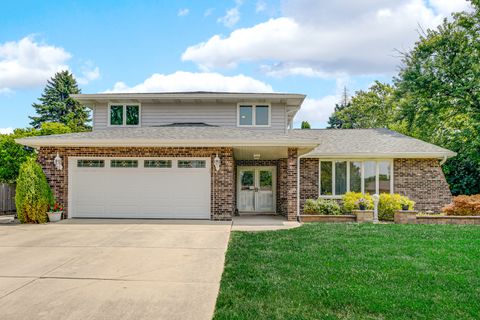
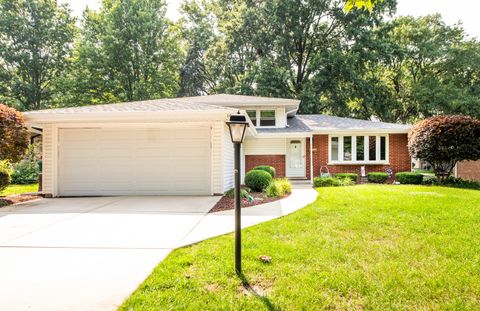
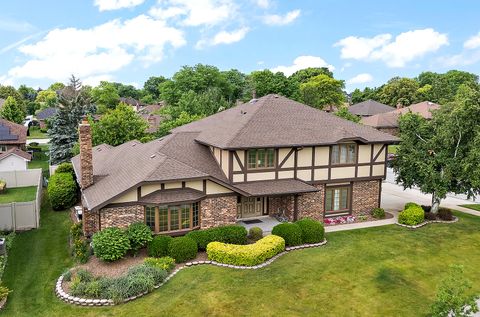
$385,000
3
bds
|
2
ba
|
1,746
sqft
|
built
1977
7738 Wheeler Dr, Orland Park, IL 60462
$52
Cash flow
0.7%
Cash-on-Cash Return
5.8%
Cap rate
0.8%
Rent to Value Ratio
34 out of 38 properties for sale in 60462
Limited Results Shown
Create a free account, or log in to reveal all property listings and enjoy the complete experience.
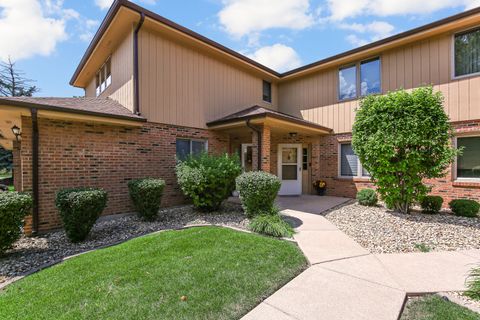
Active
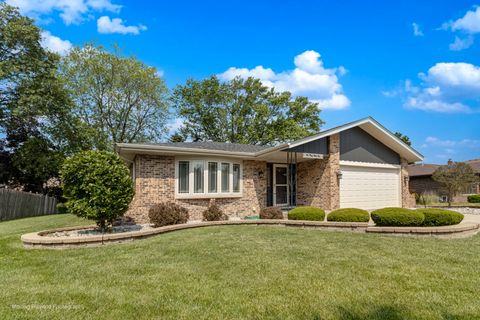
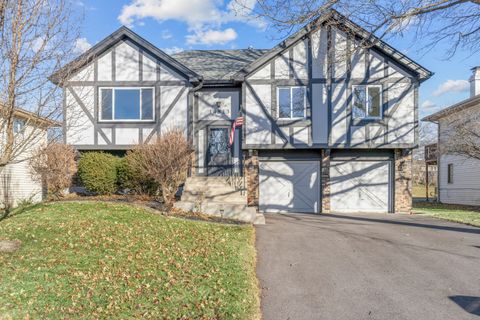
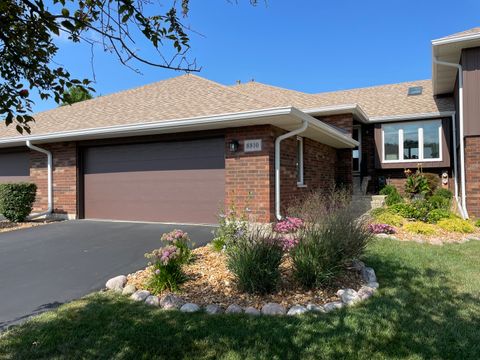
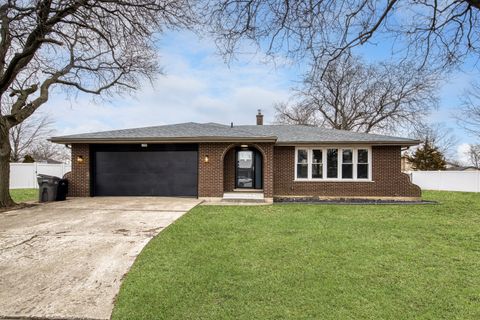
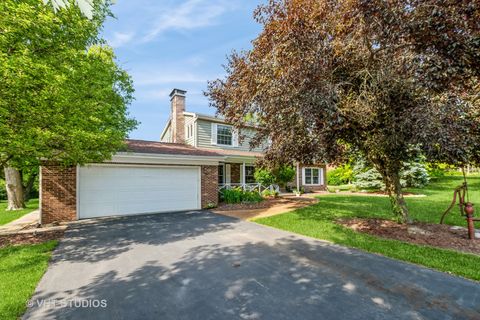
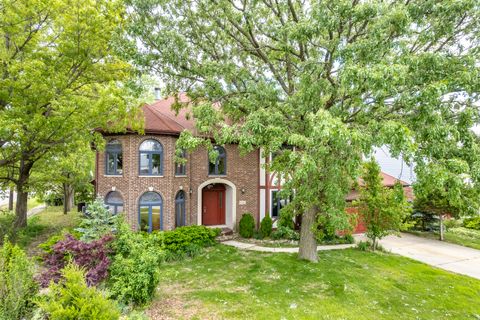
$435,000
3
bds
|
2
ba
|
1,832
sqft
|
built
1974
14034 S 84th Ave, Orland Park, IL 60462
$-602
Cash flow
-7.2%
Cash-on-Cash Return
4.0%
Cap rate
0.7%
Rent to Value Ratio
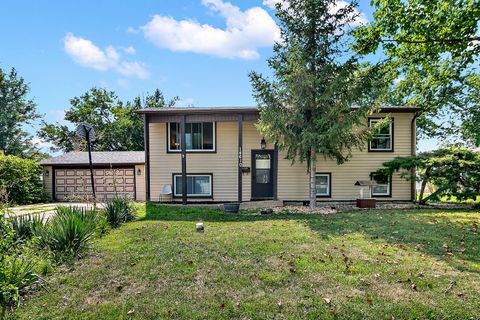
Active
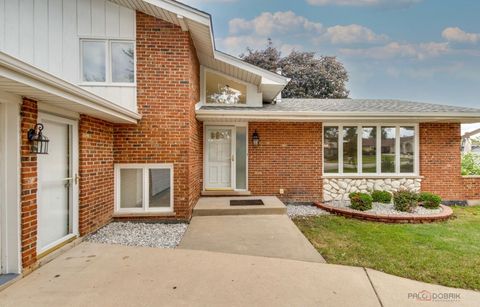
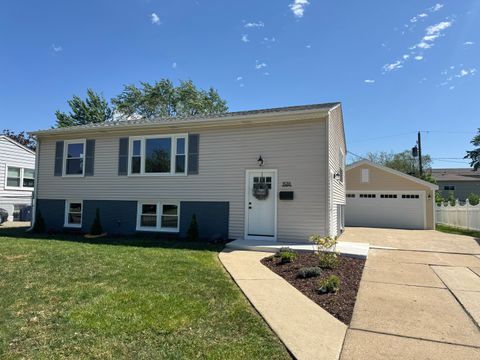
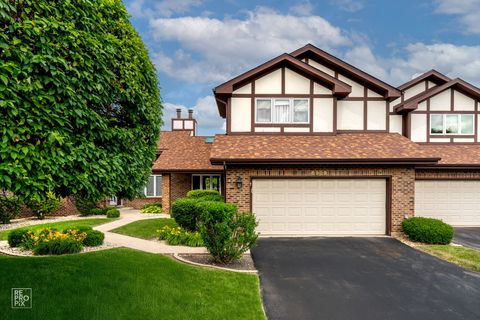
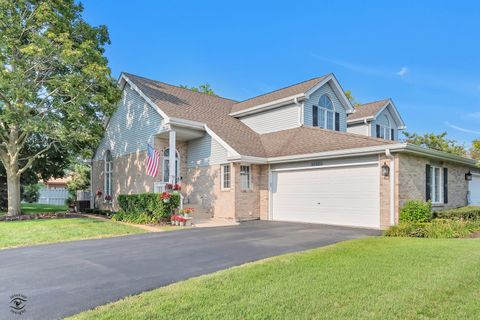
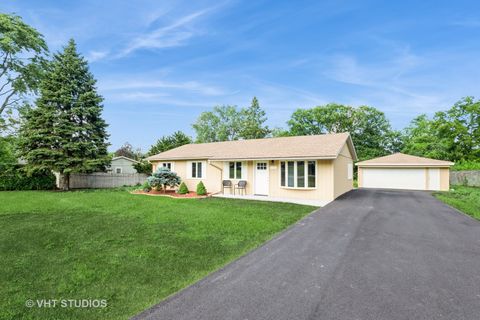
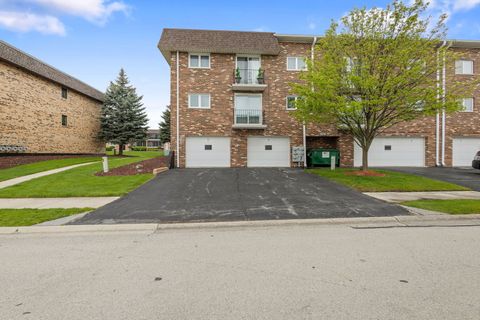
$569,999
4
bds
|
4
ba
|
3,780
sqft
|
built
1976
14739 Maple Ave, Orland Park, IL 60462
$-758
Cash flow
-6.9%
Cash-on-Cash Return
4.1%
Cap rate
0.6%
Rent to Value Ratio
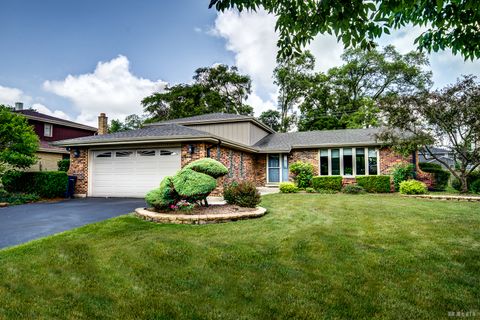
Active
$365,000
3
bds
|
2
ba
|
1,834
sqft
|
built
1985
7718 W 157th Pl, Orland Park, IL 60462
$-314
Cash flow
-4.5%
Cash-on-Cash Return
4.6%
Cap rate
0.9%
Rent to Value Ratio
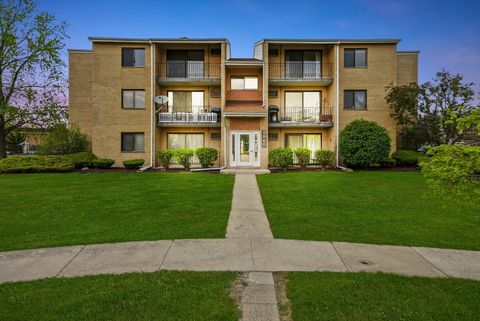
Active
$399,000
3
bds
|
3
ba
|
2,605
sqft
|
built
1998
8735 Golden Rose Dr, Orland Park, IL 60462
$-466
Cash flow
-6.1%
Cash-on-Cash Return
4.3%
Cap rate
0.8%
Rent to Value Ratio
Active
$399,000
3
bds
|
2
ba
|
1,950
sqft
|
built
1970
14813 Holly Ct, Orland Park, IL 60462
$47
Cash flow
0.6%
Cash-on-Cash Return
5.8%
Cap rate
0.9%
Rent to Value Ratio
Active
$409,500
3
bds
|
2
ba
|
2,028
sqft
|
built
1963
9055 Fairway Dr, Orland Park, IL 60462
$-728
Cash flow
-9.3%
Cash-on-Cash Return
3.5%
Cap rate
0.6%
Rent to Value Ratio
Active
$499,900
3
bds
|
3
ba
|
2,000
sqft
|
built
1974
7747 Cashew Dr, Orland Park, IL 60462
$-889
Cash flow
-9.3%
Cash-on-Cash Return
3.5%
Cap rate
0.6%
Rent to Value Ratio
Active
$419,900
4
bds
|
2
ba
|
1,870
sqft
|
built
1963
9058 Caddy Ct, Orland Park, IL 60462
$-1,032
Cash flow
-12.8%
Cash-on-Cash Return
2.7%
Cap rate
0.5%
Rent to Value Ratio
Active
$425,000
3
bds
|
3
ba
|
2,500
sqft
|
built
1989
8810 Clearview Dr, Orland Park, IL 60462
$-1,269
Cash flow
-15.6%
Cash-on-Cash Return
2.1%
Cap rate
0.5%
Rent to Value Ratio
Active
$365,000
3
bds
|
3
ba
|
2,000
sqft
|
built
1991
8909 Silverdale Dr, Orland Park, IL 60462
$-383
Cash flow
-5.5%
Cash-on-Cash Return
4.4%
Cap rate
0.9%
Rent to Value Ratio
Active
$429,900
4
bds
|
3
ba
|
2,220
sqft
|
built
1974
14508 Maycliff Dr, Orland Park, IL 60462
$-308
Cash flow
-3.7%
Cash-on-Cash Return
4.8%
Cap rate
0.8%
Rent to Value Ratio
Active
$482,000
3
bds
|
3
ba
|
2,492
sqft
|
built
1979
14125 Trenton Ave, Orland Park, IL 60462
$-554
Cash flow
-6.0%
Cash-on-Cash Return
4.3%
Cap rate
0.7%
Rent to Value Ratio
Active
$485,000
6
bds
|
3
ba
|
1,817
sqft
|
built
1973
15245 Narcissus Ct, Orland Park, IL 60462
$-842
Cash flow
-9.1%
Cash-on-Cash Return
3.6%
Cap rate
0.7%
Rent to Value Ratio
Active
$390,000
2
bds
|
3
ba
|
2,076
sqft
|
built
1998
15301 Wilshire Dr, Orland Park, IL 60462
$-460
Cash flow
-6.2%
Cash-on-Cash Return
4.3%
Cap rate
0.8%
Rent to Value Ratio
Active
$419,900
3
bds
|
3
ba
|
1,773
sqft
|
built
1974
8226 Bob O Link Rd, Orland Park, IL 60462
$-343
Cash flow
-4.3%
Cash-on-Cash Return
4.7%
Cap rate
0.8%
Rent to Value Ratio
Active
$359,900
3
bds
|
2
ba
|
1,635
sqft
|
built
1968
14440 Brentwood St, Orland Park, IL 60462
$-328
Cash flow
-4.8%
Cash-on-Cash Return
4.6%
Cap rate
0.8%
Rent to Value Ratio
Active
$599,900
4
bds
|
3
ba
|
2,235
sqft
|
built
1963
7820 Forestview Dr, Orland Park, IL 60462
$-587
Cash flow
-5.1%
Cash-on-Cash Return
4.5%
Cap rate
0.7%
Rent to Value Ratio
Active
$362,000
3
bds
|
2
ba
|
1,242
sqft
|
built
1960
16151 Laurel Dr, Orland Park, IL 60462
$-231
Cash flow
-3.3%
Cash-on-Cash Return
4.9%
Cap rate
0.8%
Rent to Value Ratio
Active
$289,900
2
bds
|
2
ba
|
1,600
sqft
|
built
1991
8966 Silverdale Dr, Orland Park, IL 60462
$-383
Cash flow
-6.9%
Cash-on-Cash Return
4.1%
Cap rate
0.9%
Rent to Value Ratio
Active
$375,000
4
bds
|
2
ba
|
2,028
sqft
|
built
1963
14610 Birch St, Orland Park, IL 60462
$-448
Cash flow
-6.2%
Cash-on-Cash Return
4.2%
Cap rate
0.7%
Rent to Value Ratio
Active
$456,000
3
bds
|
3
ba
|
2,145
sqft
|
built
1978
13520 Idlewild Dr, Orland Park, IL 60462
$-411
Cash flow
-4.7%
Cash-on-Cash Return
4.6%
Cap rate
0.8%
Rent to Value Ratio
Active
$175,000
2
bds
|
2
ba
|
1,000
sqft
|
built
1978
9960 Franchesca Ct, Orland Park, IL 60462
$-204
Cash flow
-6.1%
Cash-on-Cash Return
4.3%
Cap rate
1.0%
Rent to Value Ratio
Active
$559,000
4
bds
|
3
ba
|
3,540
sqft
|
built
1978
15624 Sunset Ridge Dr, Orland Park, IL 60462
$-886
Cash flow
-8.3%
Cash-on-Cash Return
3.8%
Cap rate
0.7%
Rent to Value Ratio
Active
$619,000
4
bds
|
3
ba
|
4,400
sqft
|
built
1987
8257 Chertsey Ct, Orland Park, IL 60462
$-1,361
Cash flow
-11.5%
Cash-on-Cash Return
3.0%
Cap rate
0.6%
Rent to Value Ratio

Active
$559,000
4
bds
|
4
ba
|
2,823
sqft
|
built
1981
7723 W 157th St, Orland Park, IL 60462
$-550
Cash flow
-5.1%
Cash-on-Cash Return
4.5%
Cap rate
0.8%
Rent to Value Ratio
Active
$480,000
5
bds
|
4
ba
|
3,208
sqft
|
built
1986
14301 Wooded Path Ln, Orland Park, IL 60462
$-219
Cash flow
-2.4%
Cash-on-Cash Return
5.1%
Cap rate
0.9%
Rent to Value Ratio
Active
$287,000
3
bds
|
2
ba
|
1,250
sqft
|
built
1982
15714 Brassie Ct, Orland Park, IL 60462
$-348
Cash flow
-6.3%
Cash-on-Cash Return
4.2%
Cap rate
0.9%
Rent to Value Ratio
Active
$799,000
6
bds
|
5
ba
|
4,468
sqft
|
built
1992
8005 Trafalgar Ct, Orland Park, IL 60462
$-1,530
Cash flow
-10.0%
Cash-on-Cash Return
3.4%
Cap rate
0.6%
Rent to Value Ratio
Active
$424,500
3
bds
|
3
ba
|
2,080
sqft
|
built
1964
14602 Beech St, Orland Park, IL 60462
$-48
Cash flow
-0.6%
Cash-on-Cash Return
5.5%
Cap rate
0.9%
Rent to Value Ratio
Active
$354,900
5
bds
|
2
ba
|
1,890
sqft
|
built
1960
8721 W 169th St, Orland Park, IL 60462
$-134
Cash flow
-2.0%
Cash-on-Cash Return
5.2%
Cap rate
0.9%
Rent to Value Ratio
Active
$184,900
2
bds
|
1
ba
|
1,000
sqft
|
built
1979
9114 W 140th St, Orland Park, IL 60462
$-69
Cash flow
-1.9%
Cash-on-Cash Return
5.2%
Cap rate
1.1%
Rent to Value Ratio
Active
$913,900
5
bds
|
5
ba
|
4,900
sqft
|
built
2003
14040 Boxwood Ln, Orland Park, IL 60462
$-1,094
Cash flow
-6.2%
Cash-on-Cash Return
4.2%
Cap rate
0.8%
Rent to Value Ratio