60657 Investment Properties for Sale
Browse homes for sale and investment properties in 60657. Refine your search by price, property type, or more.
Best cash flowing properties in 60657
Active
$210,000
1
bds
|
1
ba
|
0
sqft
|
built
1950
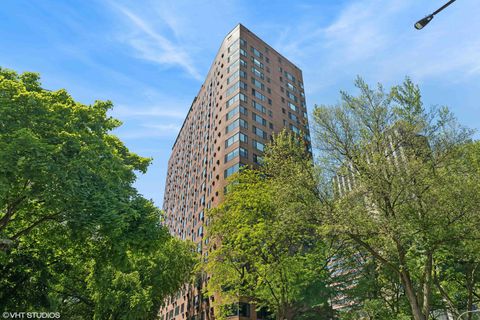
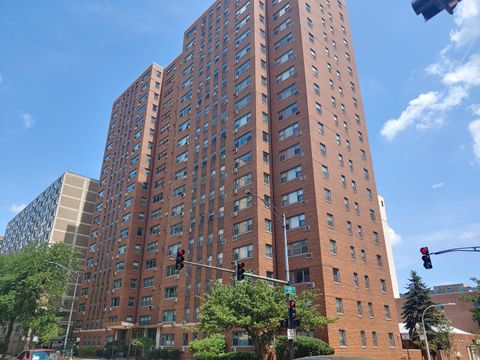
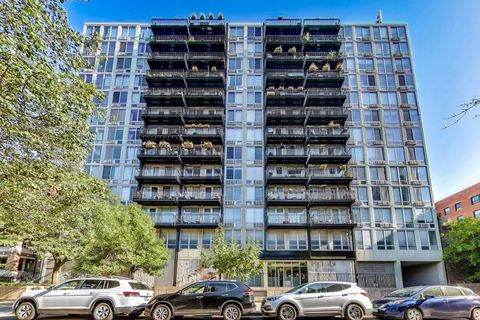
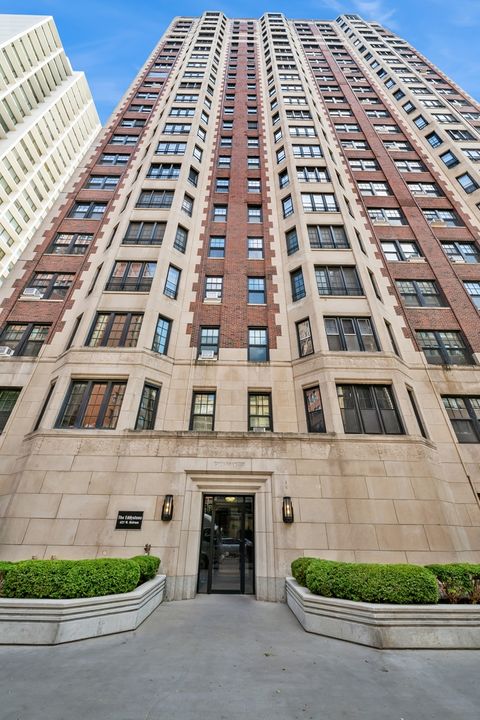
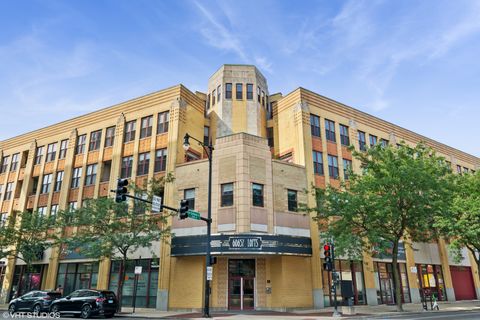
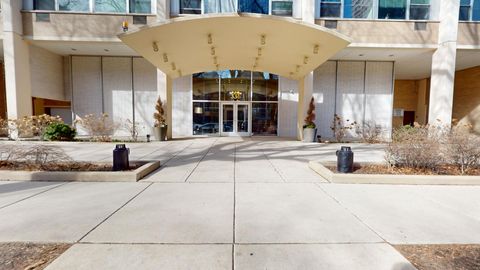
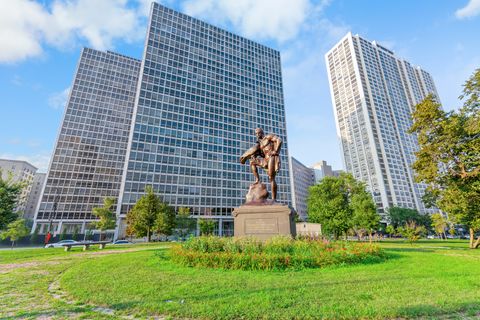
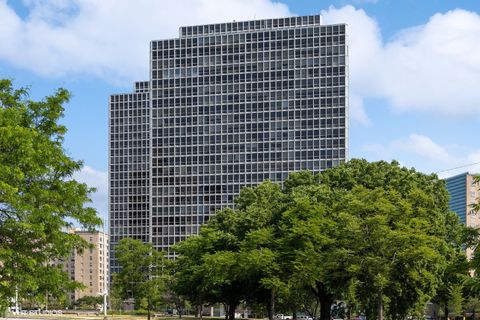
3100 N Lake Shore Dr, Chicago, IL 60657
$-38
Cash flow
-0.9%
Cash-on-Cash Return
5.5%
Cap rate
1.2%
Rent to Value Ratio
Active
$180,000
0
bds
|
1
ba
|
525
sqft
|
built
1967
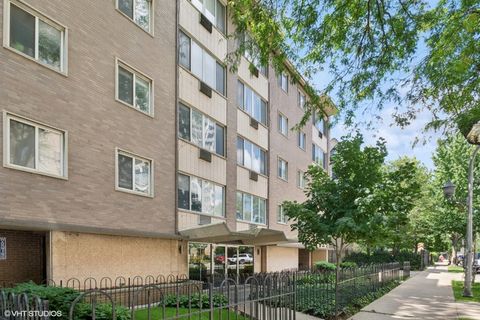
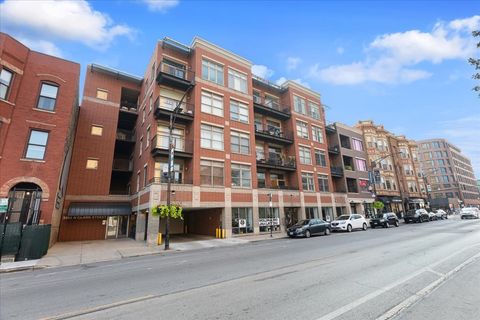
539 W Stratford Pl, Chicago, IL 60657
$-120
Cash flow
-3.5%
Cash-on-Cash Return
4.9%
Cap rate
0.9%
Rent to Value Ratio
66 out of 82 properties for sale in 60657
Limited Results Shown
Create a free account, or log in to reveal all property listings and enjoy the complete experience.
Active
$290,000
1
bds
|
1
ba
|
0
sqft
|
built
1969
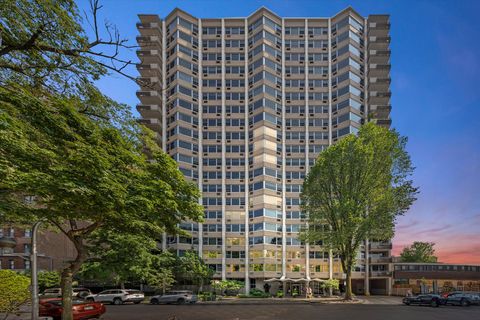
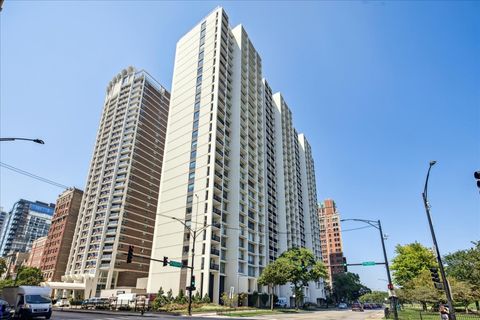
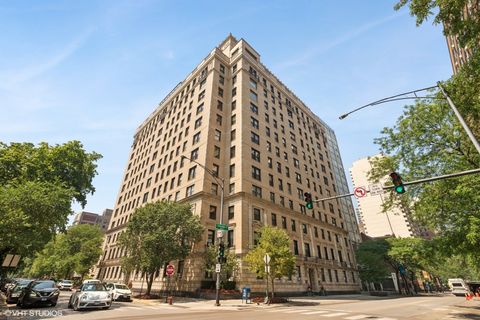
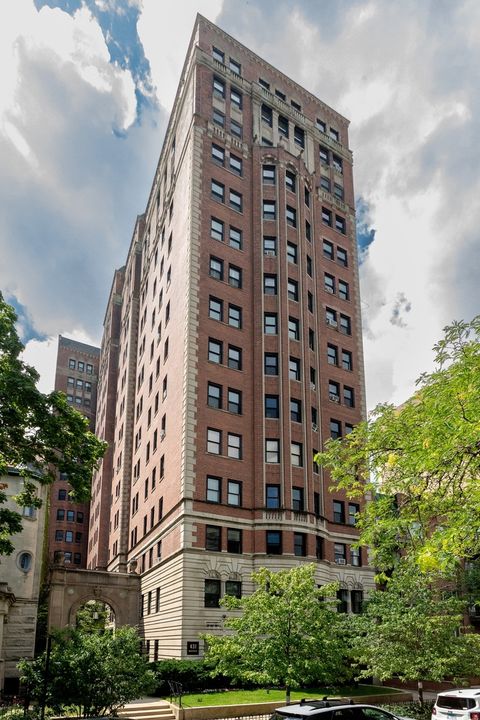
2800 N Lake Shore Dr, Chicago, IL 60657
$-378
Cash flow
-6.8%
Cash-on-Cash Return
4.1%
Cap rate
1.0%
Rent to Value Ratio

Active
$649,900
2
bds
|
2
ba
|
2,200
sqft
|
built
1998
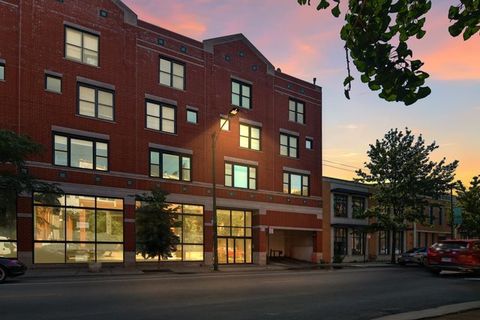
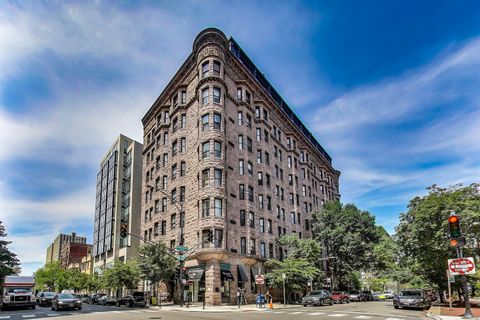
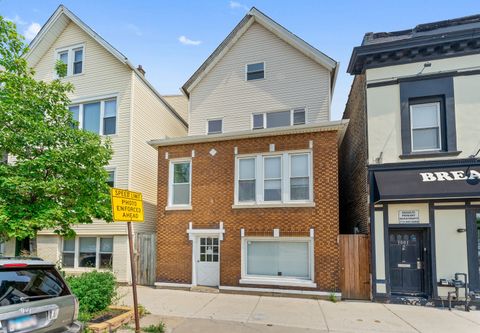
1322 W Belmont Ave, Chicago, IL 60657
$-1,717
Cash flow
-13.8%
Cash-on-Cash Return
2.5%
Cap rate
0.5%
Rent to Value Ratio
Active
$425,000
2
bds
|
3
ba
|
1,500
sqft
|
built
1960
555 W Cornelia Ave, Chicago, IL 60657
$-2,021
Cash flow
-24.8%
Cash-on-Cash Return
0.0%
Cap rate
0.8%
Rent to Value Ratio
Active
$199,000
1
bds
|
1
ba
|
0
sqft
|
built
1952
2909 N Sheridan Rd, Chicago, IL 60657
$-367
Cash flow
-9.6%
Cash-on-Cash Return
3.5%
Cap rate
1.1%
Rent to Value Ratio
Active
$400,000
2
bds
|
1
ba
|
0
sqft
|
built
1920
527 W Surf St, Chicago, IL 60657
$-646
Cash flow
-8.4%
Cash-on-Cash Return
3.7%
Cap rate
0.8%
Rent to Value Ratio
Active
$399,900
2
bds
|
2
ba
|
0
sqft
|
built
1926
509 W Aldine Ave, Chicago, IL 60657
$-800
Cash flow
-10.4%
Cash-on-Cash Return
3.3%
Cap rate
0.8%
Rent to Value Ratio

Active
$799,000
3
bds
|
3
ba
|
2,200
sqft
|
built
2004
911 W Roscoe St, Chicago, IL 60657
$-1,632
Cash flow
-10.7%
Cash-on-Cash Return
3.2%
Cap rate
0.6%
Rent to Value Ratio
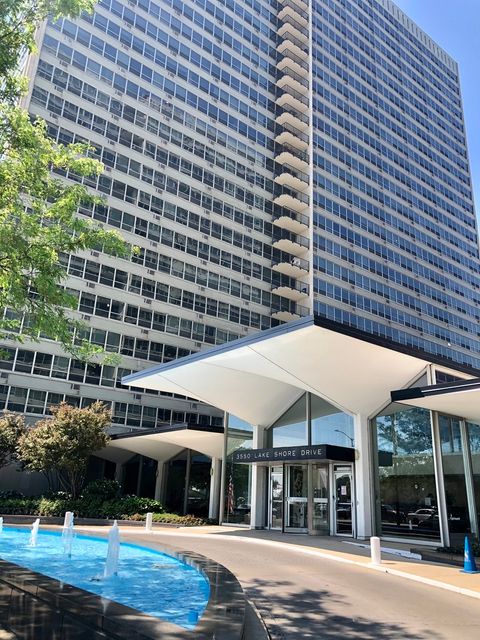
Active
$209,900
1
bds
|
1
ba
|
0
sqft
|
built
1962
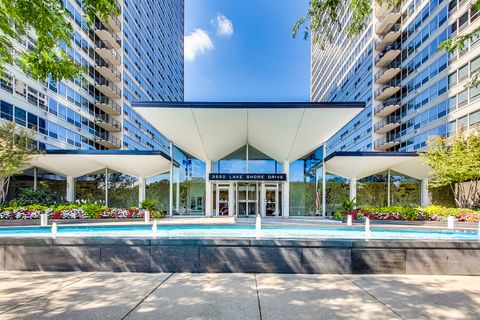
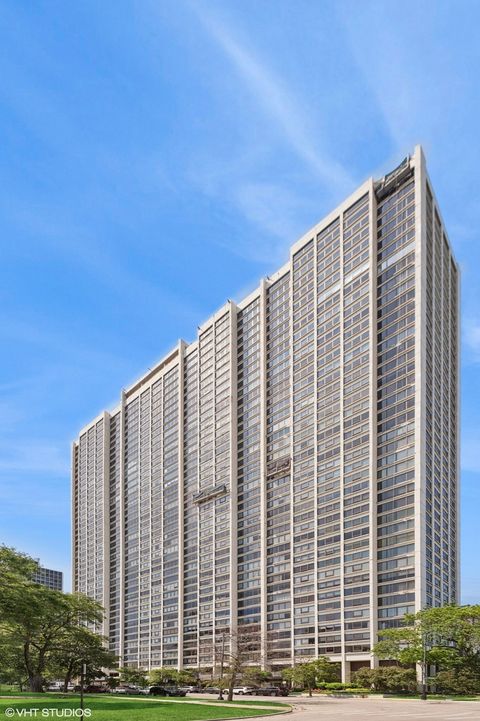
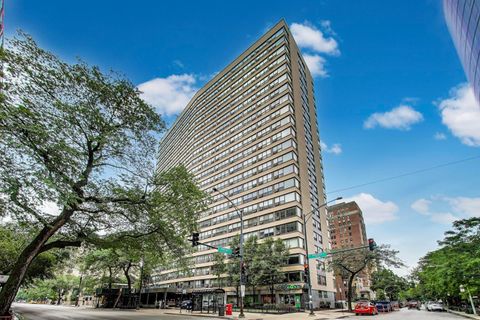
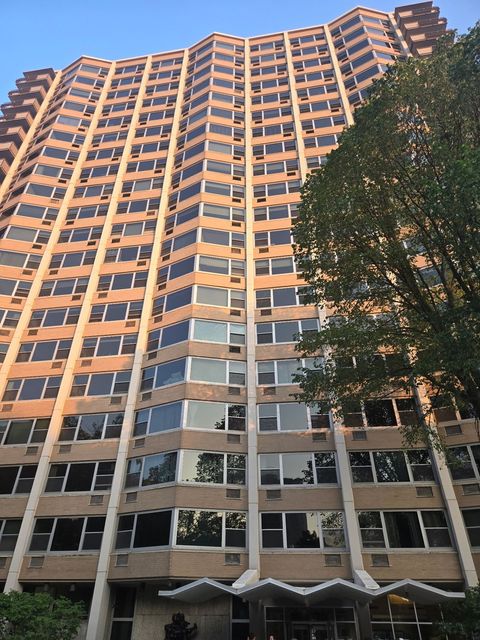
3550 N Lake Shore Dr, Chicago, IL 60657
$-255
Cash flow
-6.3%
Cash-on-Cash Return
4.2%
Cap rate
0.9%
Rent to Value Ratio
Active
$874,999
4
bds
|
3
ba
|
0
sqft
|
built
2000
2840 N Lincoln Ave, Chicago, IL 60657
$-2,588
Cash flow
-15.4%
Cash-on-Cash Return
2.1%
Cap rate
0.6%
Rent to Value Ratio
Active
$1,275,000
4
bds
|
3
ba
|
2,483
sqft
|
built
1886
3025 N Racine Ave, Chicago, IL 60657
$-3,342
Cash flow
-13.7%
Cash-on-Cash Return
2.5%
Cap rate
0.5%
Rent to Value Ratio
Active
$279,900
1
bds
|
1
ba
|
0
sqft
|
built
1969
450 W Briar Pl, Chicago, IL 60657
$-671
Cash flow
-12.5%
Cash-on-Cash Return
2.8%
Cap rate
0.8%
Rent to Value Ratio
Active
$675,000
2
bds
|
2
ba
|
1,745
sqft
|
built
1928
431 W Oakdale Ave, Chicago, IL 60657
$-2,105
Cash flow
-16.3%
Cash-on-Cash Return
1.9%
Cap rate
0.6%
Rent to Value Ratio
Active
$310,000
1
bds
|
1
ba
|
1,100
sqft
|
built
1929
421 W Melrose St, Chicago, IL 60657
$-1,446
Cash flow
-24.3%
Cash-on-Cash Return
0.1%
Cap rate
0.8%
Rent to Value Ratio
Active
$439,000
2
bds
|
2
ba
|
1,250
sqft
|
built
1966
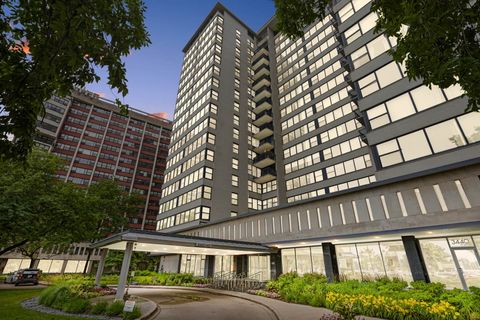
3200 N Lake Shore Dr, Chicago, IL 60657
$-1,357
Cash flow
-16.1%
Cash-on-Cash Return
2.0%
Cap rate
0.8%
Rent to Value Ratio
Active
$779,000
4
bds
|
3
ba
|
3,400
sqft
|
built
1929
421 W Melrose St, Chicago, IL 60657
$-4,805
Cash flow
-32.2%
Cash-on-Cash Return
-1.7%
Cap rate
0.9%
Rent to Value Ratio
Active
$549,000
2
bds
|
2
ba
|
1,350
sqft
|
built
1968
2800 N Lake Shore Dr, Chicago, IL 60657
$-2,081
Cash flow
-19.8%
Cash-on-Cash Return
1.1%
Cap rate
0.7%
Rent to Value Ratio
Active
$610,000
2
bds
|
2
ba
|
0
sqft
|
built
1944
1645 W School St, Chicago, IL 60657
$-2,243
Cash flow
-19.2%
Cash-on-Cash Return
1.3%
Cap rate
0.4%
Rent to Value Ratio
Active
$274,900
1
bds
|
1
ba
|
0
sqft
|
built
1960
2930 N Sheridan Rd, Chicago, IL 60657
$-1,009
Cash flow
-19.2%
Cash-on-Cash Return
1.3%
Cap rate
0.8%
Rent to Value Ratio
Active
$309,900
2
bds
|
2
ba
|
1,250
sqft
|
built
1974
3430 N Lake Shore Dr, Chicago, IL 60657
$-1,286
Cash flow
-21.7%
Cash-on-Cash Return
0.7%
Cap rate
0.9%
Rent to Value Ratio
Active
$650,000
2
bds
|
2
ba
|
1,500
sqft
|
built
2000
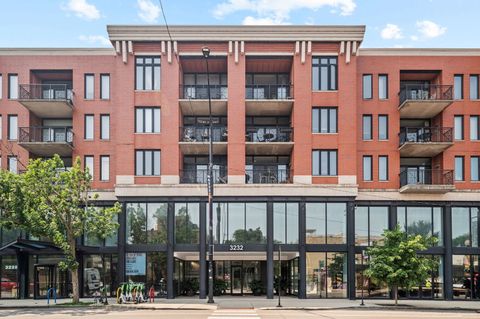
3232 N Halsted St, Chicago, IL 60657
$-2,145
Cash flow
-17.2%
Cash-on-Cash Return
1.7%
Cap rate
0.7%
Rent to Value Ratio
Active
$312,500
2
bds
|
2
ba
|
1,250
sqft
|
built
1962
3550 N Lake Shore Dr, Chicago, IL 60657
$-793
Cash flow
-13.2%
Cash-on-Cash Return
2.6%
Cap rate
1.0%
Rent to Value Ratio
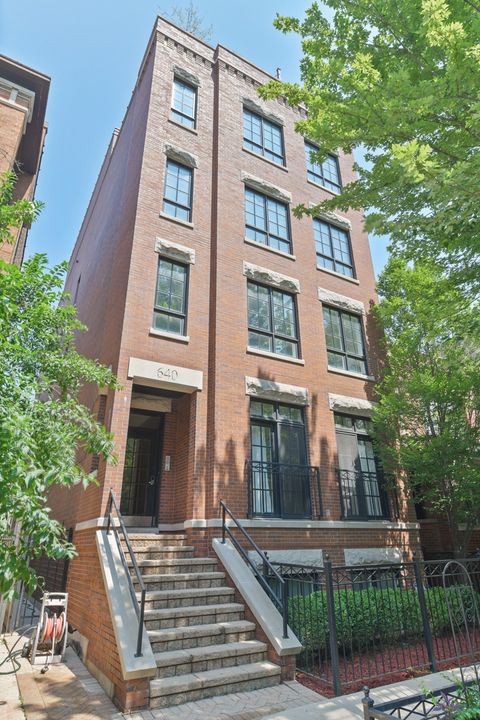
Active
$1,050,000
3
bds
|
2
ba
|
0
sqft
|
built
2006
640 W Aldine Ave, Chicago, IL 60657
$-2,595
Cash flow
-12.9%
Cash-on-Cash Return
2.7%
Cap rate
0.6%
Rent to Value Ratio
Active
$199,990
0
bds
|
1
ba
|
605
sqft
|
built
1962
3550 N Lake Shore Dr, Chicago, IL 60657
$-360
Cash flow
-9.4%
Cash-on-Cash Return
3.5%
Cap rate
0.9%
Rent to Value Ratio
Active
$255,000
1
bds
|
1
ba
|
1,200
sqft
|
built
1924
3520 N Lake Shore Dr, Chicago, IL 60657
$-895
Cash flow
-18.3%
Cash-on-Cash Return
1.5%
Cap rate
1.0%
Rent to Value Ratio
Active
$349,900
2
bds
|
1
ba
|
800
sqft
|
built
1965
336 W Wellington Ave, Chicago, IL 60657
$-1,321
Cash flow
-19.7%
Cash-on-Cash Return
1.1%
Cap rate
0.7%
Rent to Value Ratio
Active
$2,720,000
6
bds
|
5
ba
|
5,400
sqft
|
built
1907
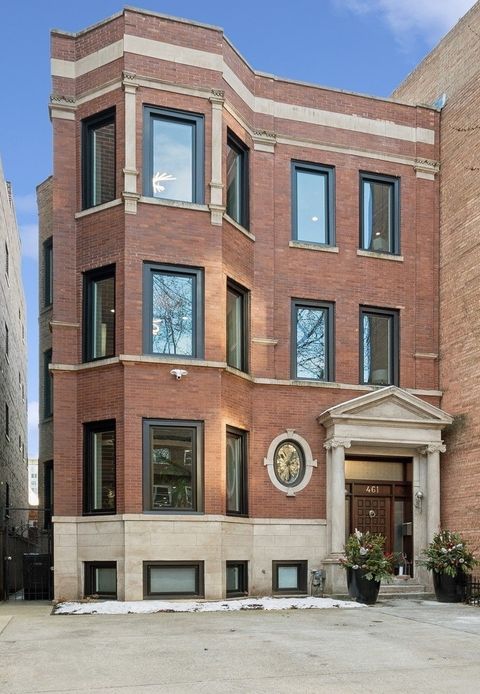
461 W Melrose St, Chicago, IL 60657
$-9,091
Cash flow
-17.4%
Cash-on-Cash Return
1.7%
Cap rate
0.4%
Rent to Value Ratio
Active
$699,900
3
bds
|
3
ba
|
2,400
sqft
|
built
1924
3530 N Lake Shore Dr, Chicago, IL 60657
$-3,152
Cash flow
-23.5%
Cash-on-Cash Return
0.3%
Cap rate
0.7%
Rent to Value Ratio
Active
$210,000
1
bds
|
1
ba
|
0
sqft
|
built
1956
2909 N Sheridan Rd, Chicago, IL 60657
$-491
Cash flow
-12.2%
Cash-on-Cash Return
2.9%
Cap rate
1.0%
Rent to Value Ratio
Active
$400,000
2
bds
|
2
ba
|
1,140
sqft
|
built
1957
330 W Diversey Pkwy, Chicago, IL 60657
$-1,266
Cash flow
-16.5%
Cash-on-Cash Return
1.9%
Cap rate
0.8%
Rent to Value Ratio
Active
$499,990
2
bds
|
2
ba
|
1,400
sqft
|
built
2001
3260 N Clark St, Chicago, IL 60657
$-817
Cash flow
-8.5%
Cash-on-Cash Return
3.7%
Cap rate
0.8%
Rent to Value Ratio
Active
$615,000
2
bds
|
2
ba
|
1,800
sqft
|
built
1925
3100 N Sheridan Rd, Chicago, IL 60657
$-2,534
Cash flow
-21.5%
Cash-on-Cash Return
0.7%
Cap rate
0.6%
Rent to Value Ratio
Active
$380,000
2
bds
|
1
ba
|
0
sqft
|
built
1893
2800 N Pine Grove Ave, Chicago, IL 60657
$-1,031
Cash flow
-14.2%
Cash-on-Cash Return
2.4%
Cap rate
0.6%
Rent to Value Ratio
Active
$889,000
7
bds
|
5
ba
|
0
sqft
|
built
1890
3003 N Ashland Ave, Chicago, IL 60657
$-3,130
Cash flow
-18.4%
Cash-on-Cash Return
1.5%
Cap rate
0.4%
Rent to Value Ratio
Active
$215,000
1
bds
|
1
ba
|
720
sqft
|
built
1961
555 W Cornelia Ave, Chicago, IL 60657
$-502
Cash flow
-12.2%
Cash-on-Cash Return
2.9%
Cap rate
1.0%
Rent to Value Ratio
Active
$625,000
2
bds
|
2
ba
|
1,800
sqft
|
built
1928
431 W Oakdale Ave, Chicago, IL 60657
$-2,039
Cash flow
-17.0%
Cash-on-Cash Return
1.8%
Cap rate
0.6%
Rent to Value Ratio

Active
$380,000
2
bds
|
2
ba
|
1,250
sqft
|
built
1966
3200 N Lake Shore Dr, Chicago, IL 60657
$-1,498
Cash flow
-20.6%
Cash-on-Cash Return
0.9%
Cap rate
0.8%
Rent to Value Ratio
Active
$849,999
3
bds
|
3
ba
|
2,200
sqft
|
built
1963
3150 N Lake Shore Dr, Chicago, IL 60657
$-2,597
Cash flow
-15.9%
Cash-on-Cash Return
2.0%
Cap rate
0.6%
Rent to Value Ratio
Active
$525,000
2
bds
|
2
ba
|
1,200
sqft
|
built
1958
330 W Diversey Pkwy, Chicago, IL 60657
$-2,229
Cash flow
-22.2%
Cash-on-Cash Return
0.6%
Cap rate
0.6%
Rent to Value Ratio