60660 Investment Properties for Sale
Browse homes for sale and investment properties in 60660. Refine your search by price, property type, or more.
Best cash flowing properties in 60660
Active
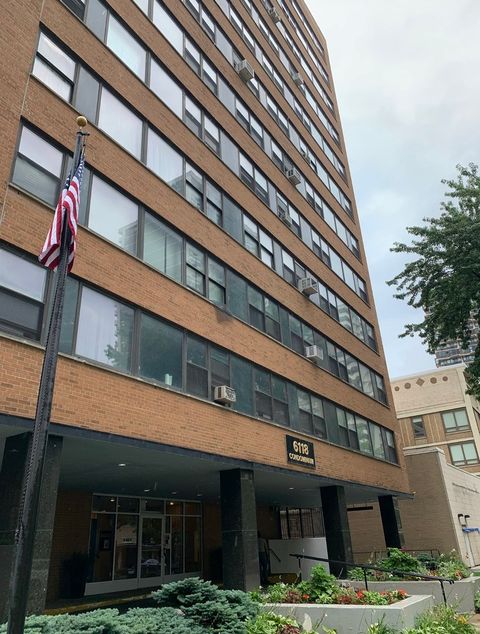
$200,000
2
bds
|
1
ba
|
900
sqft
|
built
1957
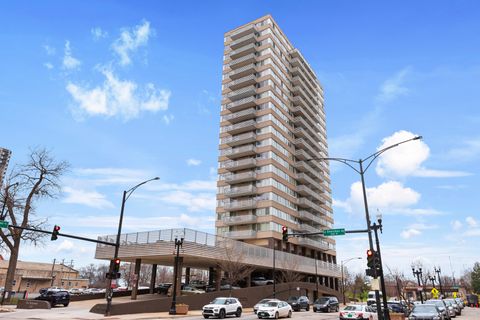
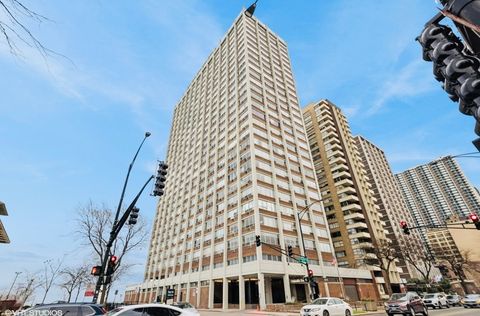
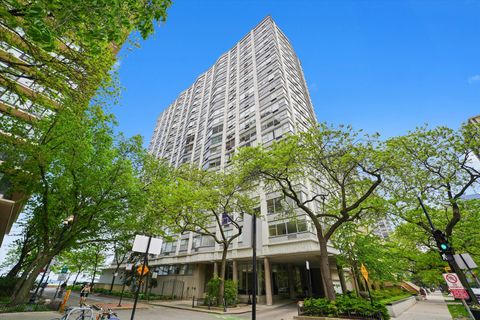
6118 N Sheridan Rd, Chicago, IL 60660
$343
Cash flow
8.9%
Cash-on-Cash Return
7.7%
Cap rate
1.1%
Rent to Value Ratio
Active
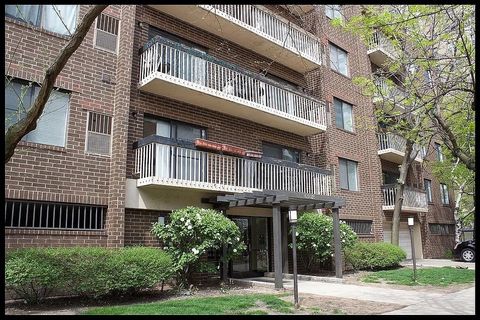
$199,900
1
bds
|
1
ba
|
750
sqft
|
built
1988
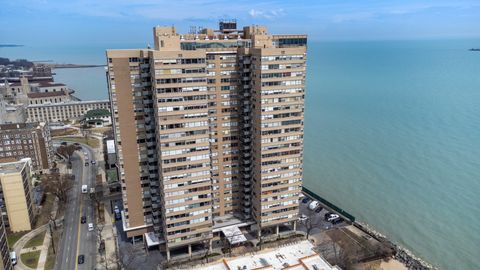
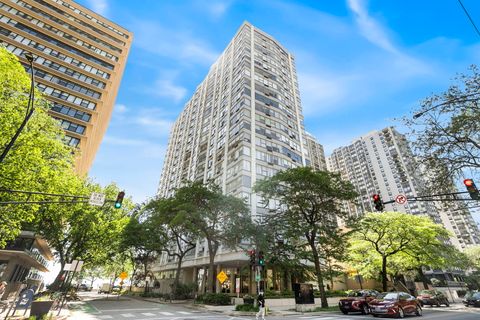
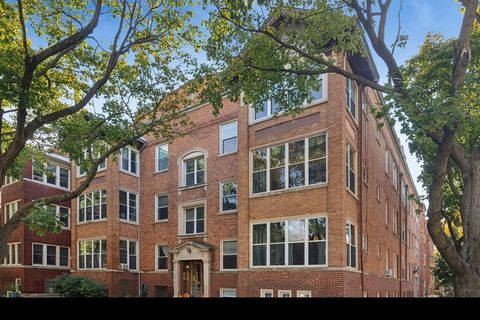
6102 N Sheridan Rd, Chicago, IL 60660
$143
Cash flow
3.7%
Cash-on-Cash Return
6.5%
Cap rate
1.0%
Rent to Value Ratio
35 out of 39 properties for sale in 60660
Limited Results Shown
Create a free account, or log in to reveal all property listings and enjoy the complete experience.
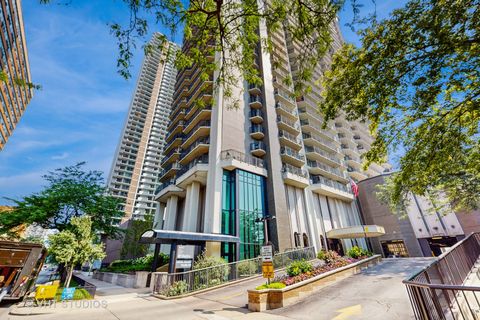
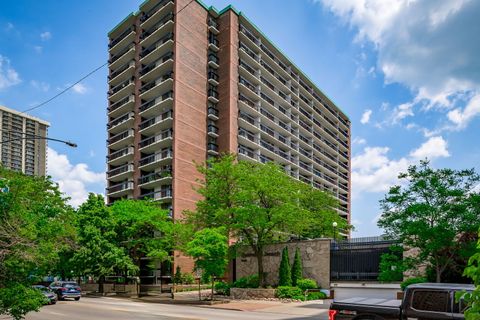
Active
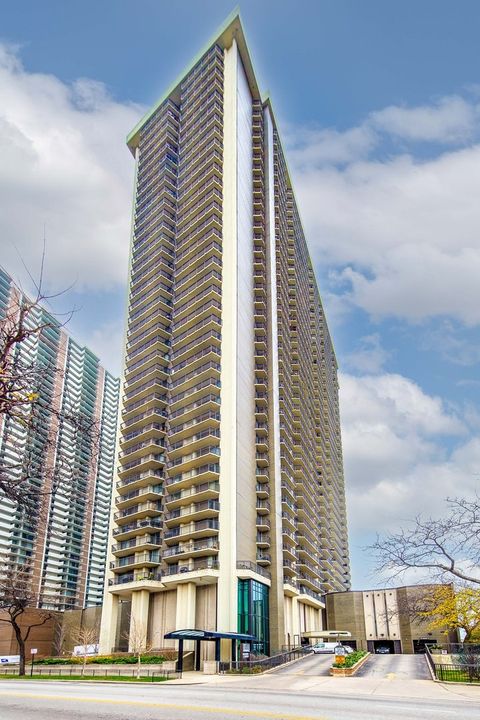
$389,000
2
bds
|
2
ba
|
1,480
sqft
|
built
1967
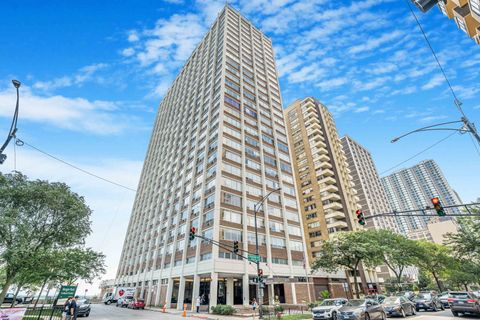
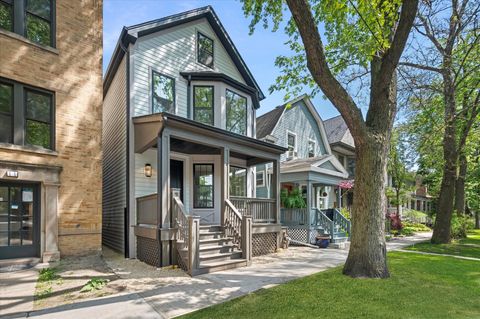
6007 N Sheridan Rd, Chicago, IL 60660
$-824
Cash flow
-11.1%
Cash-on-Cash Return
3.1%
Cap rate
0.8%
Rent to Value Ratio
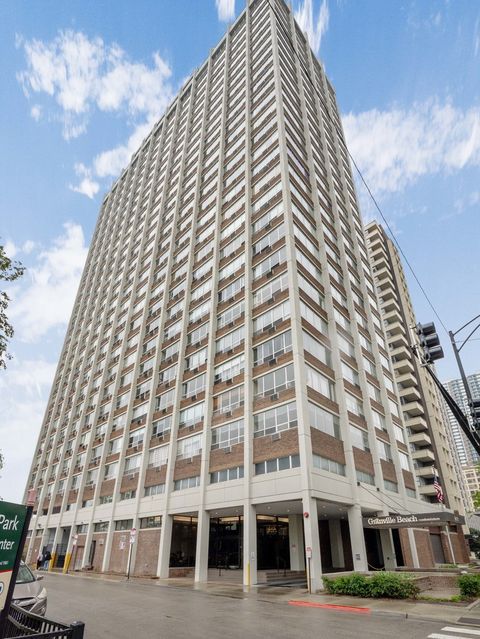
Active
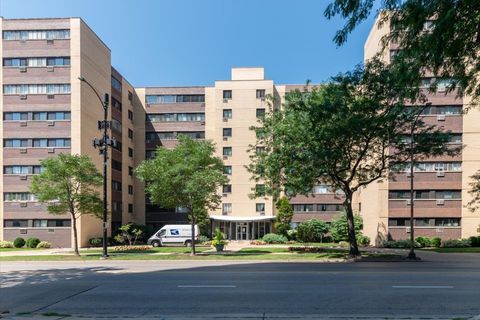
$183,900
1
bds
|
1
ba
|
750
sqft
|
built
1964
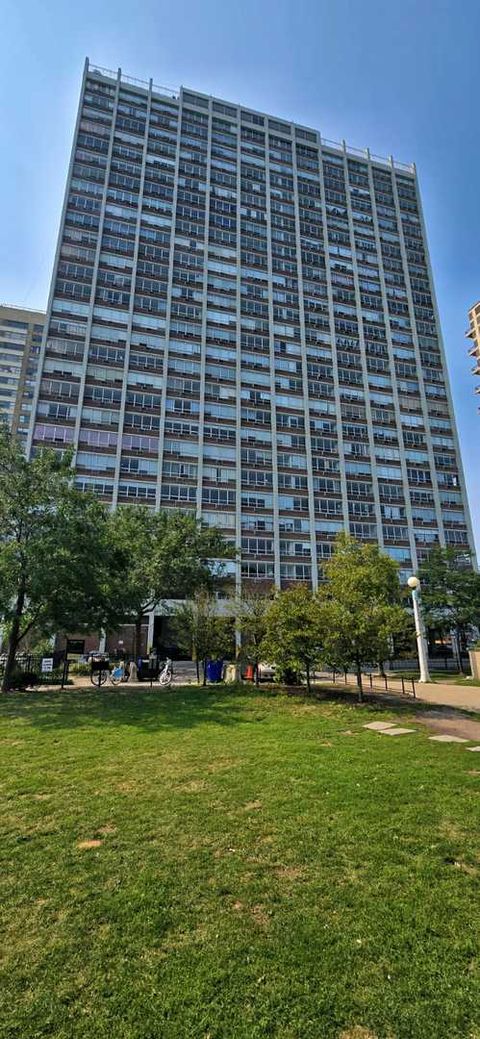
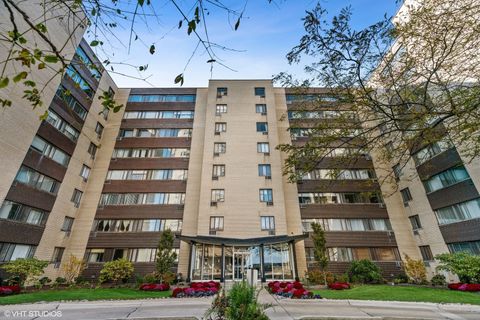
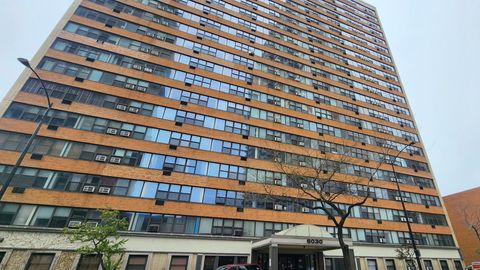
6300 N Sheridan Rd, Chicago, IL 60660
$-354
Cash flow
-10.0%
Cash-on-Cash Return
3.4%
Cap rate
1.0%
Rent to Value Ratio
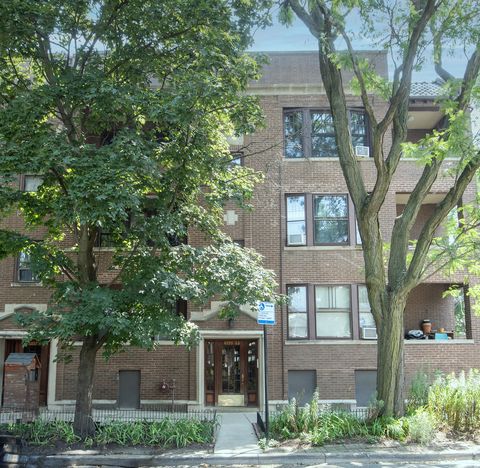
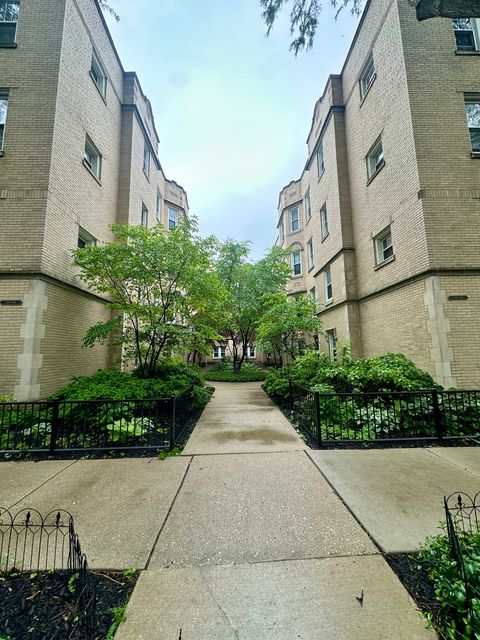
Active
$149,900
1
bds
|
1
ba
|
950
sqft
|
built
1925
1939 W Granville Ave, Chicago, IL 60660
$-128
Cash flow
-4.5%
Cash-on-Cash Return
4.7%
Cap rate
1.1%
Rent to Value Ratio
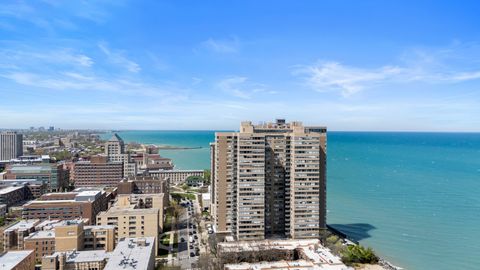
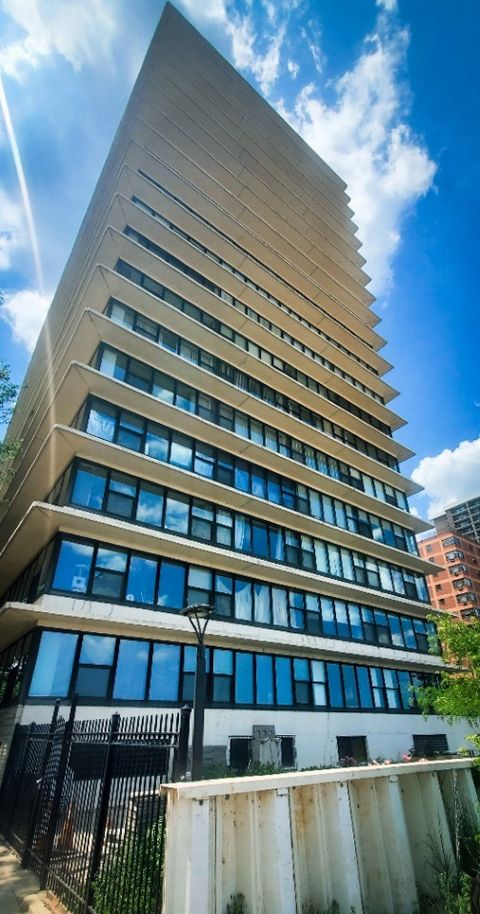
Active
$279,000
1
bds
|
1
ba
|
1,000
sqft
|
built
1971
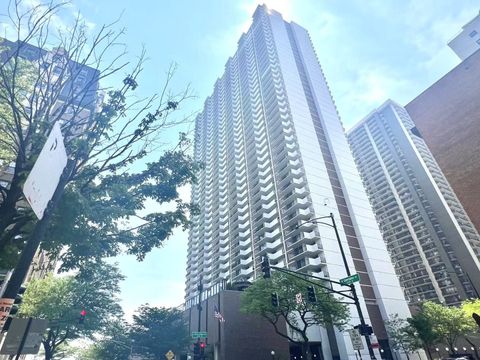
6007 N Sheridan Rd, Chicago, IL 60660
$-900
Cash flow
-16.8%
Cash-on-Cash Return
1.8%
Cap rate
0.7%
Rent to Value Ratio
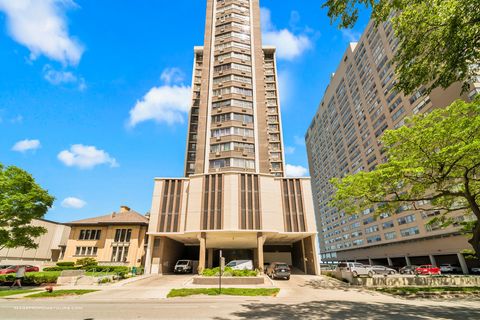
Active
$385,000
2
bds
|
2
ba
|
1,810
sqft
|
built
1913
1626 W Highland Ave, Chicago, IL 60660
$-621
Cash flow
-8.4%
Cash-on-Cash Return
3.7%
Cap rate
0.7%
Rent to Value Ratio
Active
$399,000
3
bds
|
2
ba
|
1,975
sqft
|
built
1970
6145 N Sheridan Rd, Chicago, IL 60660
$-1,328
Cash flow
-17.4%
Cash-on-Cash Return
1.7%
Cap rate
0.8%
Rent to Value Ratio

Active
$139,900
1
bds
|
1
ba
|
750
sqft
|
built
1968
5757 N Sheridan Rd, Chicago, IL 60660
$-352
Cash flow
-13.1%
Cash-on-Cash Return
2.7%
Cap rate
1.4%
Rent to Value Ratio
Active
$259,000
2
bds
|
2
ba
|
0
sqft
|
built
1966
5601 N Sheridan Rd, Chicago, IL 60660
$-803
Cash flow
-16.2%
Cash-on-Cash Return
2.0%
Cap rate
1.1%
Rent to Value Ratio
Active
$179,000
1
bds
|
1
ba
|
800
sqft
|
built
1960
6301 N Sheridan Rd, Chicago, IL 60660
$-477
Cash flow
-13.9%
Cash-on-Cash Return
2.5%
Cap rate
1.1%
Rent to Value Ratio
Active
$160,000
1
bds
|
1
ba
|
800
sqft
|
built
1970
6171 N Sheridan Rd, Chicago, IL 60660
$-97
Cash flow
-3.2%
Cash-on-Cash Return
5.0%
Cap rate
1.4%
Rent to Value Ratio
Active
$119,900
bds
|
1
ba
|
500
sqft
|
built
1932
6171 N Sheridan Rd, Chicago, IL 60660
$106
Cash flow
4.6%
Cash-on-Cash Return
6.7%
Cap rate
1.5%
Rent to Value Ratio
Active
$325,000
2
bds
|
2
ba
|
1,433
sqft
|
built
1969
6007 N Sheridan Rd, Chicago, IL 60660
$-840
Cash flow
-13.5%
Cash-on-Cash Return
2.6%
Cap rate
0.9%
Rent to Value Ratio

Active
$200,000
1
bds
|
1
ba
|
0
sqft
|
built
1921
1531 W Rosemont Ave, Chicago, IL 60660
$-334
Cash flow
-8.7%
Cash-on-Cash Return
3.7%
Cap rate
0.8%
Rent to Value Ratio
Active
$255,000
2
bds
|
1
ba
|
850
sqft
|
built
1911
6255 N Greenview Ave, Chicago, IL 60660
$-471
Cash flow
-9.6%
Cash-on-Cash Return
3.5%
Cap rate
0.9%
Rent to Value Ratio
Active
$249,900
3
bds
|
2
ba
|
0
sqft
|
built
1970
6301 N Sheridan Rd, Chicago, IL 60660
$-1,262
Cash flow
-26.3%
Cash-on-Cash Return
-0.4%
Cap rate
1.0%
Rent to Value Ratio
Active
$229,000
2
bds
|
2
ba
|
1,200
sqft
|
built
1970
6325 N Sheridan Rd, Chicago, IL 60660
$-618
Cash flow
-14.1%
Cash-on-Cash Return
2.4%
Cap rate
1.1%
Rent to Value Ratio
Active
$455,000
3
bds
|
2
ba
|
0
sqft
|
built
1971
6007 N Sheridan Rd, Chicago, IL 60660
$-1,465
Cash flow
-16.8%
Cash-on-Cash Return
1.8%
Cap rate
0.7%
Rent to Value Ratio
Active
$174,900
1
bds
|
1
ba
|
700
sqft
|
built
1964
6300 N Sheridan Rd, Chicago, IL 60660
$-521
Cash flow
-15.5%
Cash-on-Cash Return
2.1%
Cap rate
0.8%
Rent to Value Ratio
Active
$675,000
5
bds
|
3
ba
|
2,600
sqft
|
built
1917
5863 N Kenmore Ave, Chicago, IL 60660
$-2,563
Cash flow
-19.8%
Cash-on-Cash Return
1.1%
Cap rate
0.3%
Rent to Value Ratio
Active
$195,000
2
bds
|
2
ba
|
1,200
sqft
|
built
1961
5740 N Sheridan Rd, Chicago, IL 60660
$-705
Cash flow
-18.9%
Cash-on-Cash Return
1.3%
Cap rate
1.0%
Rent to Value Ratio
Active
$170,000
1
bds
|
1
ba
|
800
sqft
|
built
1932
6171 N Sheridan Rd, Chicago, IL 60660
$-382
Cash flow
-11.7%
Cash-on-Cash Return
3.0%
Cap rate
1.2%
Rent to Value Ratio
Active
$230,000
2
bds
|
2
ba
|
0
sqft
|
built
1968
5757 N Sheridan Rd, Chicago, IL 60660
$-1,174
Cash flow
-26.6%
Cash-on-Cash Return
-0.4%
Cap rate
0.9%
Rent to Value Ratio

Active
$119,900
1
bds
|
1
ba
|
0
sqft
|
built
1962
6300 N Sheridan Rd, Chicago, IL 60660
$-172
Cash flow
-7.5%
Cash-on-Cash Return
4.0%
Cap rate
1.1%
Rent to Value Ratio
Active
$99,000
0
bds
|
1
ba
|
612
sqft
|
built
1960
6300 N Sheridan Rd, Chicago, IL 60660
$-212
Cash flow
-11.2%
Cash-on-Cash Return
3.1%
Cap rate
1.1%
Rent to Value Ratio
Active
$315,000
2
bds
|
2
ba
|
1,519
sqft
|
built
1974
6033 N Sheridan Rd, Chicago, IL 60660
$-880
Cash flow
-14.6%
Cash-on-Cash Return
2.3%
Cap rate
0.9%
Rent to Value Ratio
Active
$229,900
1
bds
|
1
ba
|
1,000
sqft
|
built
1968
5901 N Sheridan Rd, Chicago, IL 60660
$-816
Cash flow
-18.5%
Cash-on-Cash Return
1.4%
Cap rate
0.9%
Rent to Value Ratio
Active
$153,000
1
bds
|
1
ba
|
850
sqft
|
built
1932
6171 N Sheridan Rd, Chicago, IL 60660
$-277
Cash flow
-9.4%
Cash-on-Cash Return
3.5%
Cap rate
1.3%
Rent to Value Ratio
Active
$395,000
3
bds
|
2
ba
|
1,700
sqft
|
built
1958
5801 N Sheridan Rd, Chicago, IL 60660
$-1,711
Cash flow
-22.6%
Cash-on-Cash Return
0.5%
Cap rate
0.6%
Rent to Value Ratio
Active
$204,900
2
bds
|
1
ba
|
950
sqft
|
built
1926
1453 W Elmdale Ave, Chicago, IL 60660
$-349
Cash flow
-8.9%
Cash-on-Cash Return
3.6%
Cap rate
0.9%
Rent to Value Ratio
Active
$224,995
2
bds
|
2
ba
|
1,250
sqft
|
built
1968
5757 N Sheridan Rd, Chicago, IL 60660
$-818
Cash flow
-19.0%
Cash-on-Cash Return
1.3%
Cap rate
1.1%
Rent to Value Ratio
Active
$300,000
2
bds
|
1
ba
|
1,000
sqft
|
built
1915
1359 W Elmdale Ave, Chicago, IL 60660
$-723
Cash flow
-12.6%
Cash-on-Cash Return
2.8%
Cap rate
0.6%
Rent to Value Ratio
Active
$1,190,000
5
bds
|
4
ba
|
3,392
sqft
|
built
1903
1542 W Highland Ave, Chicago, IL 60660
$-4,990
Cash flow
-21.9%
Cash-on-Cash Return
0.6%
Cap rate
0.2%
Rent to Value Ratio
Active
$138,000
1
bds
|
1
ba
|
750
sqft
|
built
1951
6030 N Sheridan Rd, Chicago, IL 60660
$-67
Cash flow
-2.5%
Cash-on-Cash Return
5.1%
Cap rate
1.3%
Rent to Value Ratio