60660 Investment Properties for Sale
Browse homes for sale and investment properties in 60660. Refine your search by price, property type, or more.
Best cash flowing properties in 60660
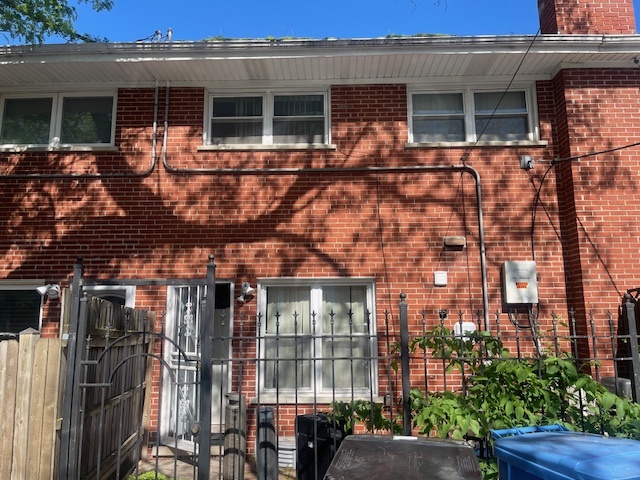
Active under contract
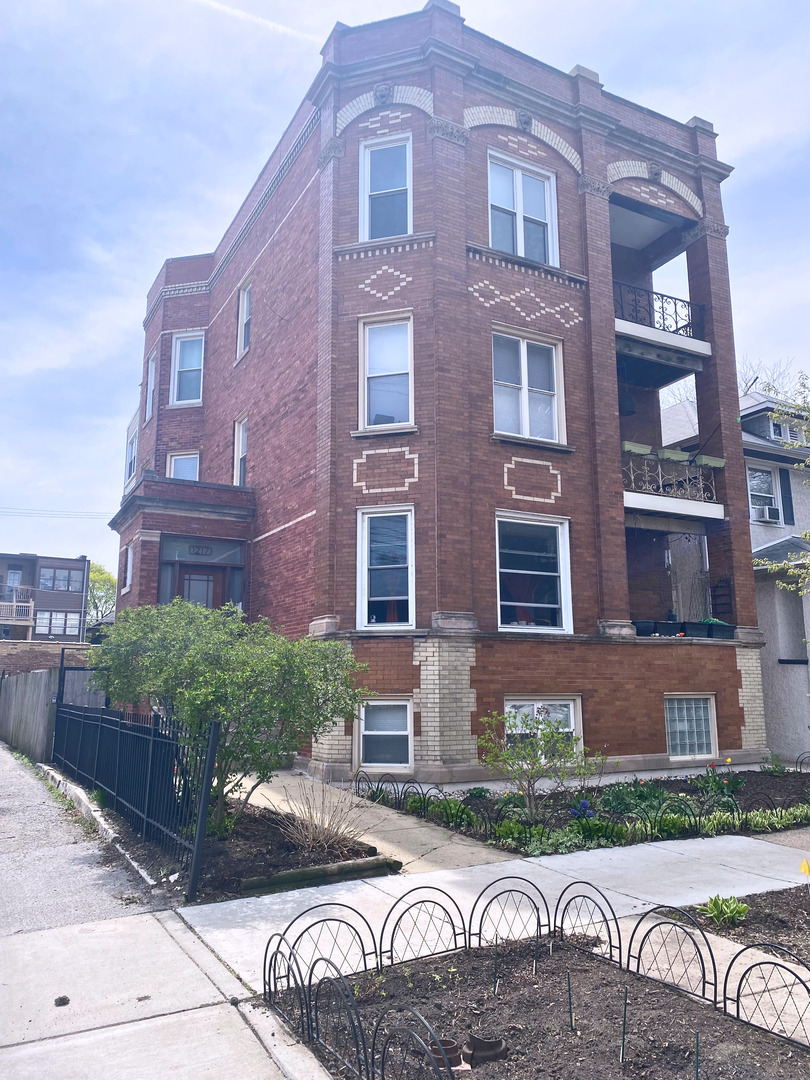
$310,000
3
bds
|
3
ba
|
1,200
sqft
|
built
1964
1713 W Thome Ave, Chicago, IL 60660
$147
Cash flow
2.5%
Cash-on-Cash Return
6.2%
Cap rate
0.9%
Rent to Value Ratio
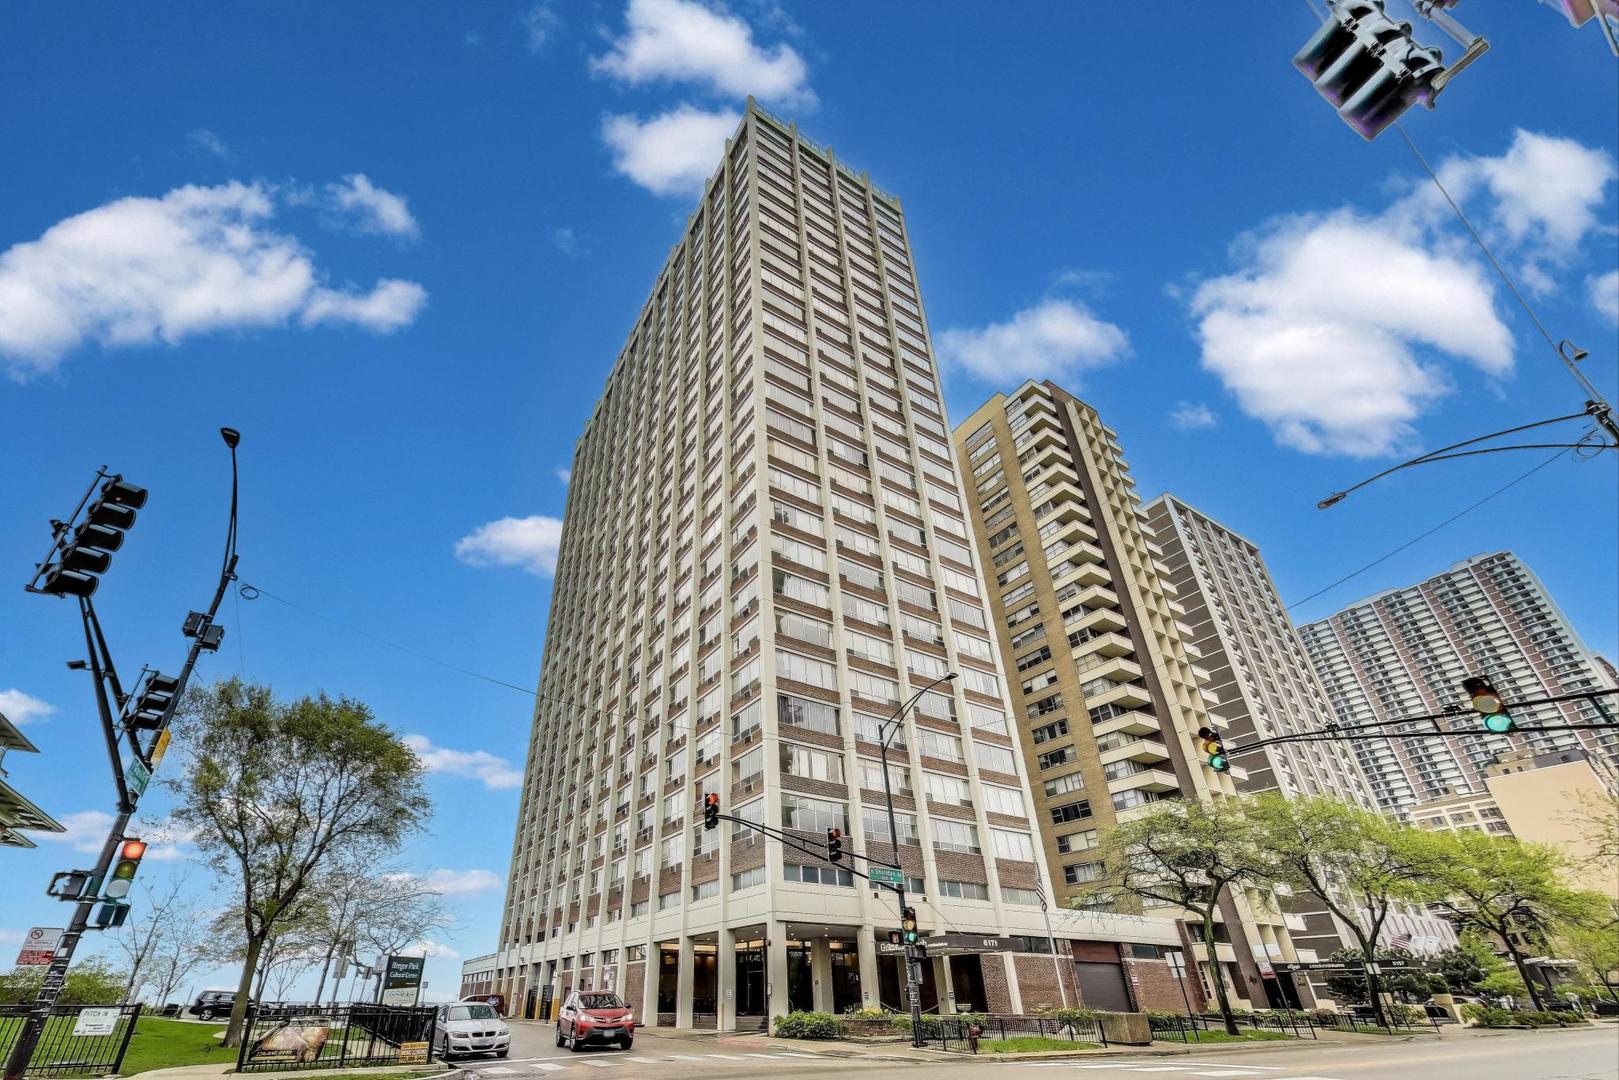
Active
$144,900
bds
|
1
ba
|
470
sqft
|
built
1970
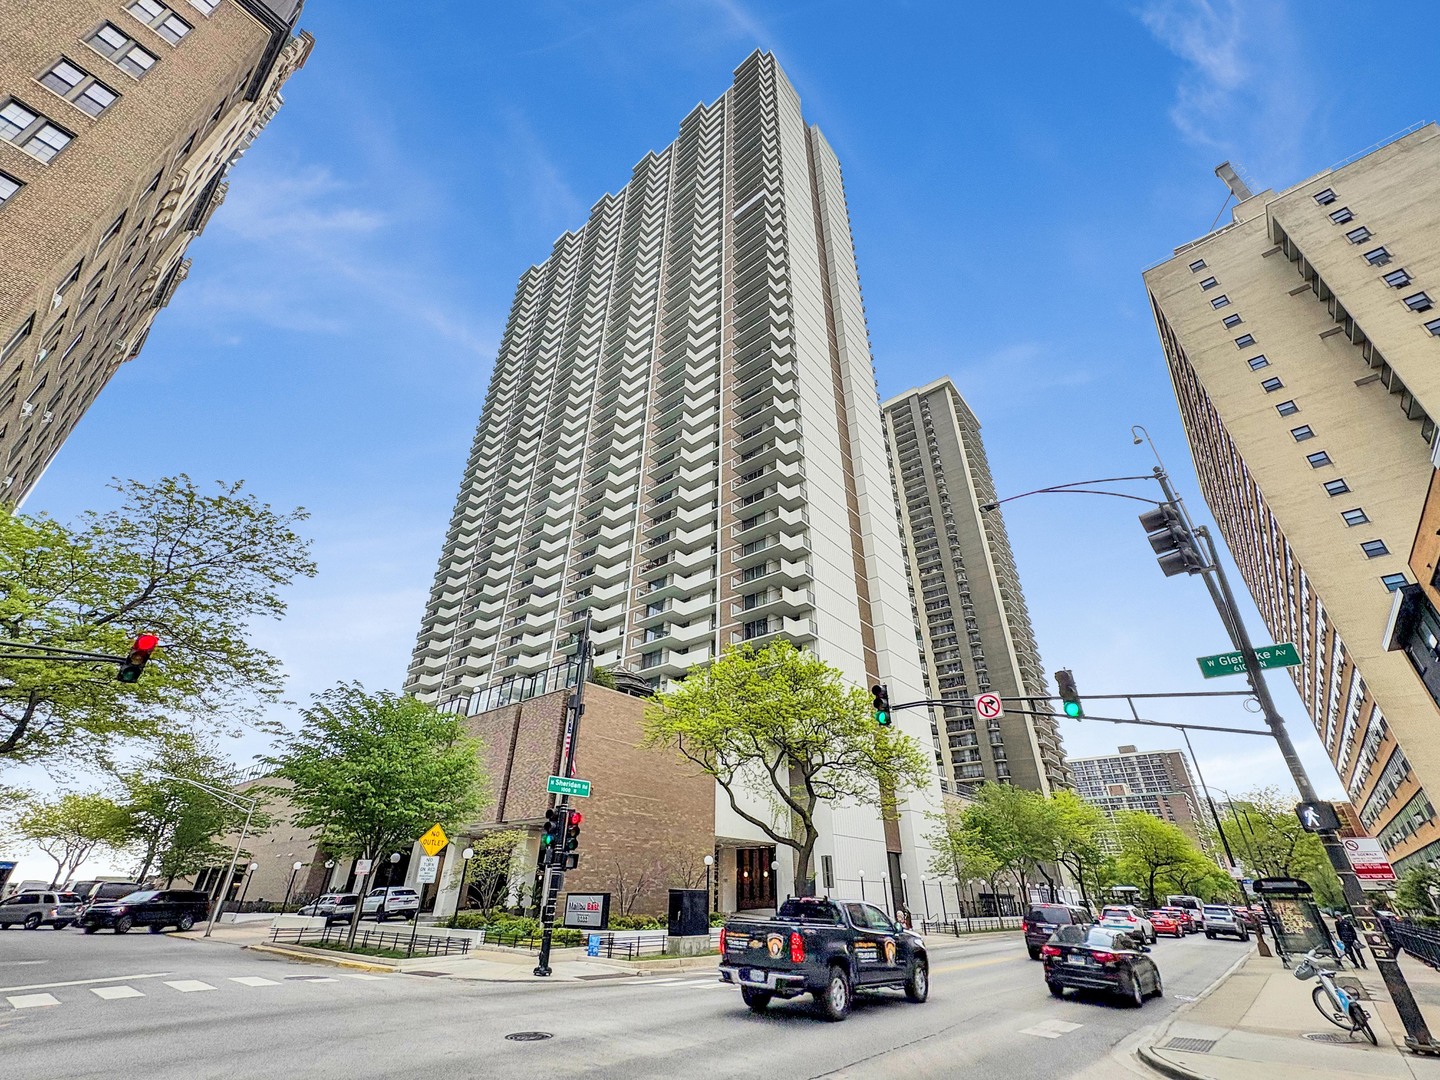
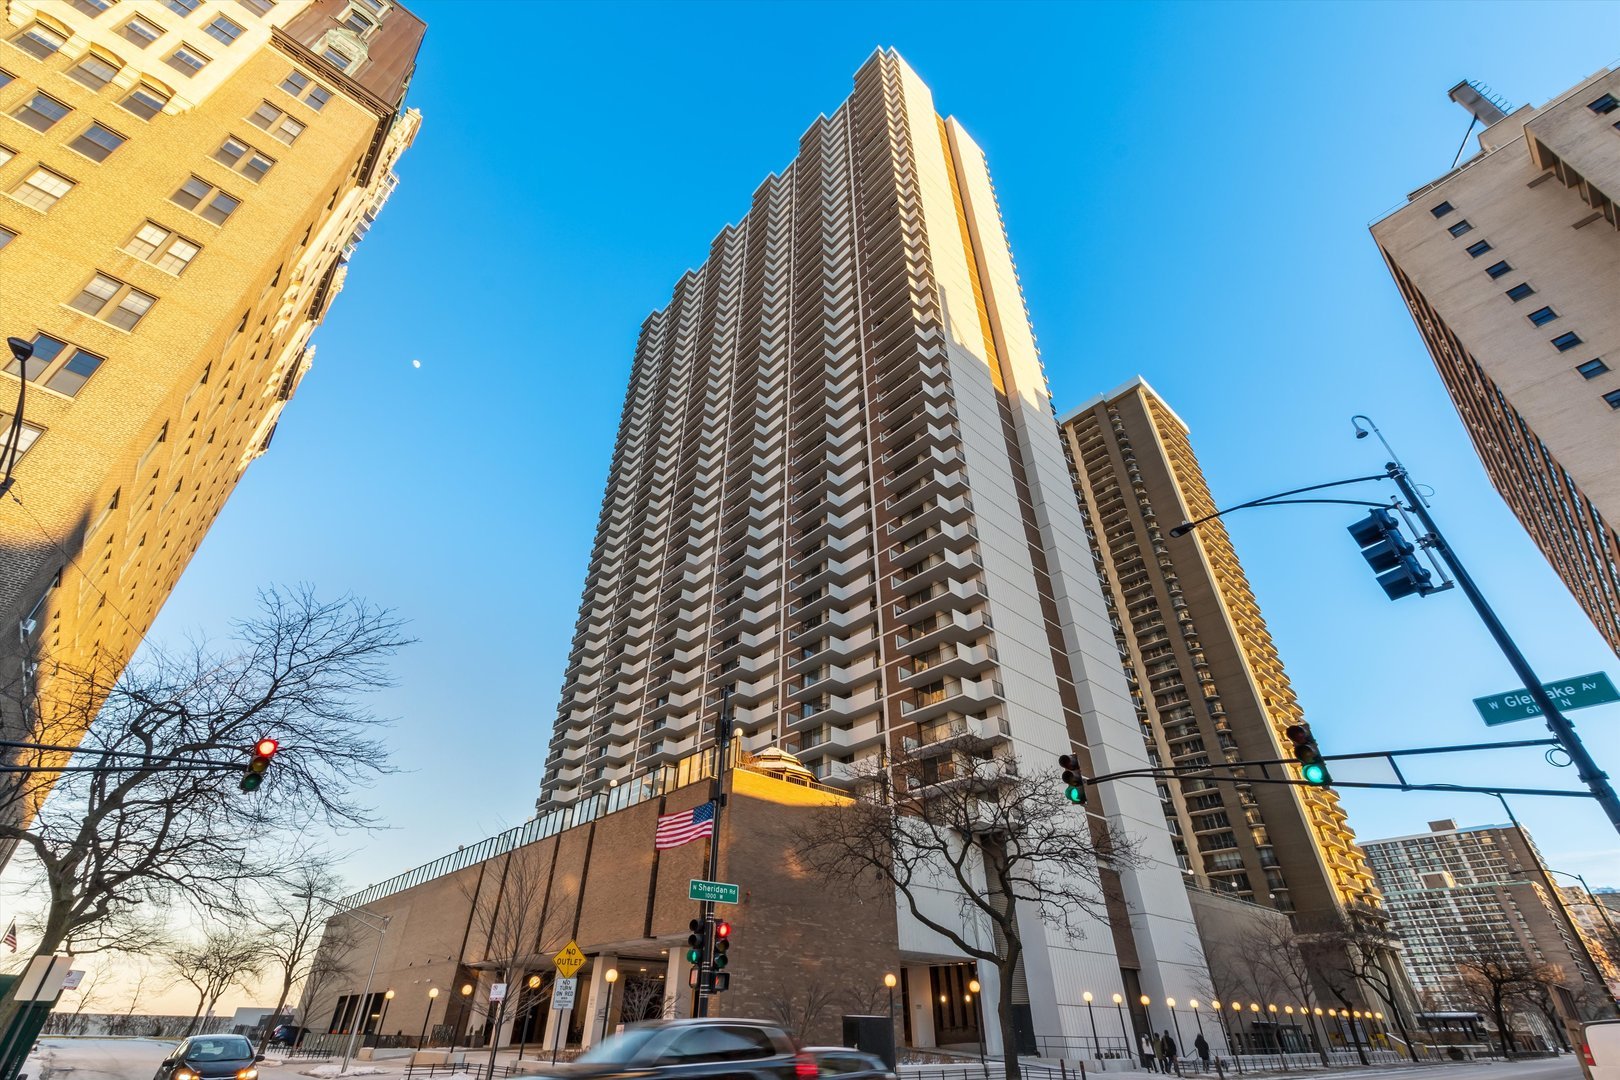
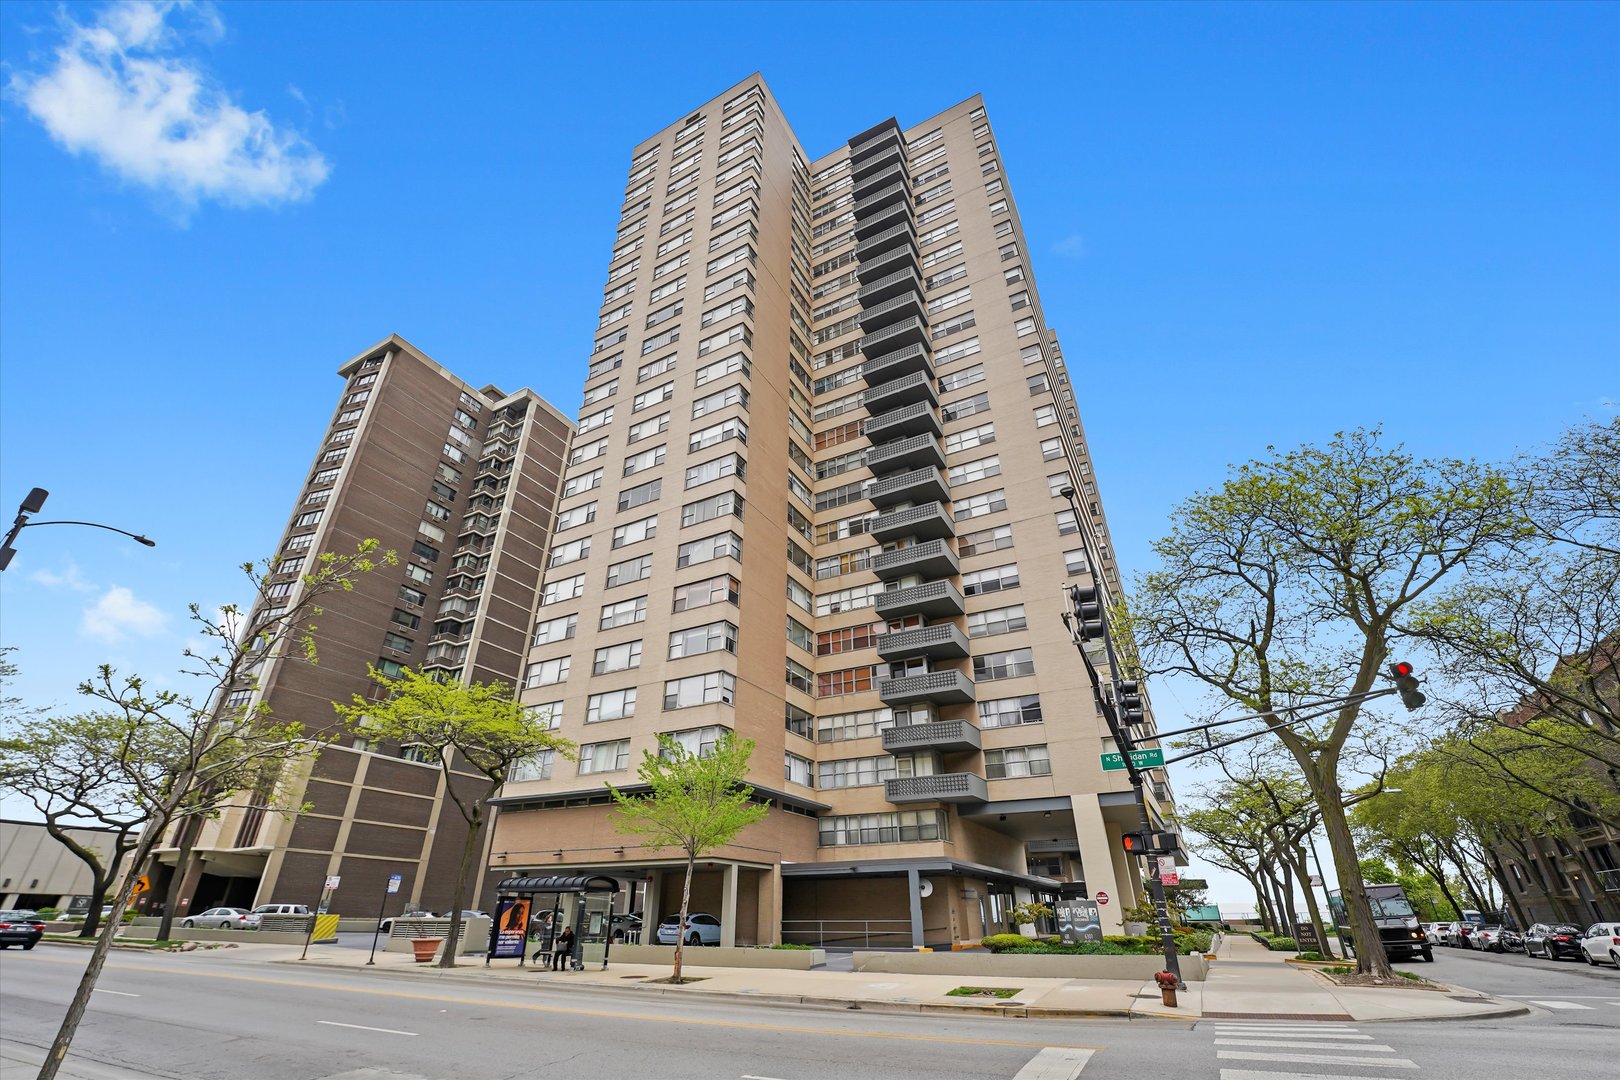
6171 N Sheridan Rd, Chicago, IL 60660
$131
Cash flow
4.7%
Cash-on-Cash Return
6.8%
Cap rate
1.4%
Rent to Value Ratio
60 out of 65 properties for sale in 60660
Limited Results Shown
Create a free account, or log in to reveal all property listings and enjoy the complete experience.
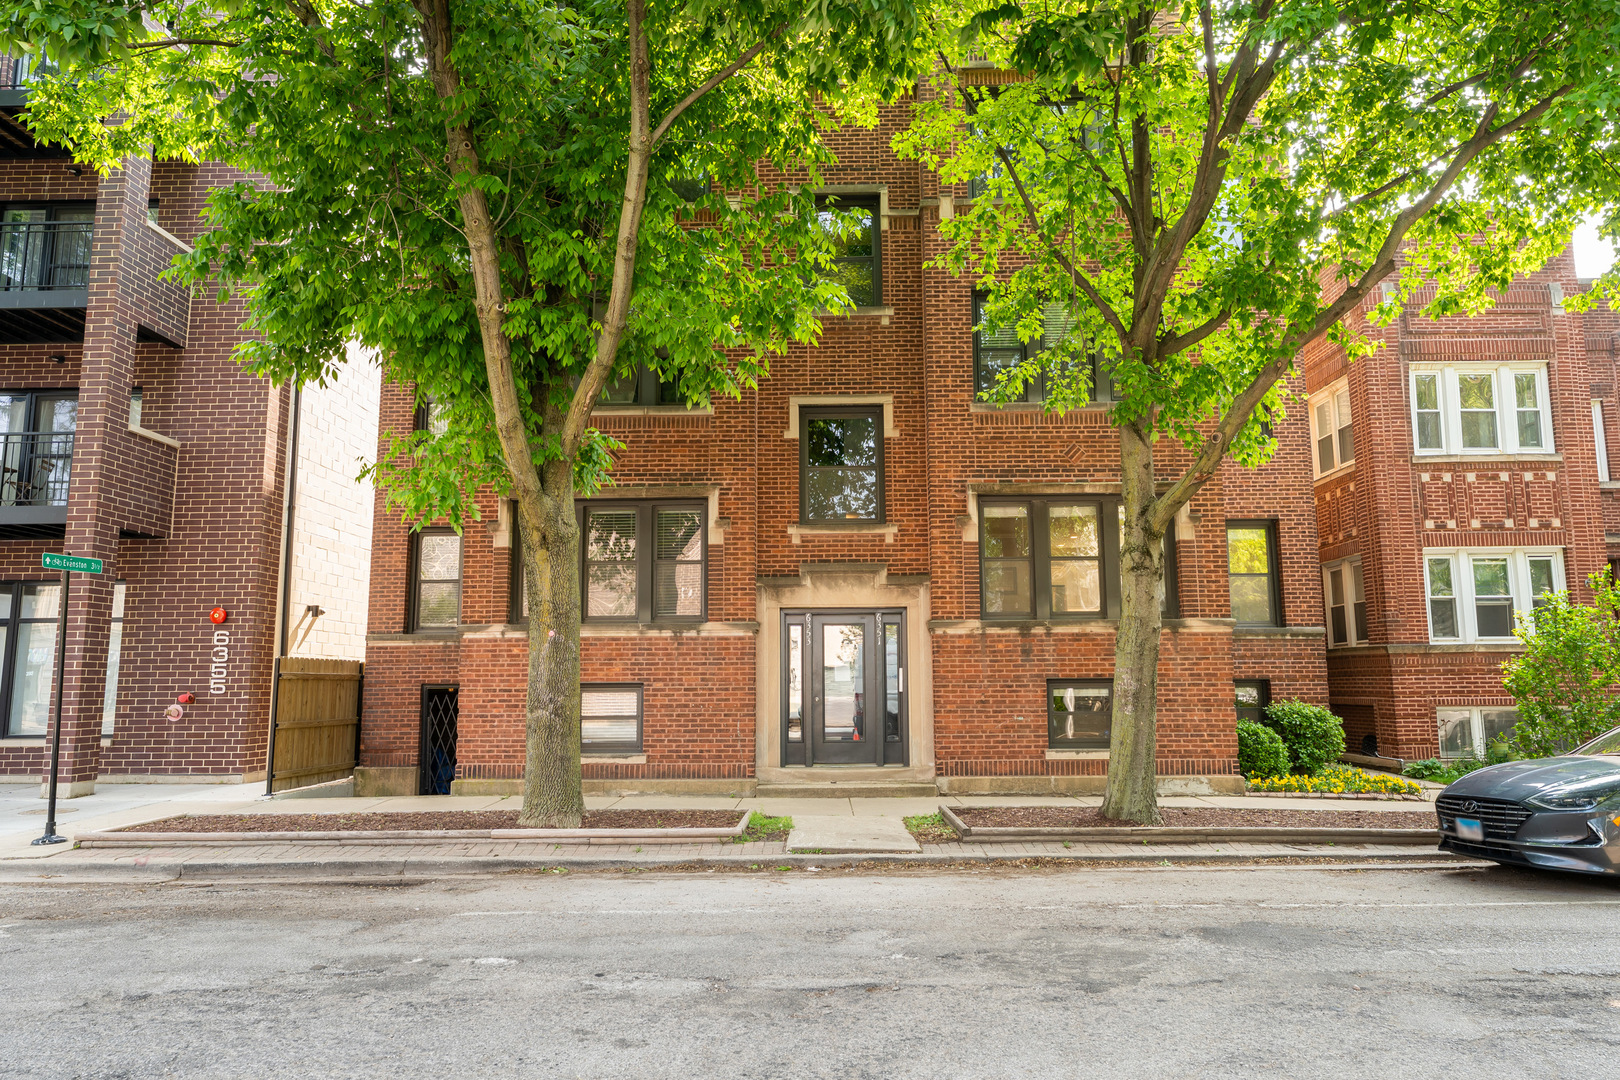
Active
$548,000
3
bds
|
3
ba
|
2,000
sqft
|
built
1918
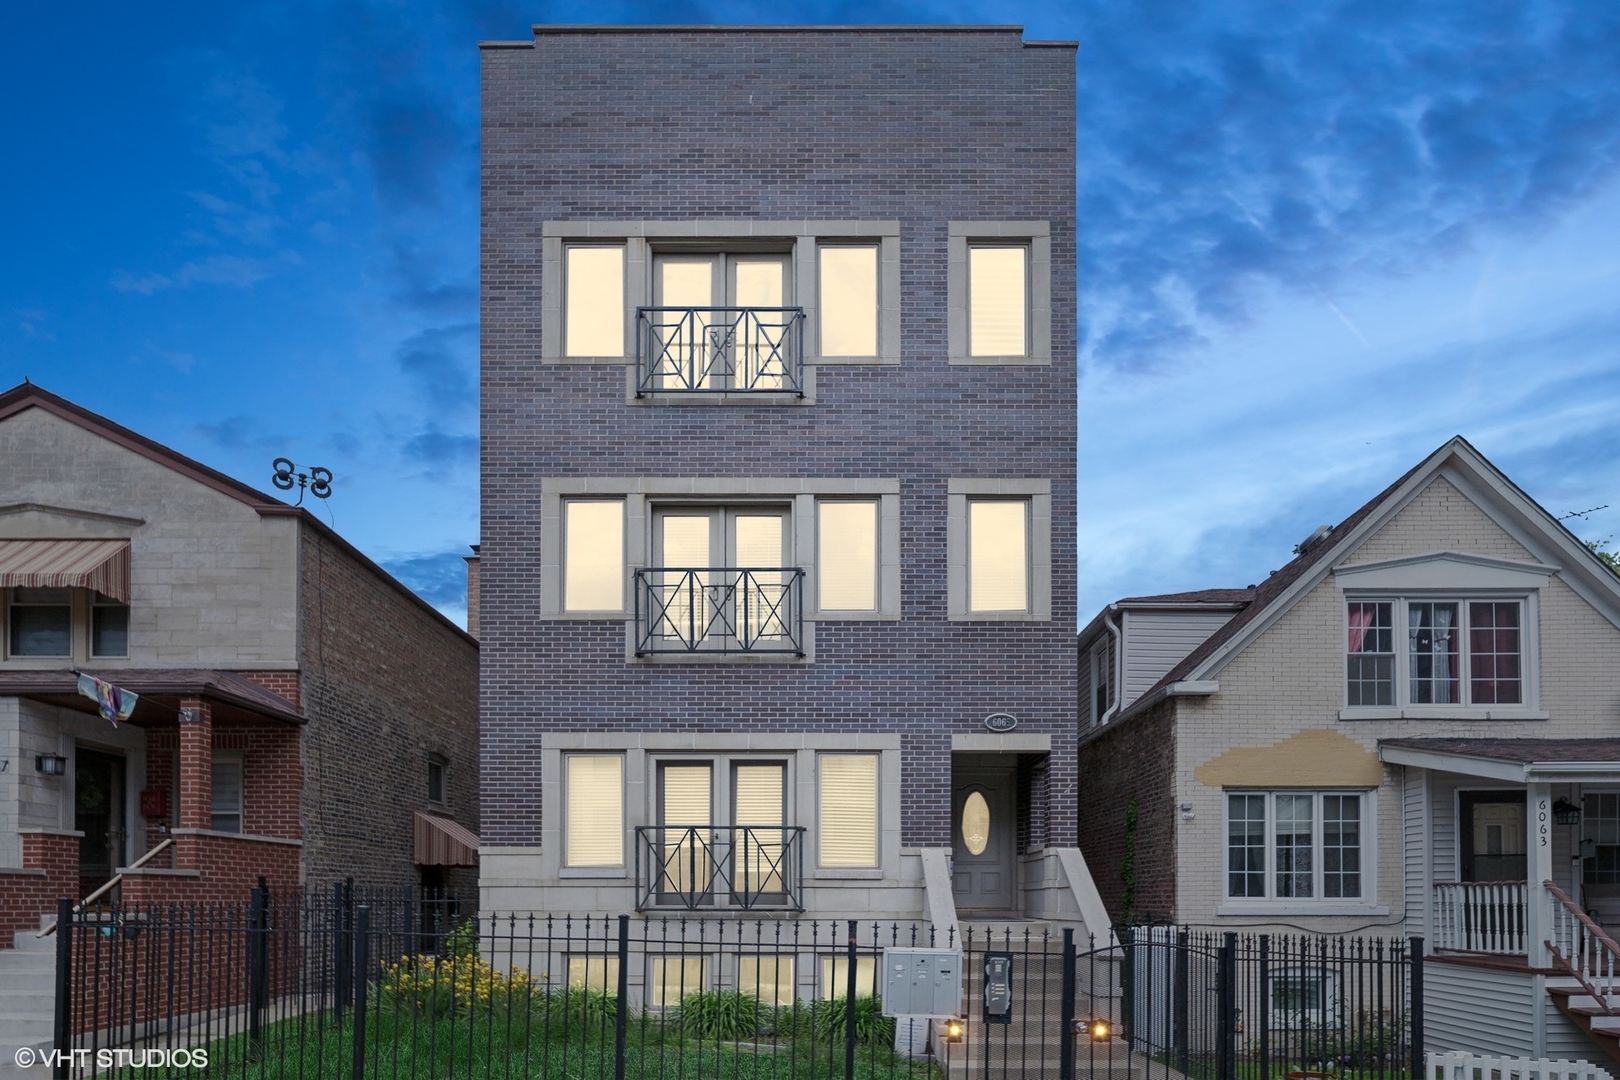
6351 N Glenwood Ave, Chicago, IL 60660
$-1,329
Cash flow
-12.7%
Cash-on-Cash Return
2.8%
Cap rate
0.6%
Rent to Value Ratio
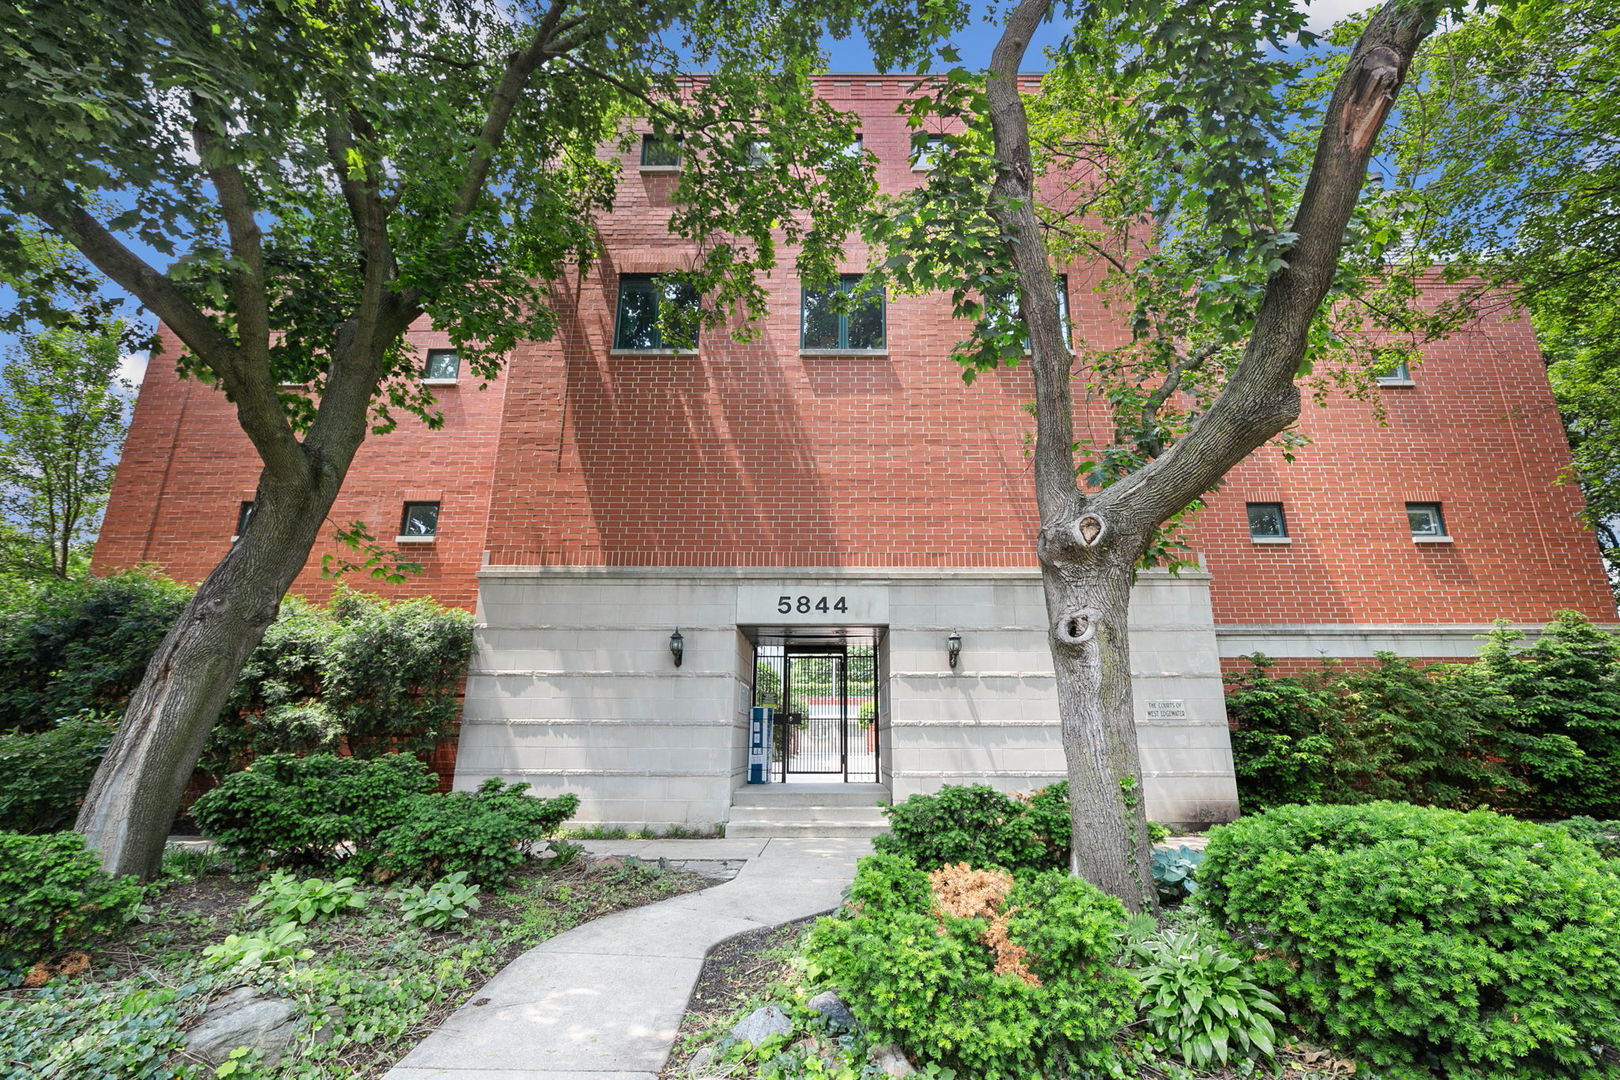
Active
$635,000
3
bds
|
2
ba
|
2,100
sqft
|
built
1998
5844 N Hermitage Ave, Chicago, IL 60660
$-1,622
Cash flow
-13.3%
Cash-on-Cash Return
2.6%
Cap rate
0.6%
Rent to Value Ratio
Active
$299,900
2
bds
|
2
ba
|
1,200
sqft
|
built
1917
1217 W Hood Ave, Chicago, IL 60660
$-199
Cash flow
-3.5%
Cash-on-Cash Return
4.9%
Cap rate
0.8%
Rent to Value Ratio
Active
$350,000
2
bds
|
2
ba
|
1,150
sqft
|
built
2009
1134 W Granville Ave, Chicago, IL 60660
$-964
Cash flow
-14.4%
Cash-on-Cash Return
2.4%
Cap rate
0.7%
Rent to Value Ratio
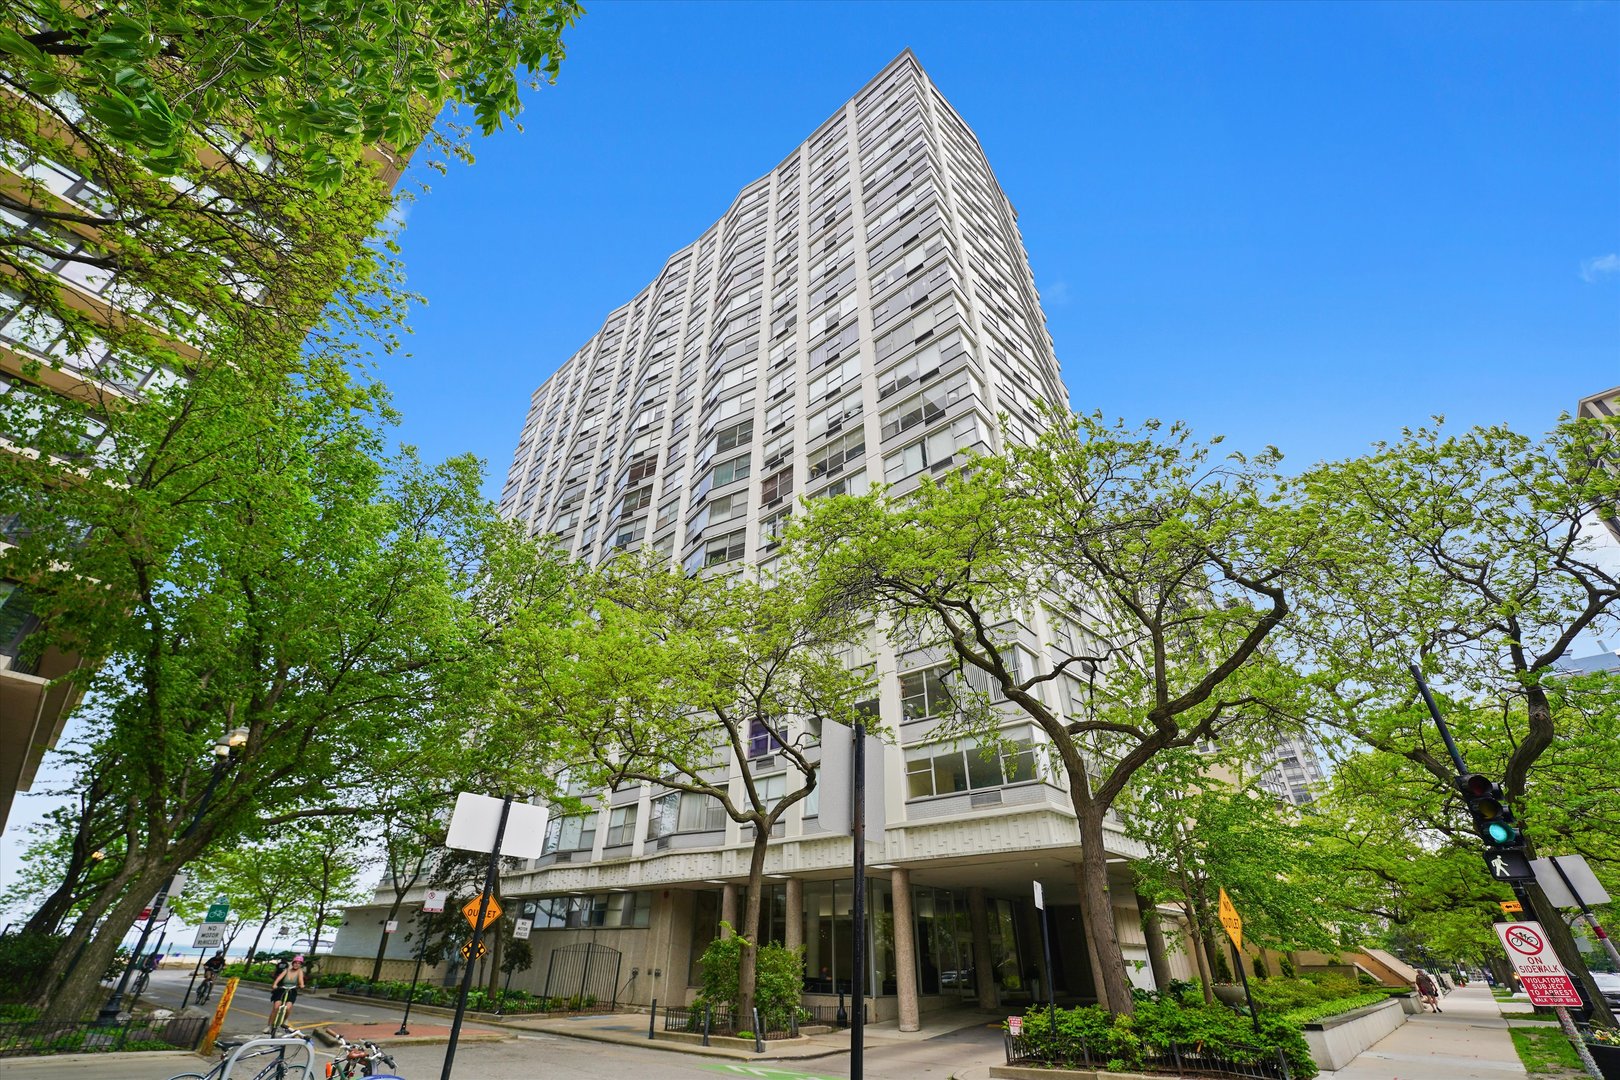
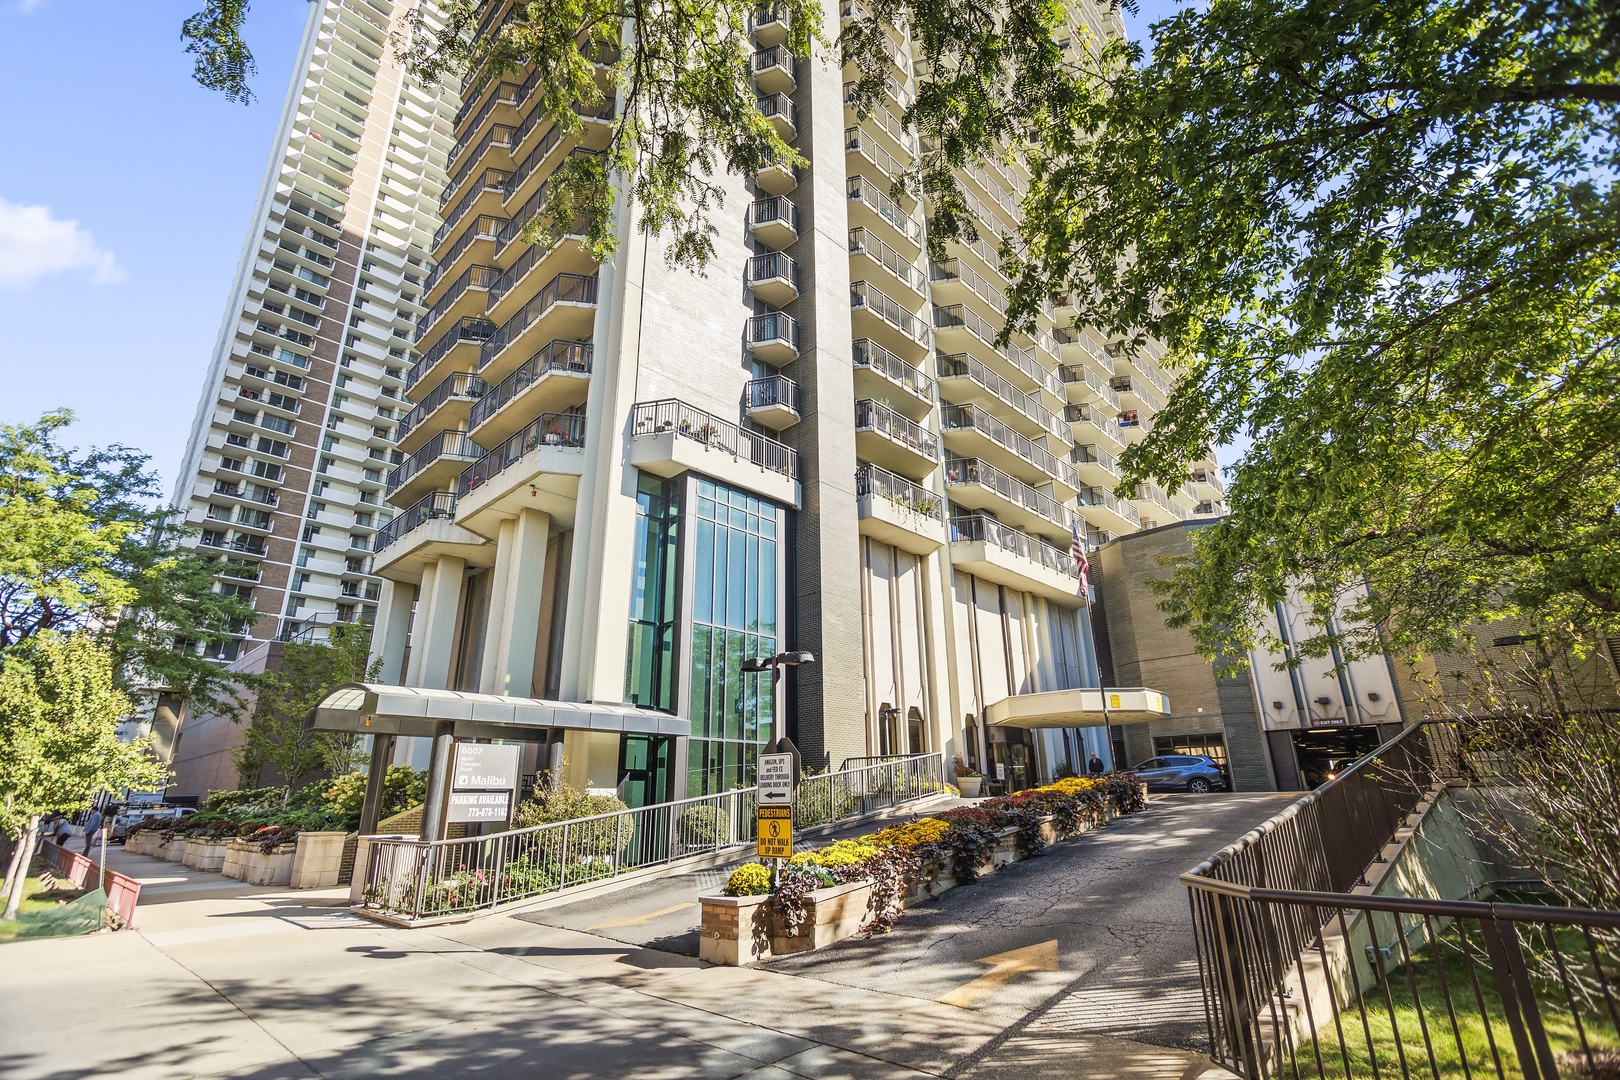
Active
$237,000
1
bds
|
1
ba
|
1,001
sqft
|
built
1969
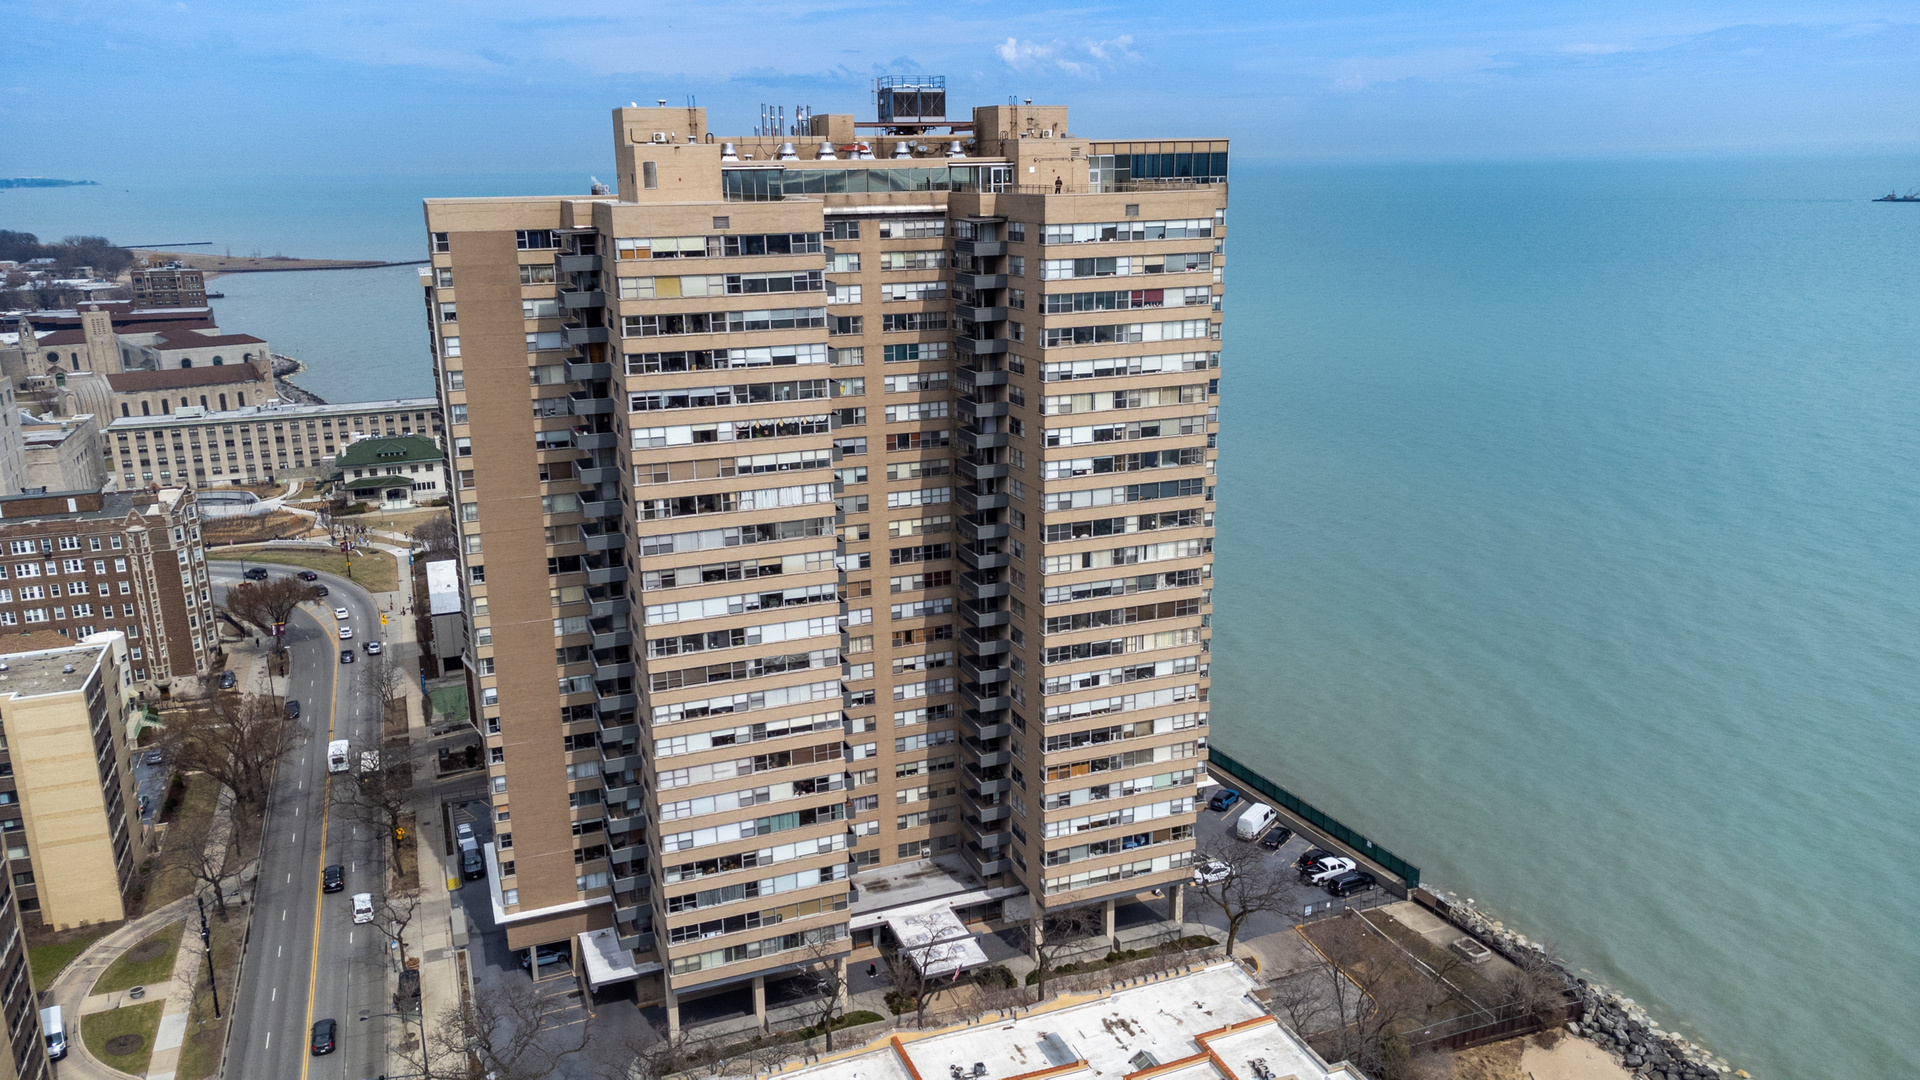
6007 N Sheridan Rd, Chicago, IL 60660
$-709
Cash flow
-15.6%
Cash-on-Cash Return
2.1%
Cap rate
0.8%
Rent to Value Ratio
Active
$270,000
2
bds
|
2
ba
|
1,200
sqft
|
built
1969
6325 N Sheridan Rd, Chicago, IL 60660
$-766
Cash flow
-14.8%
Cash-on-Cash Return
2.3%
Cap rate
1.0%
Rent to Value Ratio
Active
$259,900
2
bds
|
1
ba
|
0
sqft
|
built
1926
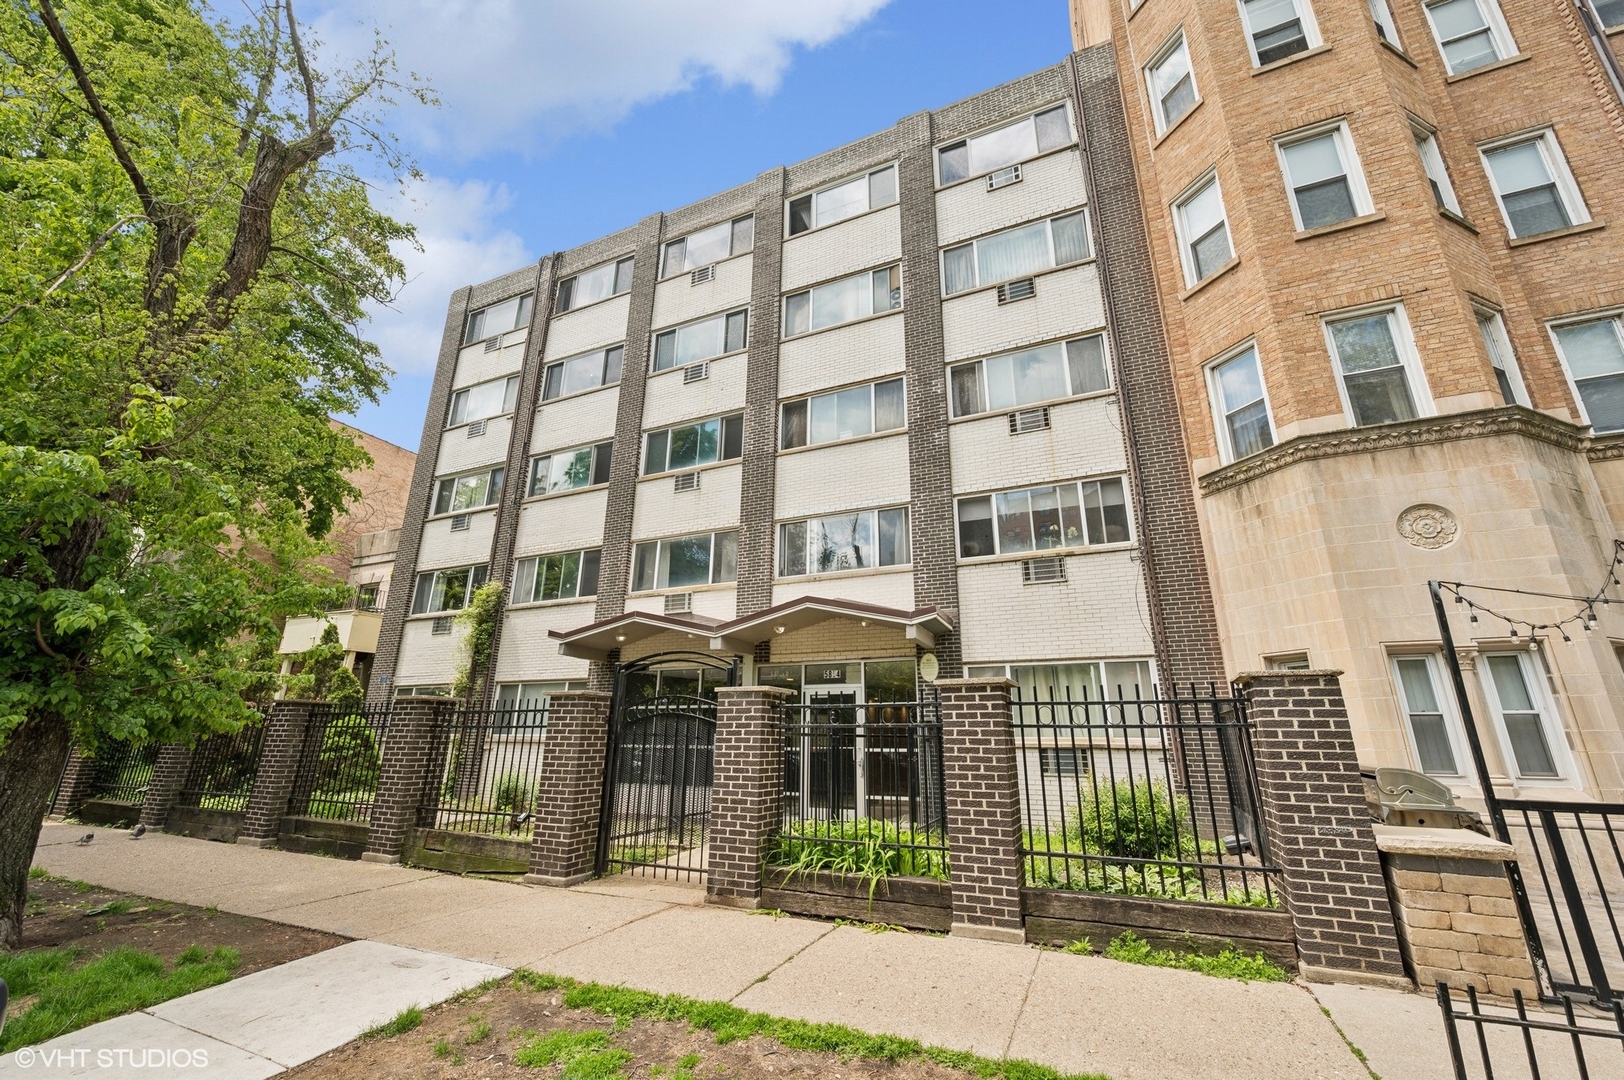
1453 W Elmdale Ave, Chicago, IL 60660
$-609
Cash flow
-12.2%
Cash-on-Cash Return
2.9%
Cap rate
0.7%
Rent to Value Ratio
Active
$515,000
3
bds
|
2
ba
|
0
sqft
|
built
1306 W Granville Ave, Chicago, IL 60660
$-1,569
Cash flow
-15.9%
Cash-on-Cash Return
2.0%
Cap rate
0.5%
Rent to Value Ratio
Active
$150,000
1
bds
|
1
ba
|
750
sqft
|
built
1970
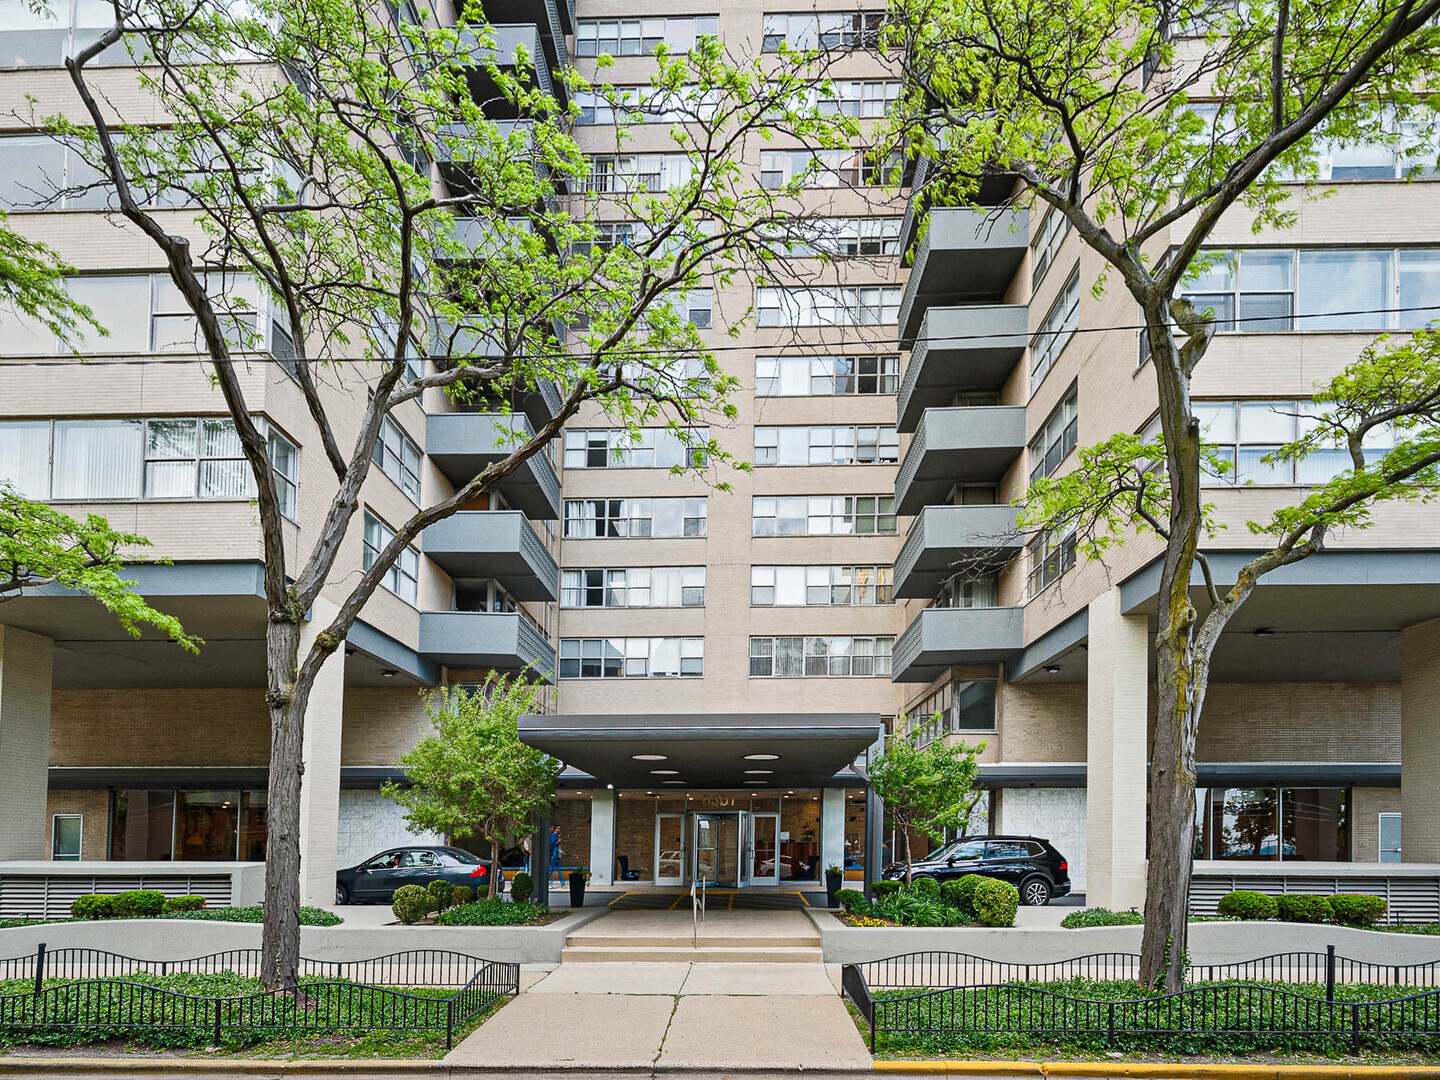
6301 N Sheridan Rd, Chicago, IL 60660
$-375
Cash flow
-13.0%
Cash-on-Cash Return
2.7%
Cap rate
1.3%
Rent to Value Ratio
Active
$325,000
1
bds
|
1
ba
|
1,000
sqft
|
built
1969
6007 N Sheridan Rd, Chicago, IL 60660
$-1,010
Cash flow
-16.2%
Cash-on-Cash Return
1.9%
Cap rate
0.7%
Rent to Value Ratio
Active
$249,900
2
bds
|
2
ba
|
1,250
sqft
|
built
1968
5757 N Sheridan Rd, Chicago, IL 60660
$-936
Cash flow
-19.5%
Cash-on-Cash Return
1.2%
Cap rate
1.0%
Rent to Value Ratio
Active
$269,900
1
bds
|
1
ba
|
1,000
sqft
|
built
1967
6007 N Sheridan Rd, Chicago, IL 60660
$-642
Cash flow
-12.4%
Cash-on-Cash Return
2.8%
Cap rate
0.9%
Rent to Value Ratio
Active
$700,000
5
bds
|
3
ba
|
2,600
sqft
|
built
1917
5863 N Kenmore Ave, Chicago, IL 60660
$-2,682
Cash flow
-20.0%
Cash-on-Cash Return
1.1%
Cap rate
0.3%
Rent to Value Ratio
Active
$300,000
2
bds
|
1
ba
|
1,000
sqft
|
built
1915
1359 W Elmdale Ave, Chicago, IL 60660
$-723
Cash flow
-12.6%
Cash-on-Cash Return
2.8%
Cap rate
0.6%
Rent to Value Ratio
Active
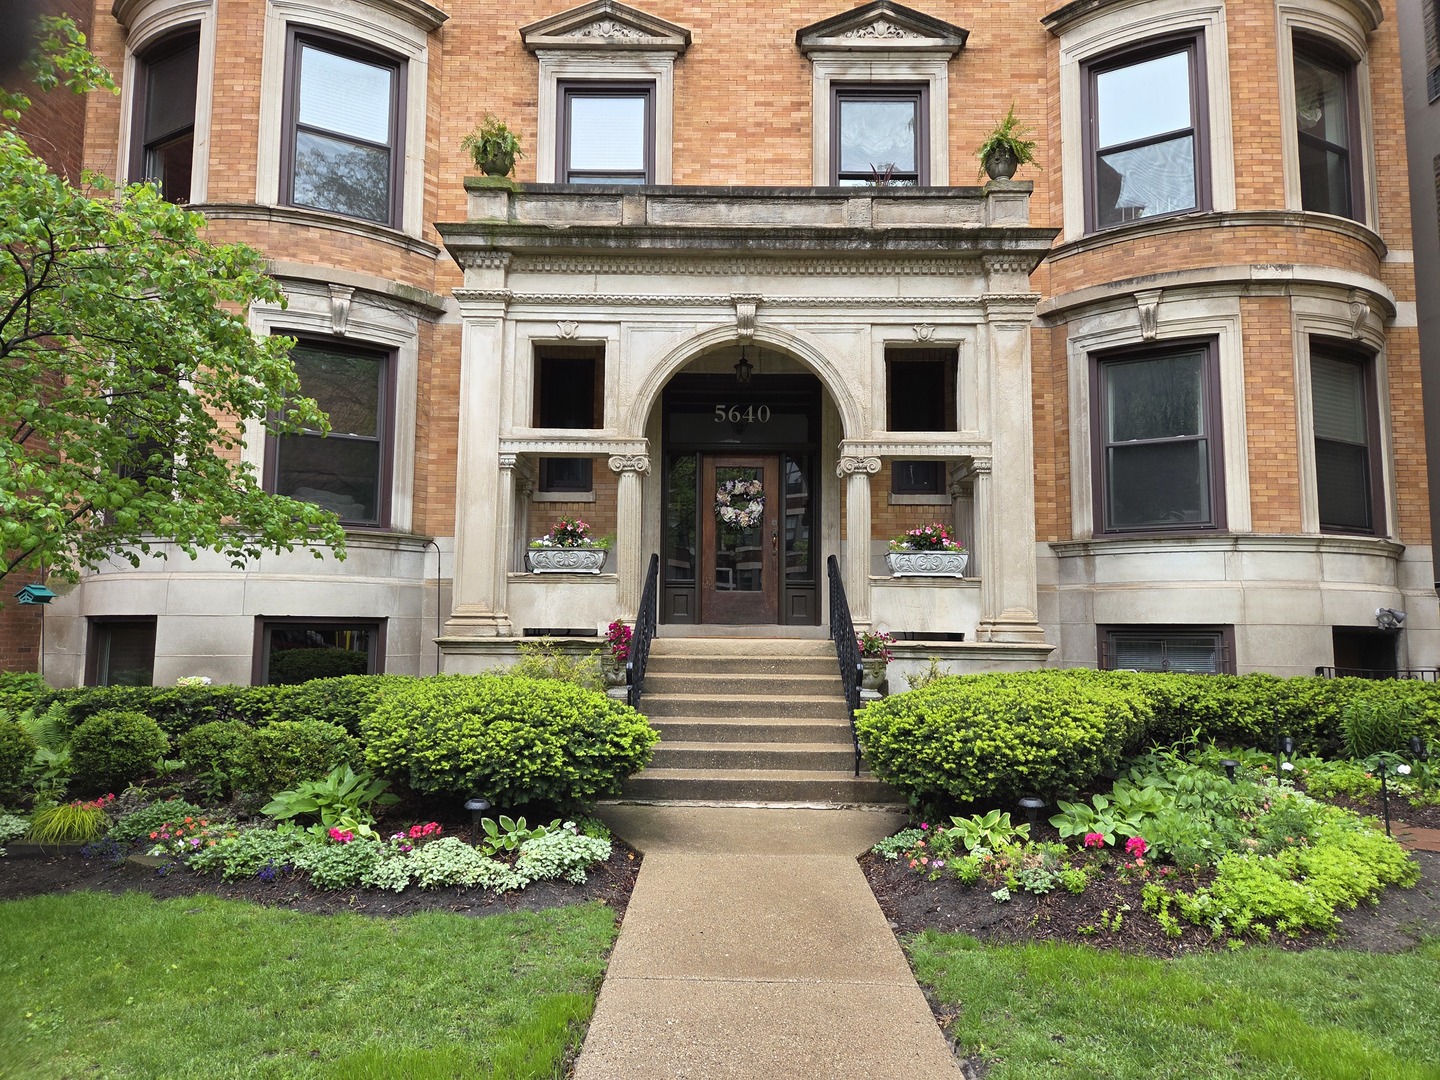
$347,500
3
bds
|
2
ba
|
1,600
sqft
|
built
1920
5640 N Kenmore Ave, Chicago, IL 60660
$-64
Cash flow
-1.0%
Cash-on-Cash Return
5.5%
Cap rate
0.7%
Rent to Value Ratio
Active
$339,900
2
bds
|
1
ba
|
0
sqft
|
built
2008
1134 W Granville Ave, Chicago, IL 60660
$-833
Cash flow
-12.8%
Cash-on-Cash Return
2.7%
Cap rate
0.7%
Rent to Value Ratio
Active
$229,000
2
bds
|
2
ba
|
1,250
sqft
|
built
1963
6301 N Sheridan Rd, Chicago, IL 60660
$-1,205
Cash flow
-27.5%
Cash-on-Cash Return
-0.6%
Cap rate
1.0%
Rent to Value Ratio
Active
$388,000
2
bds
|
2
ba
|
1,480
sqft
|
built
1967
6007 N Sheridan Rd, Chicago, IL 60660
$-819
Cash flow
-11.0%
Cash-on-Cash Return
3.1%
Cap rate
0.8%
Rent to Value Ratio
Active
$164,900
1
bds
|
1
ba
|
0
sqft
|
built
1963
6301 N Sheridan Rd, Chicago, IL 60660
$-455
Cash flow
-14.4%
Cash-on-Cash Return
2.4%
Cap rate
1.0%
Rent to Value Ratio
Active
$299,999
2
bds
|
2
ba
|
0
sqft
|
built
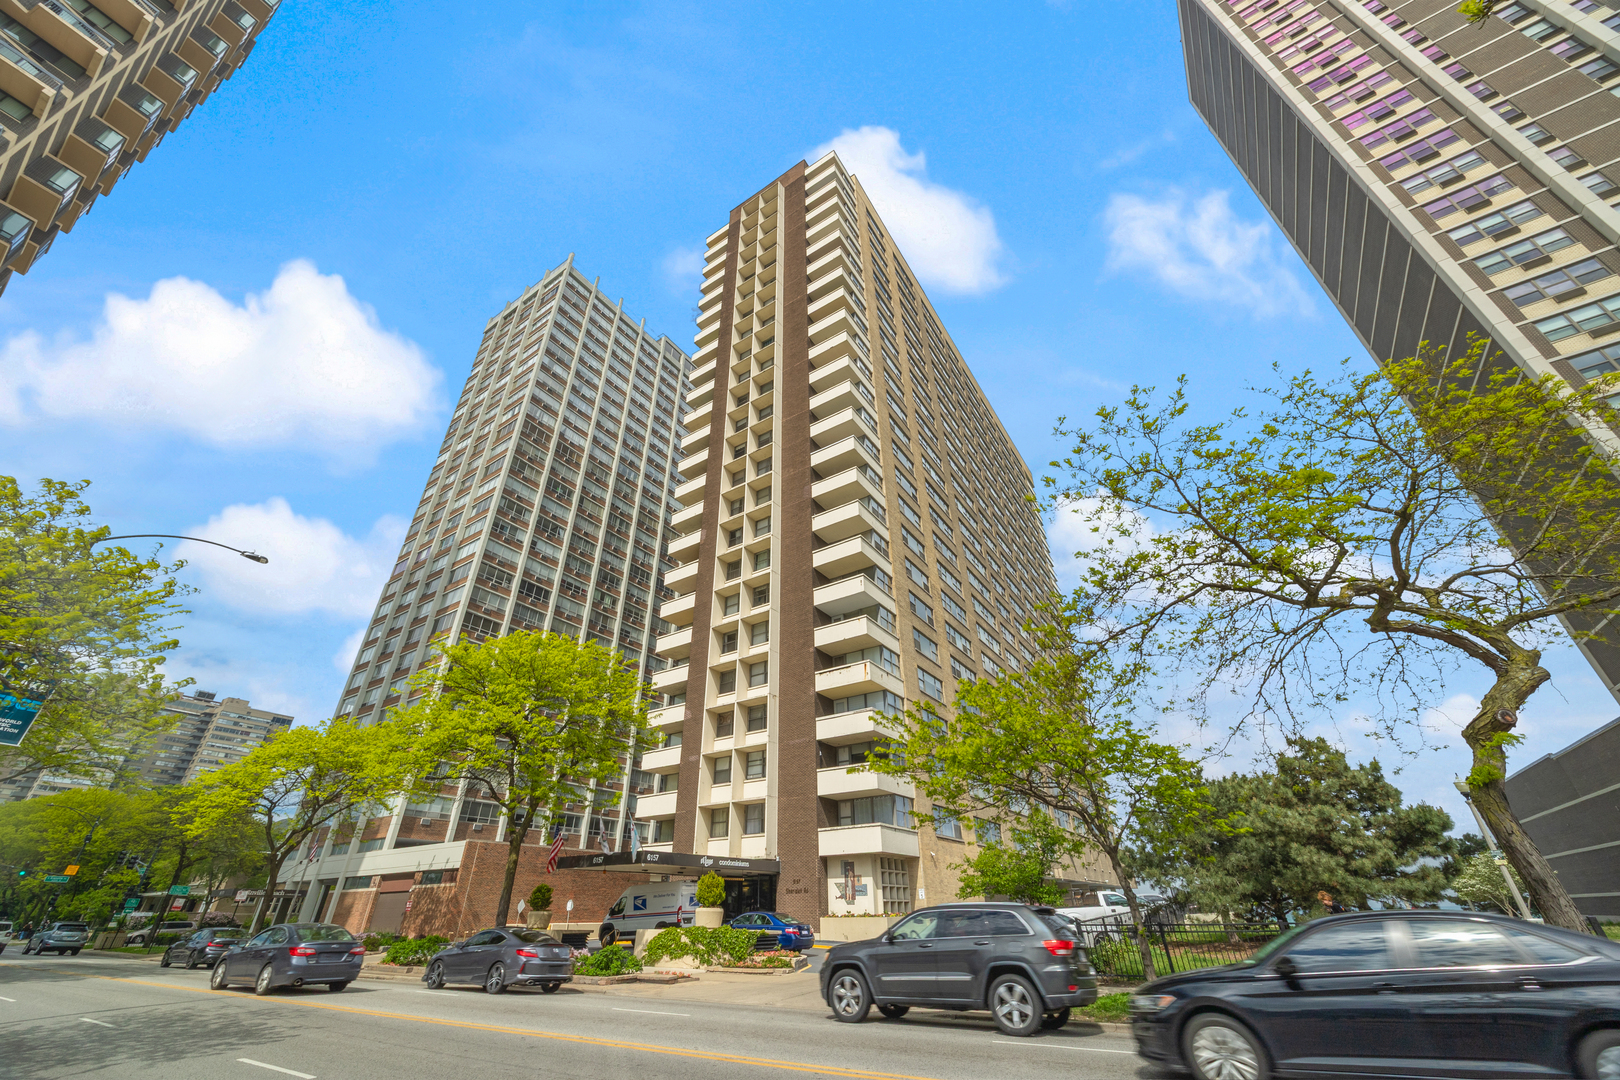
1963
6157 N Sheridan Rd, Chicago, IL 60660
$-1,001
Cash flow
-17.4%
Cash-on-Cash Return
1.7%
Cap rate
0.8%
Rent to Value Ratio

Active
$219,000
1
bds
|
1
ba
|
1,000
sqft
|
built
1963
6157 N Sheridan Rd, Chicago, IL 60660
$-587
Cash flow
-14.0%
Cash-on-Cash Return
2.5%
Cap rate
0.9%
Rent to Value Ratio
Active under contract
$225,000
1
bds
|
1
ba
|
900
sqft
|
built
1967
5854 N Kenmore Ave, Chicago, IL 60660
$-401
Cash flow
-9.3%
Cash-on-Cash Return
3.5%
Cap rate
0.8%
Rent to Value Ratio
Active
$435,000
3
bds
|
1
ba
|
1,500
sqft
|
built
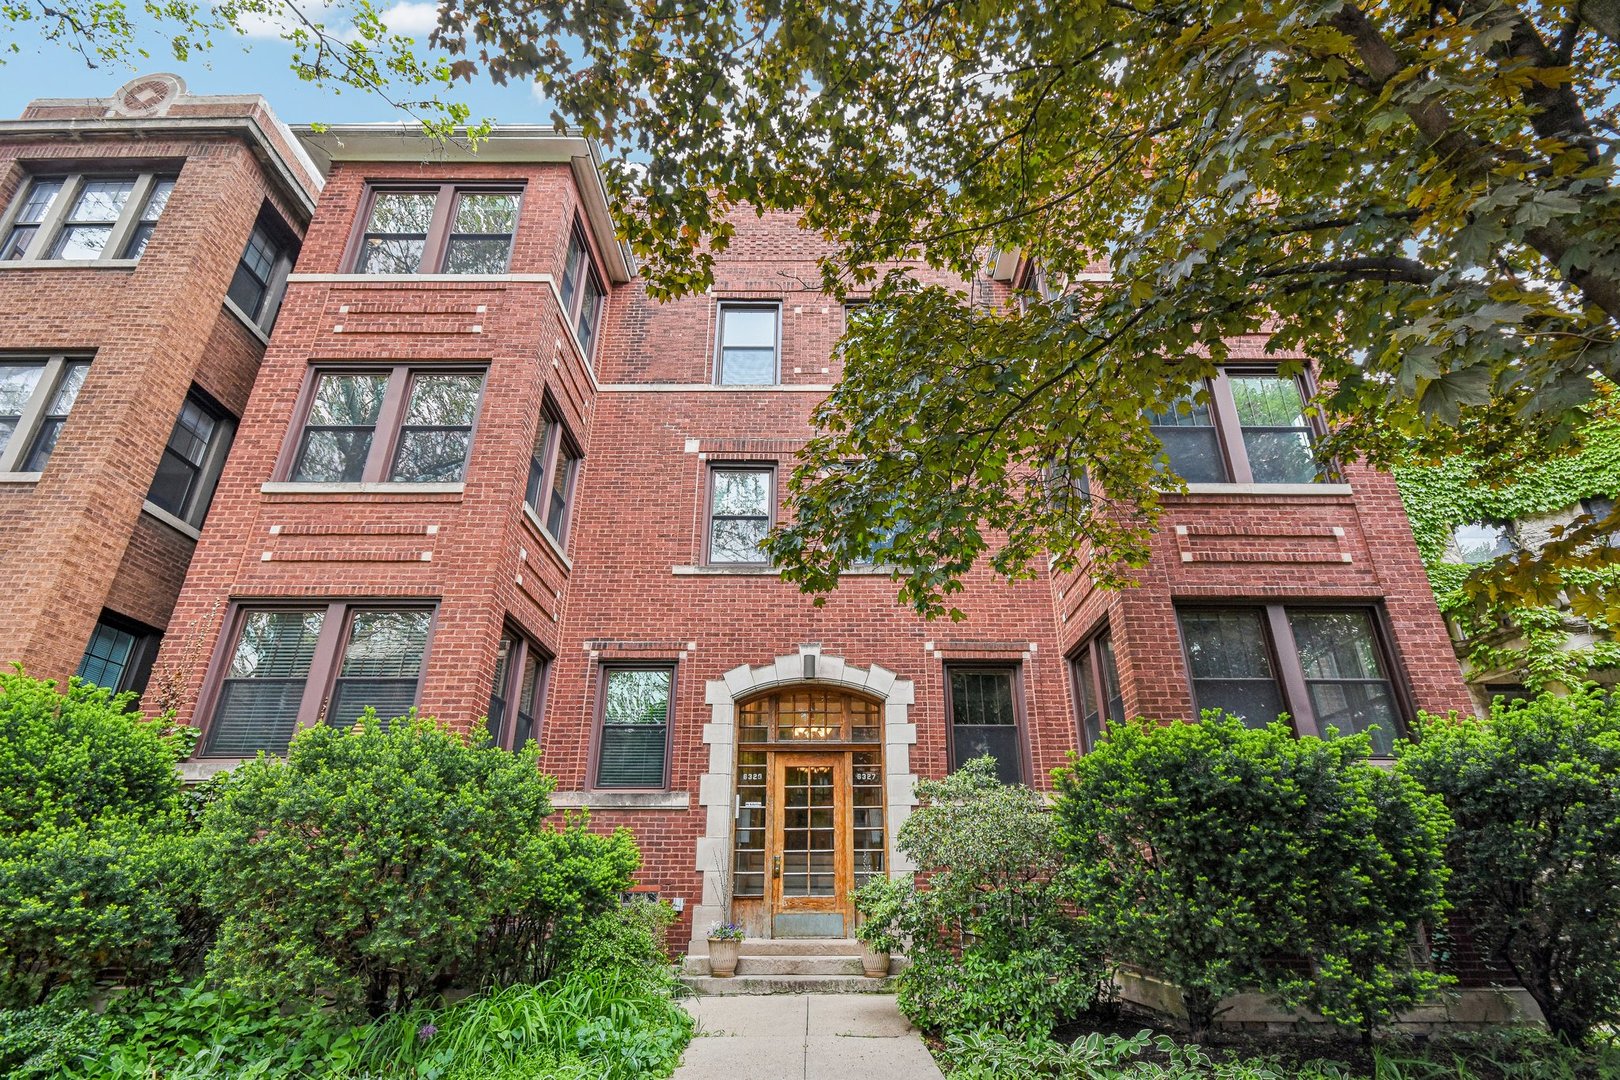
1925
6329 N Wayne Ave, Chicago, IL 60660
$-901
Cash flow
-10.8%
Cash-on-Cash Return
3.2%
Cap rate
0.7%
Rent to Value Ratio
Active under contract
$225,000
2
bds
|
2
ba
|
1,433
sqft
|
built
1972
6033 N Sheridan Rd, Chicago, IL 60660
$-315
Cash flow
-7.3%
Cash-on-Cash Return
4.0%
Cap rate
1.2%
Rent to Value Ratio
Active
$475,000
2
bds
|
2
ba
|
1,350
sqft
|
built
2006
6065 N Ridge Ave, Chicago, IL 60660
$-878
Cash flow
-9.6%
Cash-on-Cash Return
3.5%
Cap rate
0.7%
Rent to Value Ratio
Active under contract
$150,000
1
bds
|
1
ba
|
750
sqft
|
built
1970
6301 N Sheridan Rd, Chicago, IL 60660
$-579
Cash flow
-20.1%
Cash-on-Cash Return
1.0%
Cap rate
1.1%
Rent to Value Ratio

Active
$308,000
2
bds
|
1
ba
|
0
sqft
|
built
2008
1134 W Granville Ave, Chicago, IL 60660
$-844
Cash flow
-14.3%
Cash-on-Cash Return
2.4%
Cap rate
0.7%
Rent to Value Ratio
Active
$235,000
2
bds
|
2
ba
|
1,100
sqft
|
built
1963
6301 N Sheridan Rd, Chicago, IL 60660
$-1,145
Cash flow
-25.4%
Cash-on-Cash Return
-0.2%
Cap rate
1.0%
Rent to Value Ratio
Active
$179,000
1
bds
|
1
ba
|
800
sqft
|
built
1960
6301 N Sheridan Rd, Chicago, IL 60660
$-477
Cash flow
-13.9%
Cash-on-Cash Return
2.5%
Cap rate
1.1%
Rent to Value Ratio
Active under contract
$310,000
3
bds
|
3
ba
|
1,200
sqft
|
built
1964
1713 W Thome Ave, Chicago, IL 60660
$147
Cash flow
2.5%
Cash-on-Cash Return
6.2%
Cap rate
0.9%
Rent to Value Ratio
Active
$185,000
2
bds
|
1
ba
|
900
sqft
|
built
1957
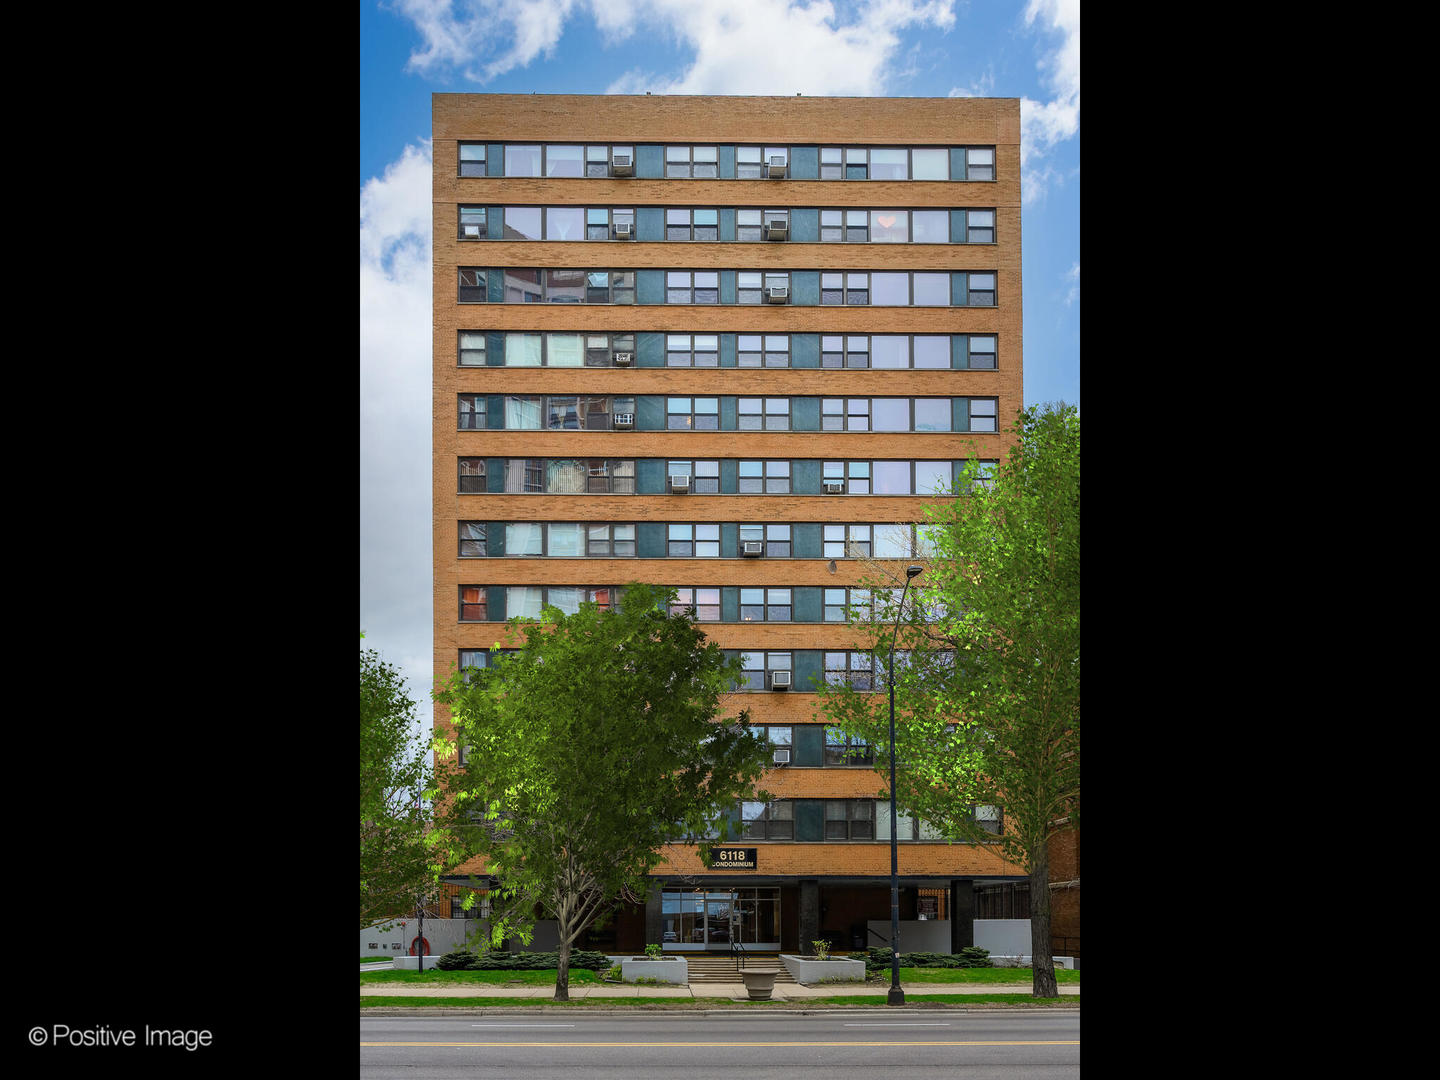
6118 N Sheridan Rd, Chicago, IL 60660
$-410
Cash flow
-11.6%
Cash-on-Cash Return
3.0%
Cap rate
1.2%
Rent to Value Ratio
Active
$144,900
bds
|
1
ba
|
470
sqft
|
built
1970
6171 N Sheridan Rd, Chicago, IL 60660
$131
Cash flow
4.7%
Cash-on-Cash Return
6.8%
Cap rate
1.4%
Rent to Value Ratio
Active
$339,000
2
bds
|
2
ba
|
1,519
sqft
|
built
1974
6033 N Sheridan Rd, Chicago, IL 60660
$-703
Cash flow
-10.8%
Cash-on-Cash Return
3.2%
Cap rate
0.9%
Rent to Value Ratio
Active
$205,000
1
bds
|
1
ba
|
750
sqft
|
built
1988
6102 N Sheridan Rd, Chicago, IL 60660
$-572
Cash flow
-14.6%
Cash-on-Cash Return
2.3%
Cap rate
1.0%
Rent to Value Ratio
Active under contract
$149,900
1
bds
|
1
ba
|
850
sqft
|
built
1963
6301 N Sheridan Rd, Chicago, IL 60660
$-519
Cash flow
-18.1%
Cash-on-Cash Return
1.5%
Cap rate
1.1%
Rent to Value Ratio
Active
$150,000
1
bds
|
1
ba
|
750
sqft
|
built
1951
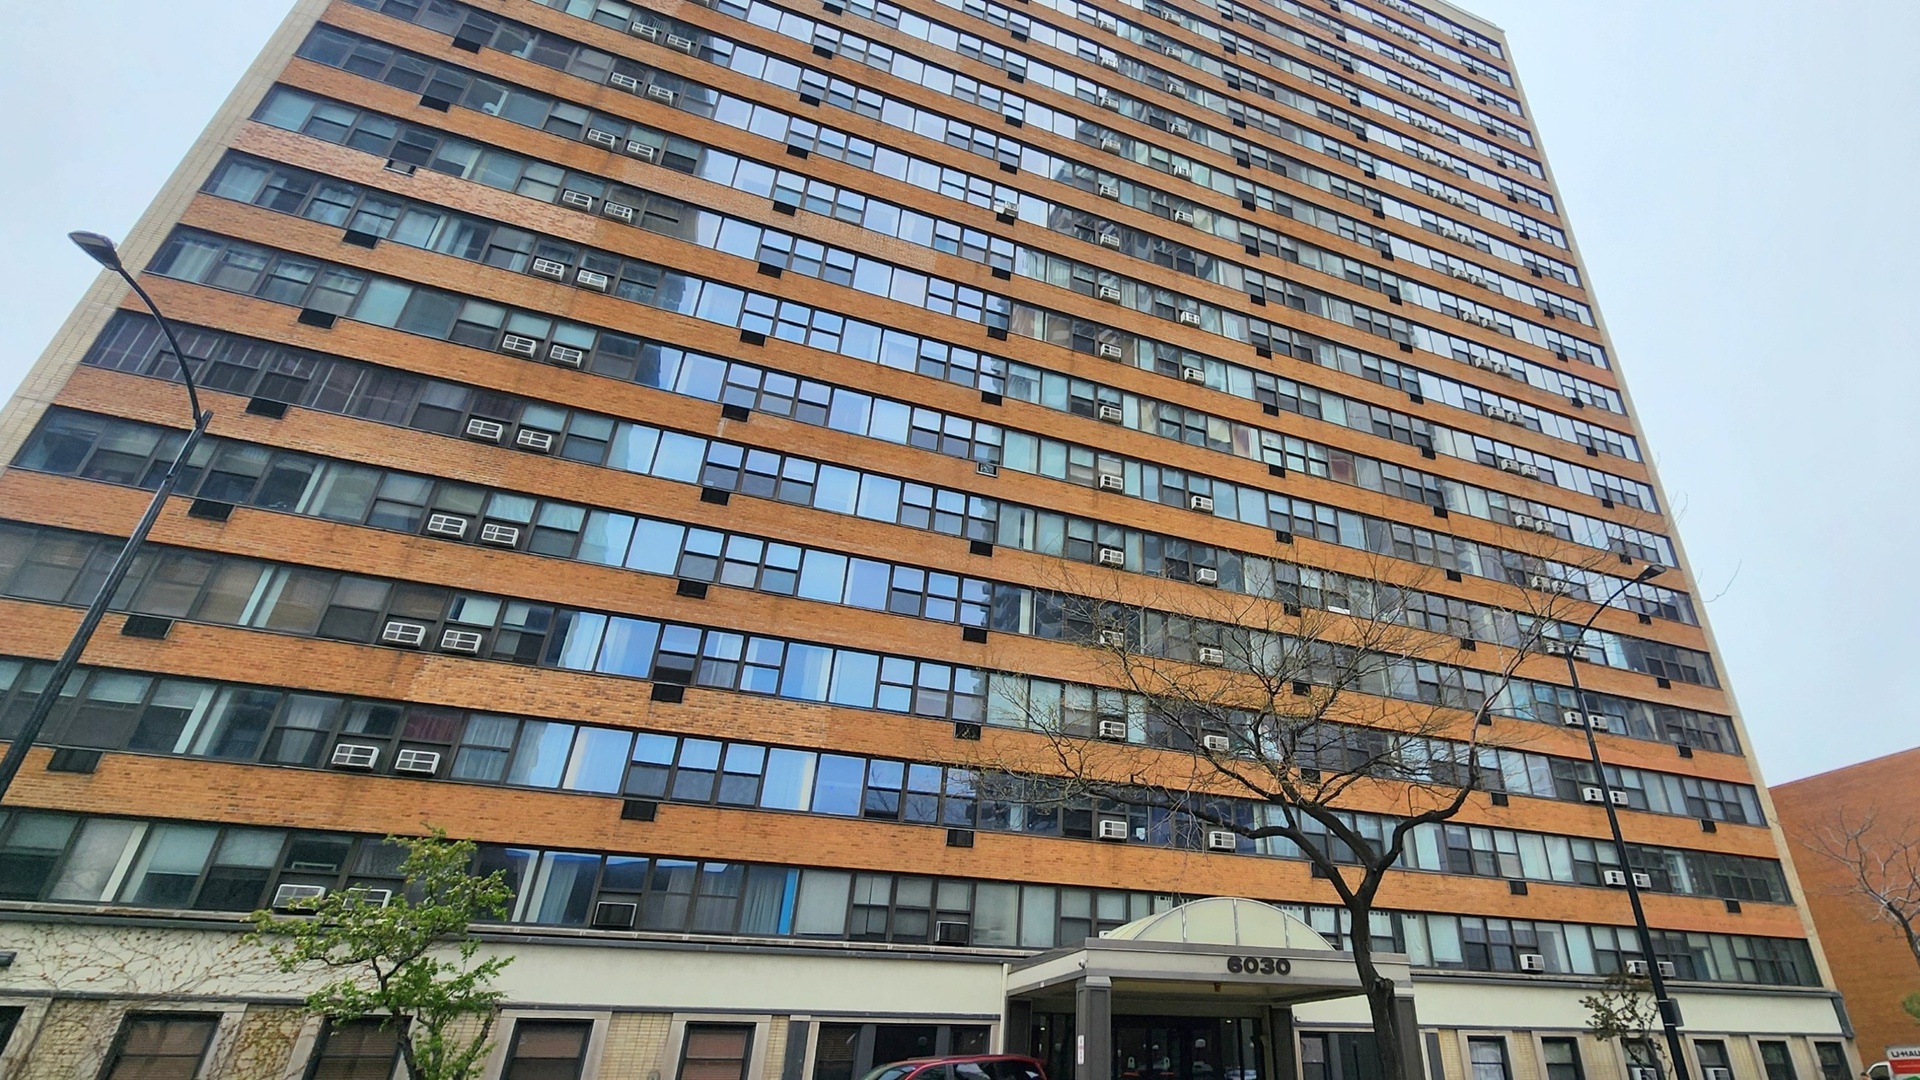
6030 N Sheridan Rd, Chicago, IL 60660
$-124
Cash flow
-4.3%
Cash-on-Cash Return
4.7%
Cap rate
1.2%
Rent to Value Ratio
Active
$139,500
bds
|
1
ba
|
0
sqft
|
built
1966
5601 N Sheridan Rd, Chicago, IL 60660
$-118
Cash flow
-4.4%
Cash-on-Cash Return
4.7%
Cap rate
1.1%
Rent to Value Ratio
Active
$359,000
2
bds
|
2
ba
|
0
sqft
|
built
1969
6007 N Sheridan Rd, Chicago, IL 60660
$-914
Cash flow
-13.3%
Cash-on-Cash Return
2.6%
Cap rate
0.8%
Rent to Value Ratio
Active
$179,900
1
bds
|
1
ba
|
900
sqft
|
built
1970
6171 N Sheridan Rd, Chicago, IL 60660
$-609
Cash flow
-17.7%
Cash-on-Cash Return
1.6%
Cap rate
0.9%
Rent to Value Ratio
Active
$174,900
1
bds
|
1
ba
|
720
sqft
|
built
1949
6030 N Sheridan Rd, Chicago, IL 60660
$-352
Cash flow
-10.5%
Cash-on-Cash Return
3.3%
Cap rate
1.0%
Rent to Value Ratio