60660 Investment Properties for Sale
Browse homes for sale and investment properties in 60660. Refine your search by price, property type, or more.
Best cash flowing properties in 60660
Active
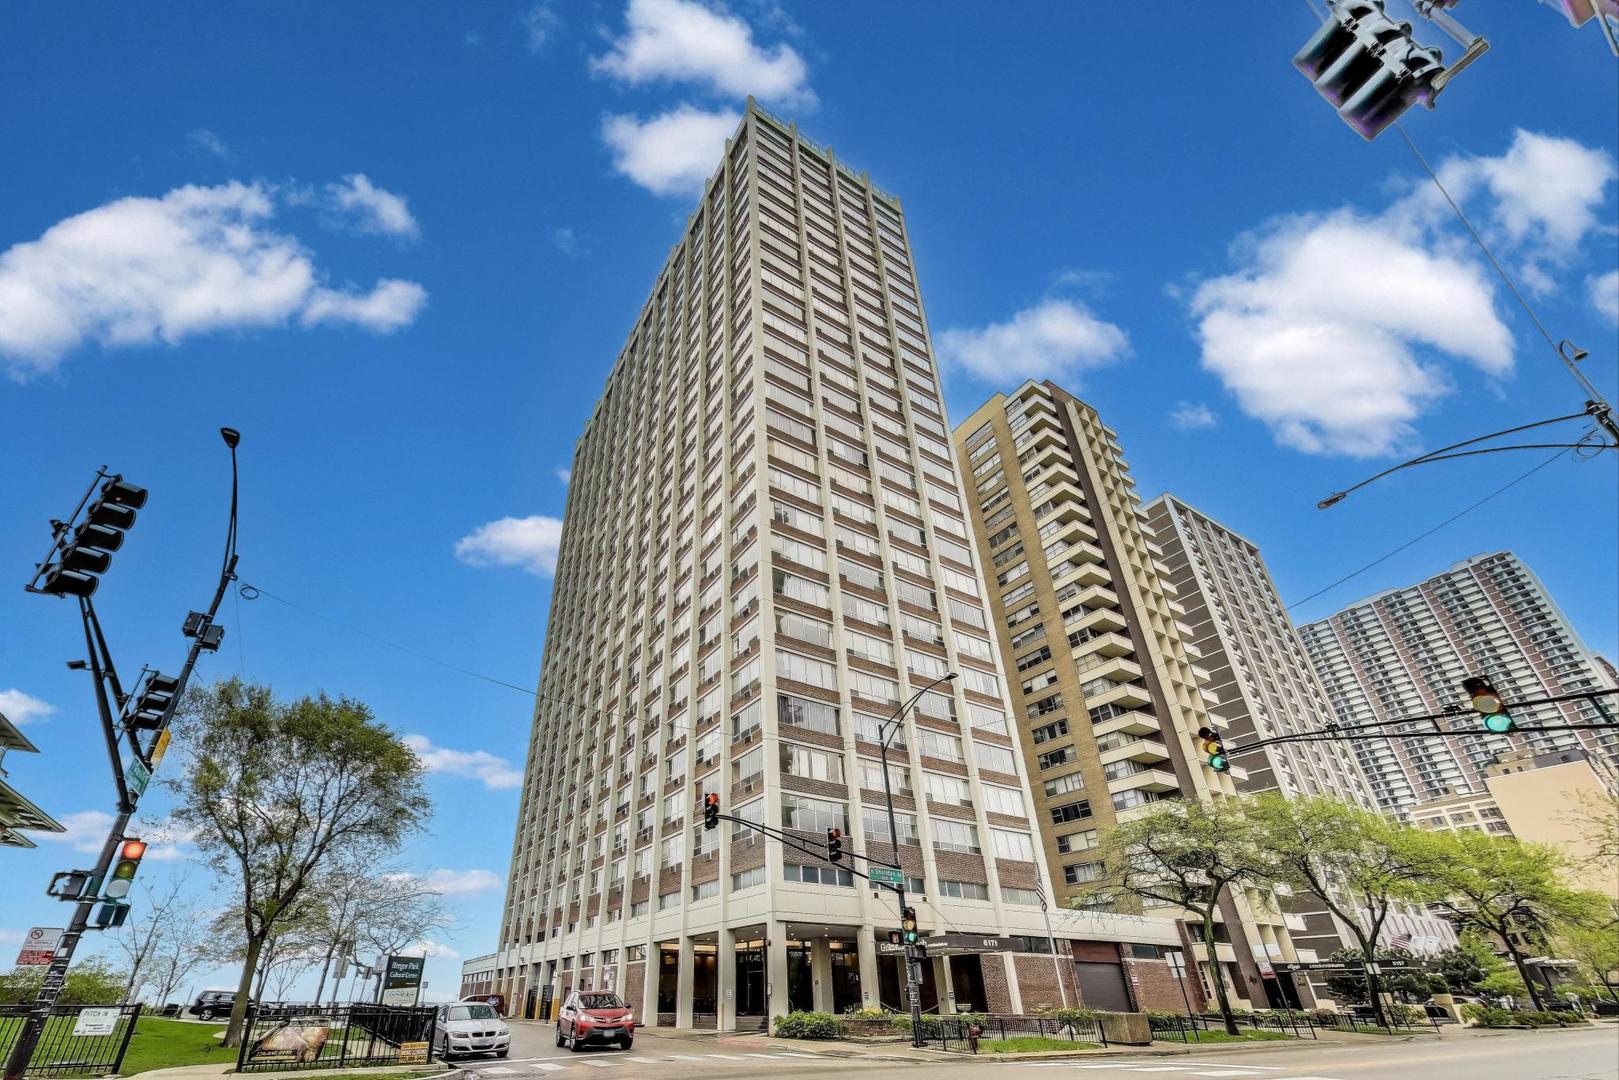
$144,900
bds
|
1
ba
|
470
sqft
|
built
1970
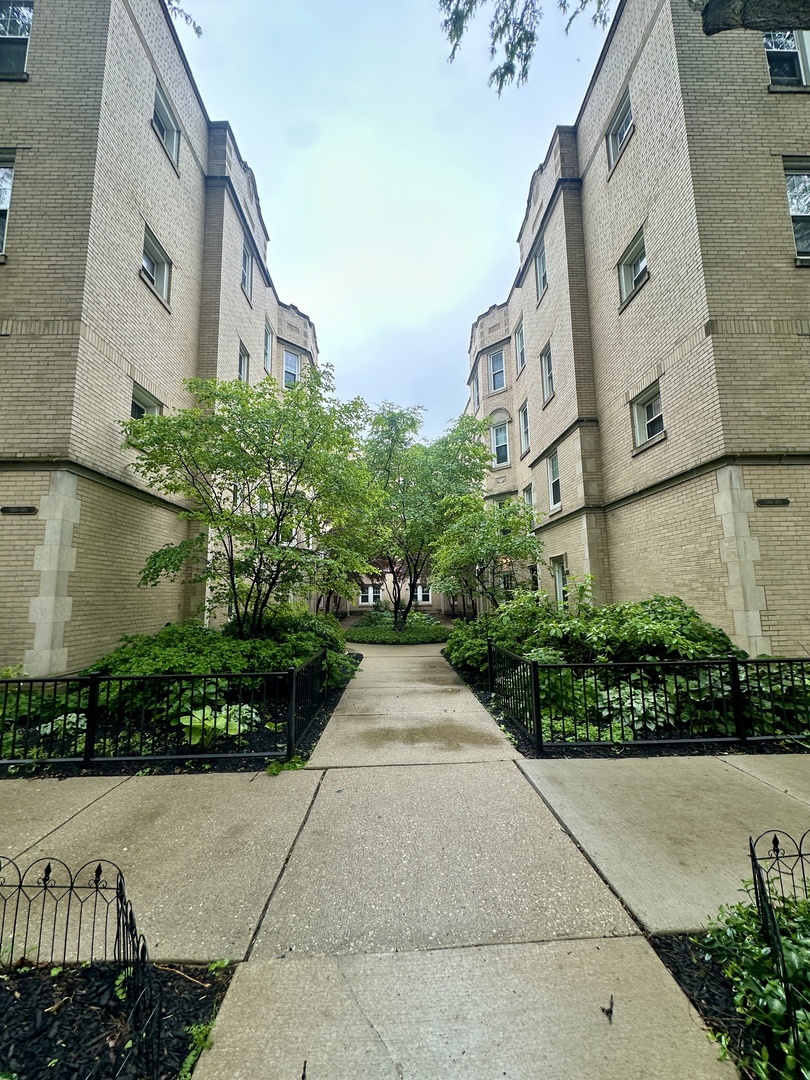
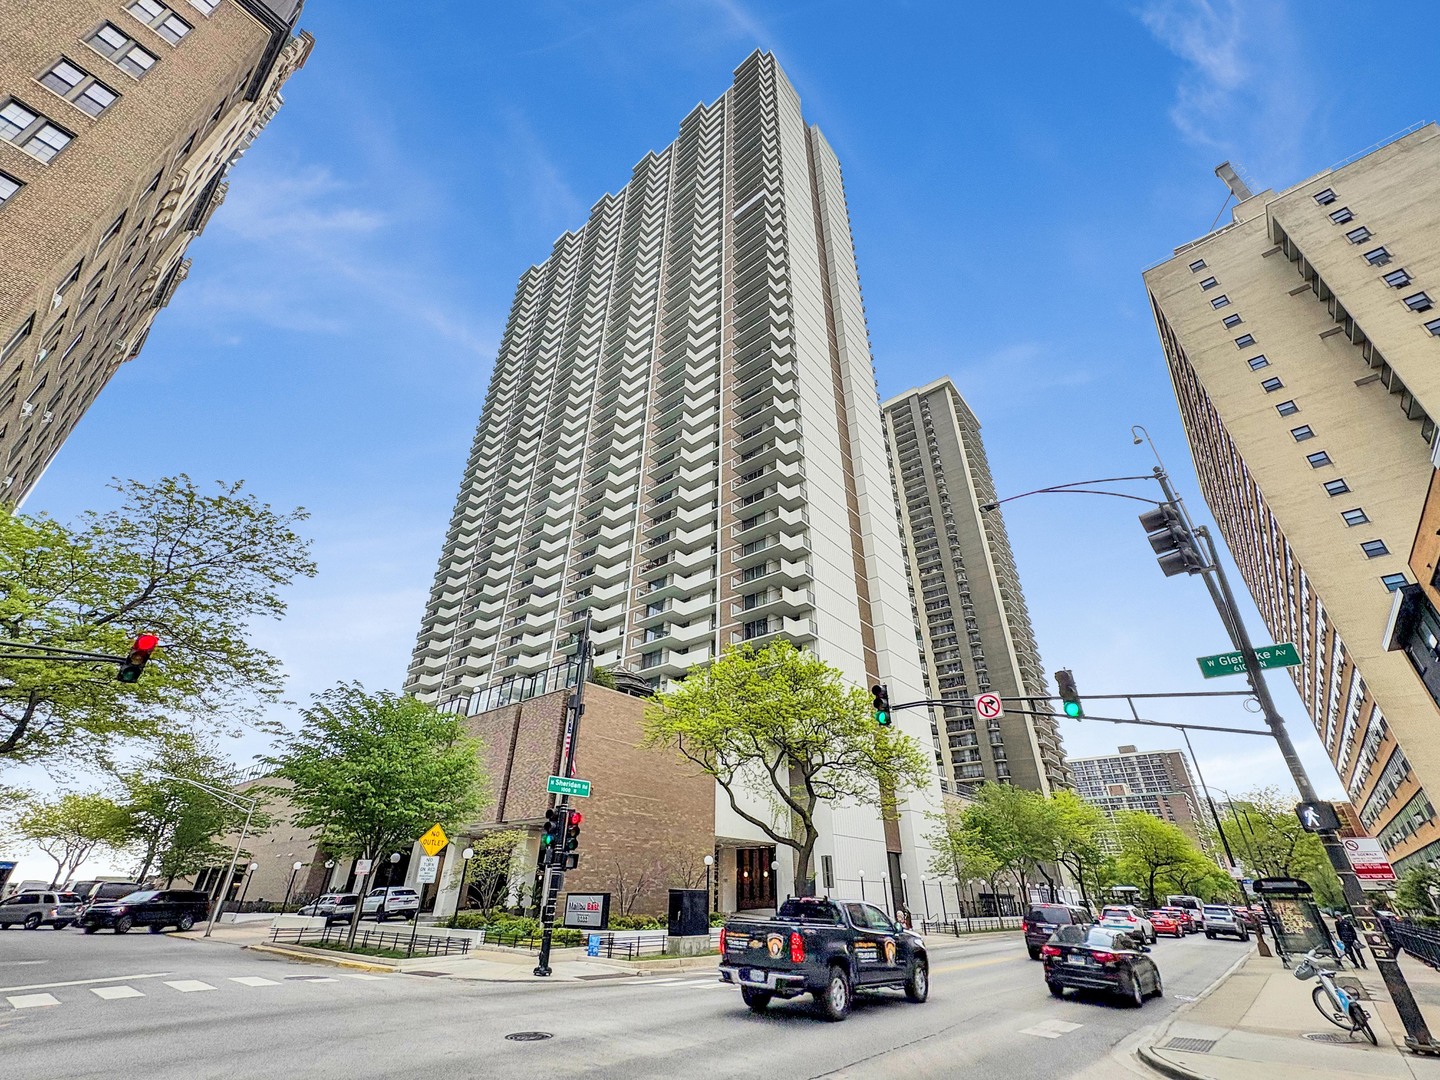
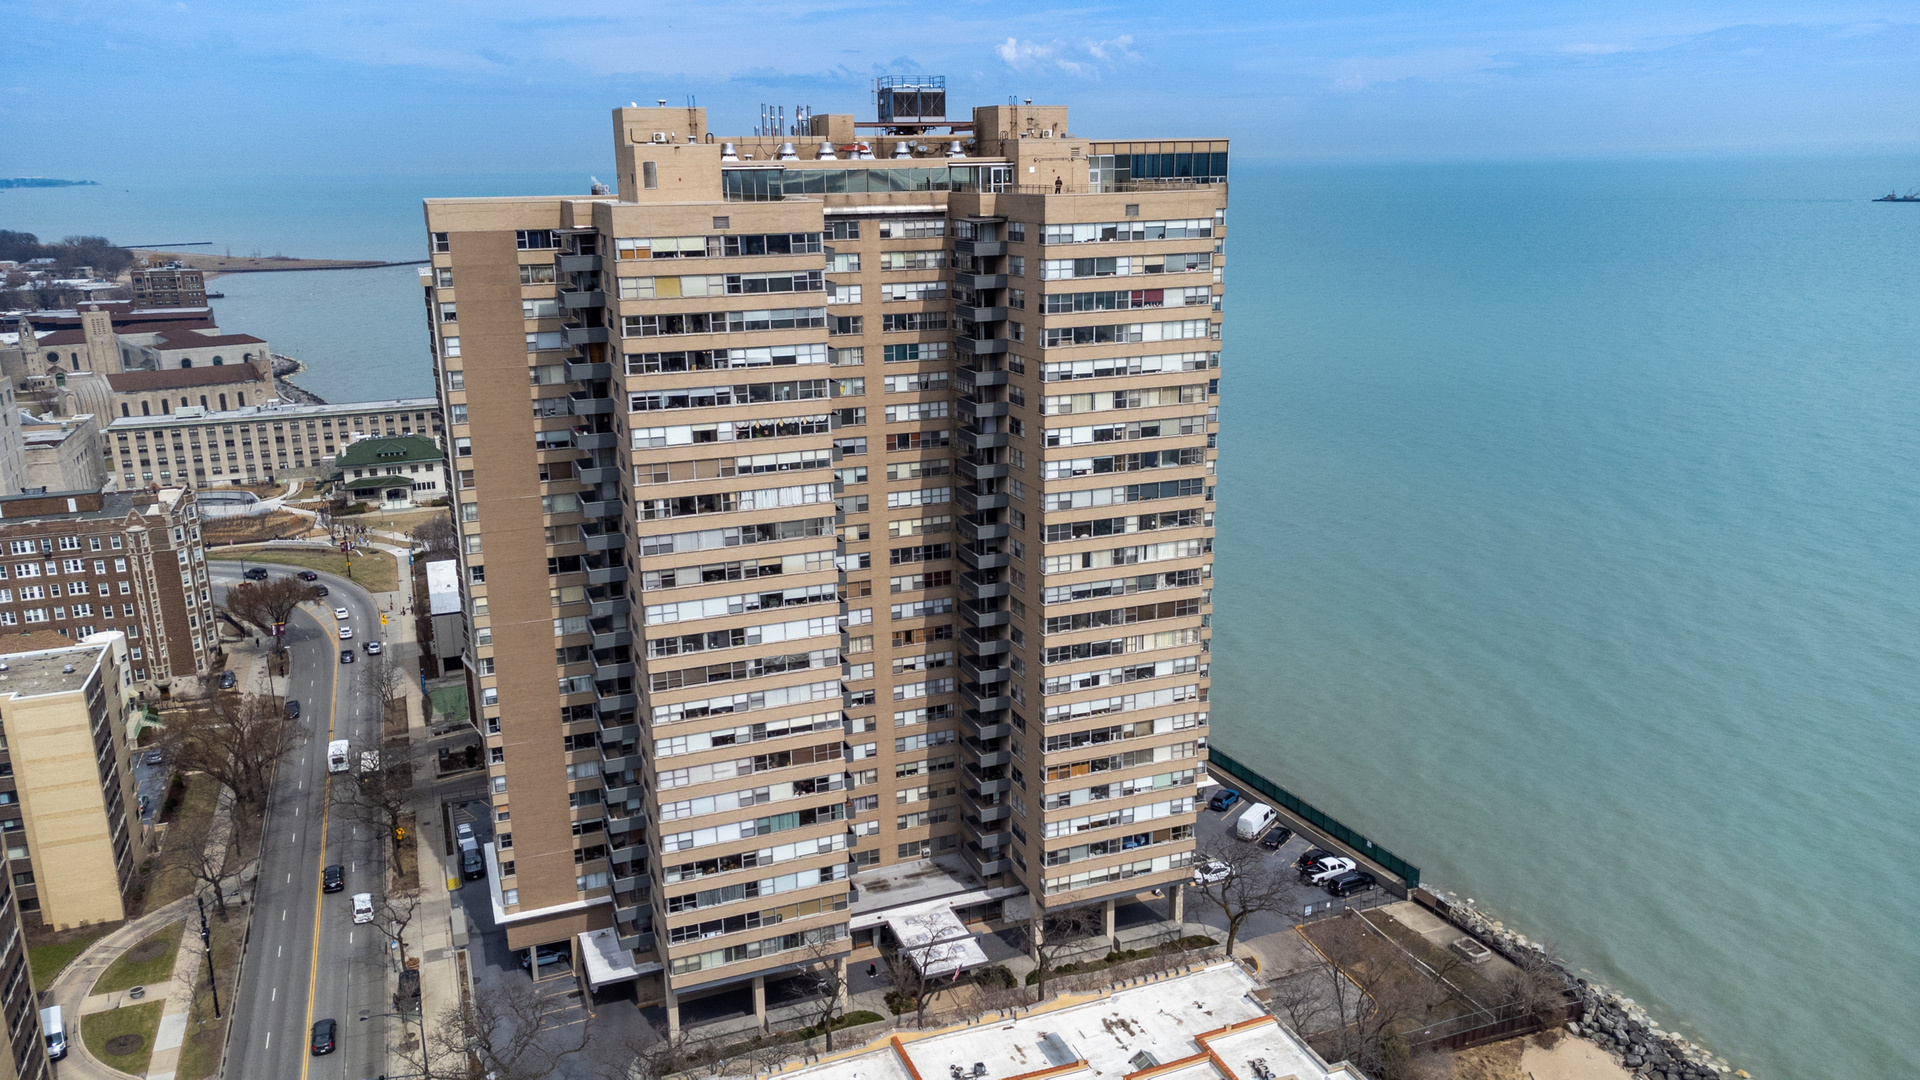
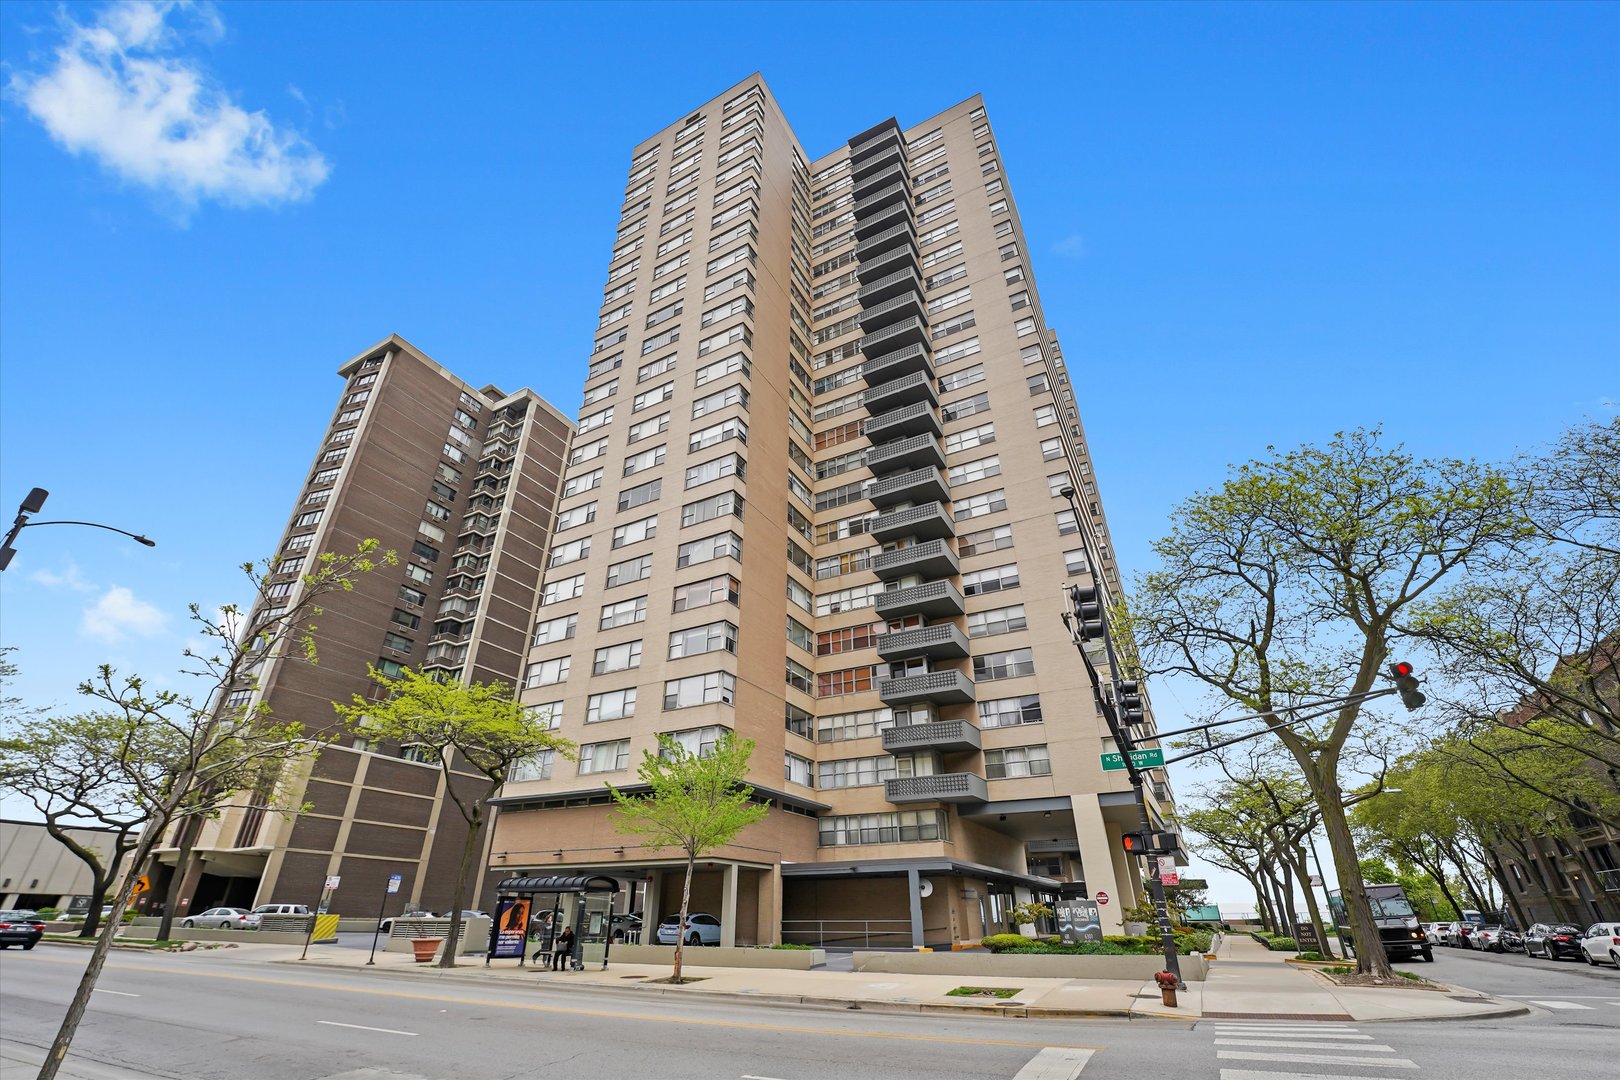
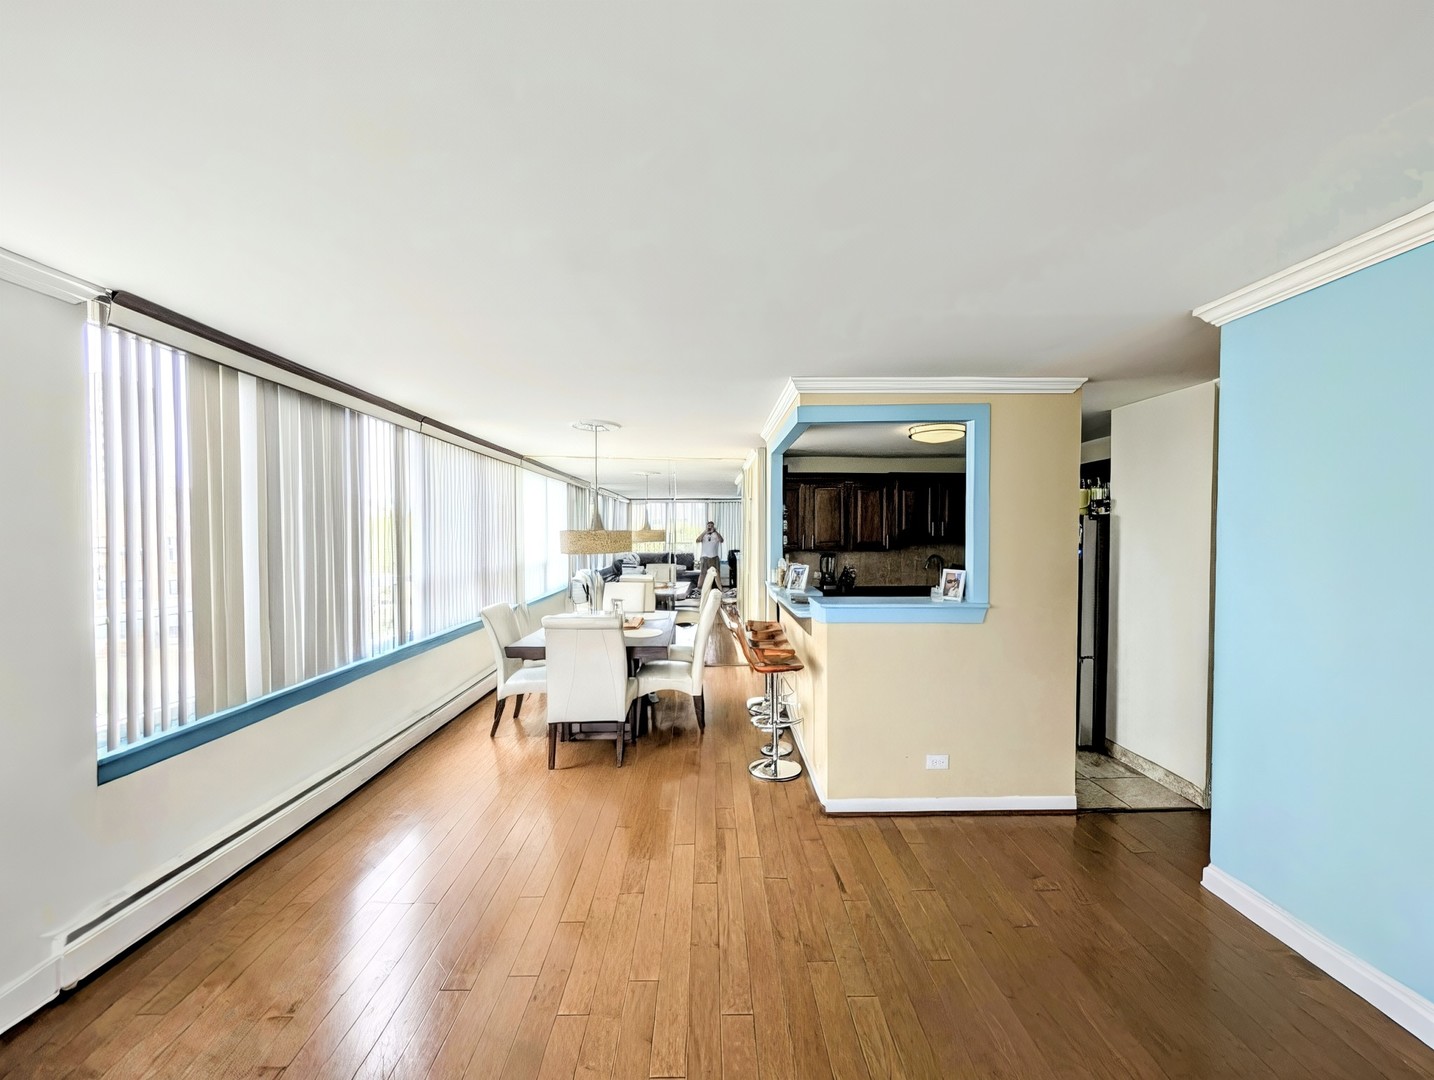
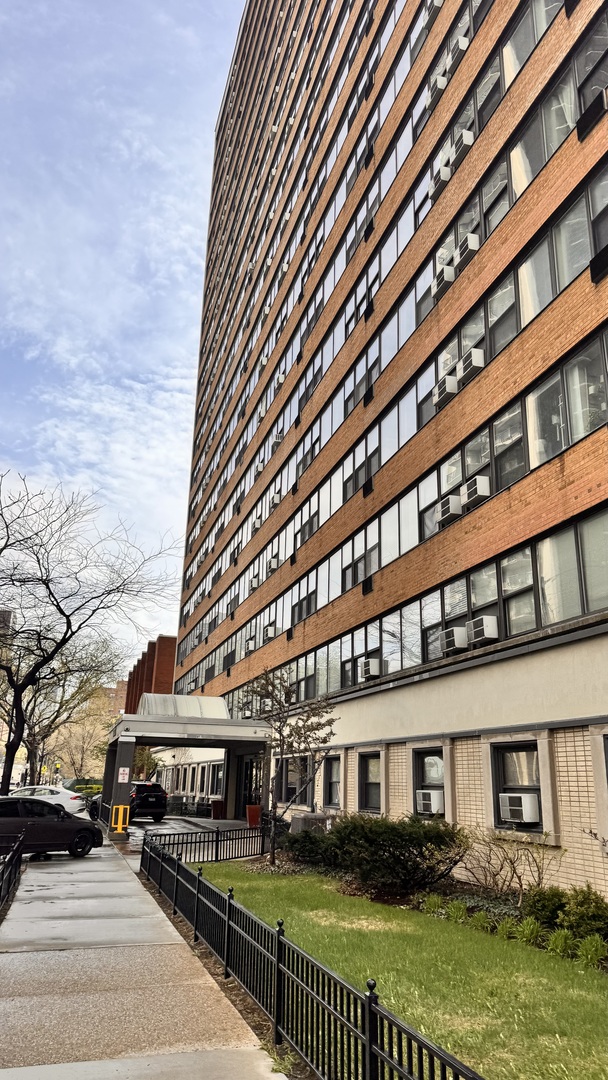
6171 N Sheridan Rd, Chicago, IL 60660
$58
Cash flow
2.1%
Cash-on-Cash Return
6.8%
Cap rate
1.4%
Rent to Value Ratio
Active under contract
$310,000
3
bds
|
3
ba
|
1,200
sqft
|
built
1964
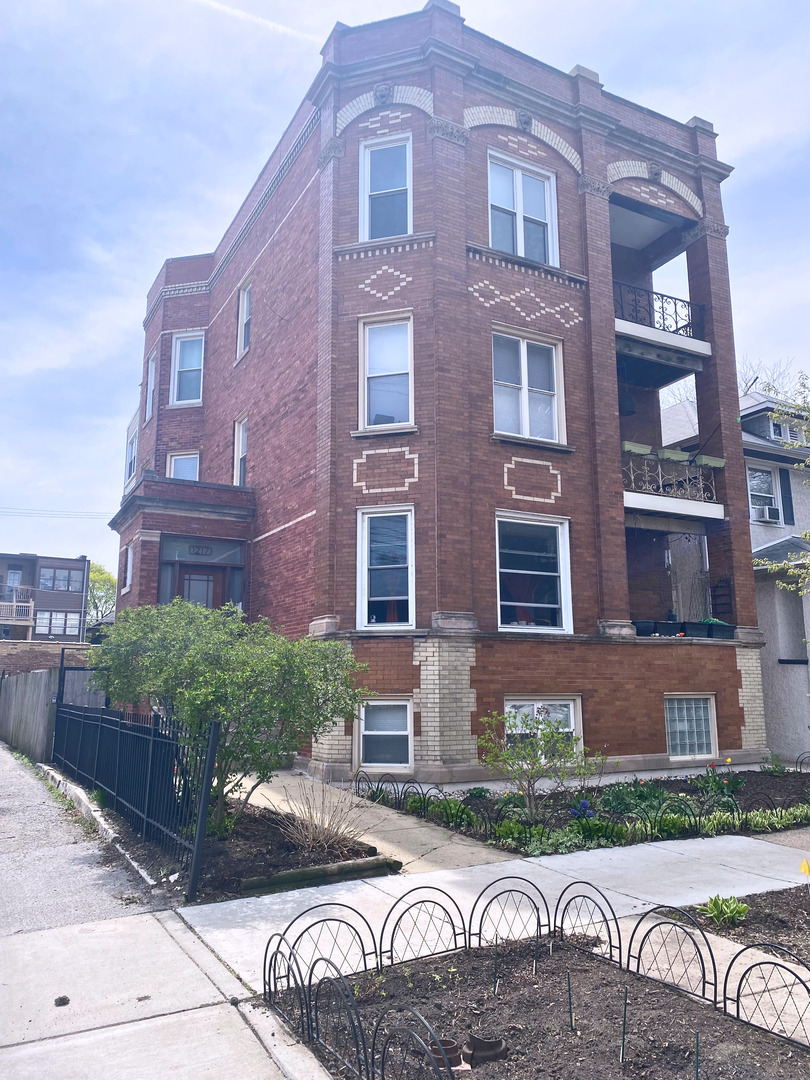
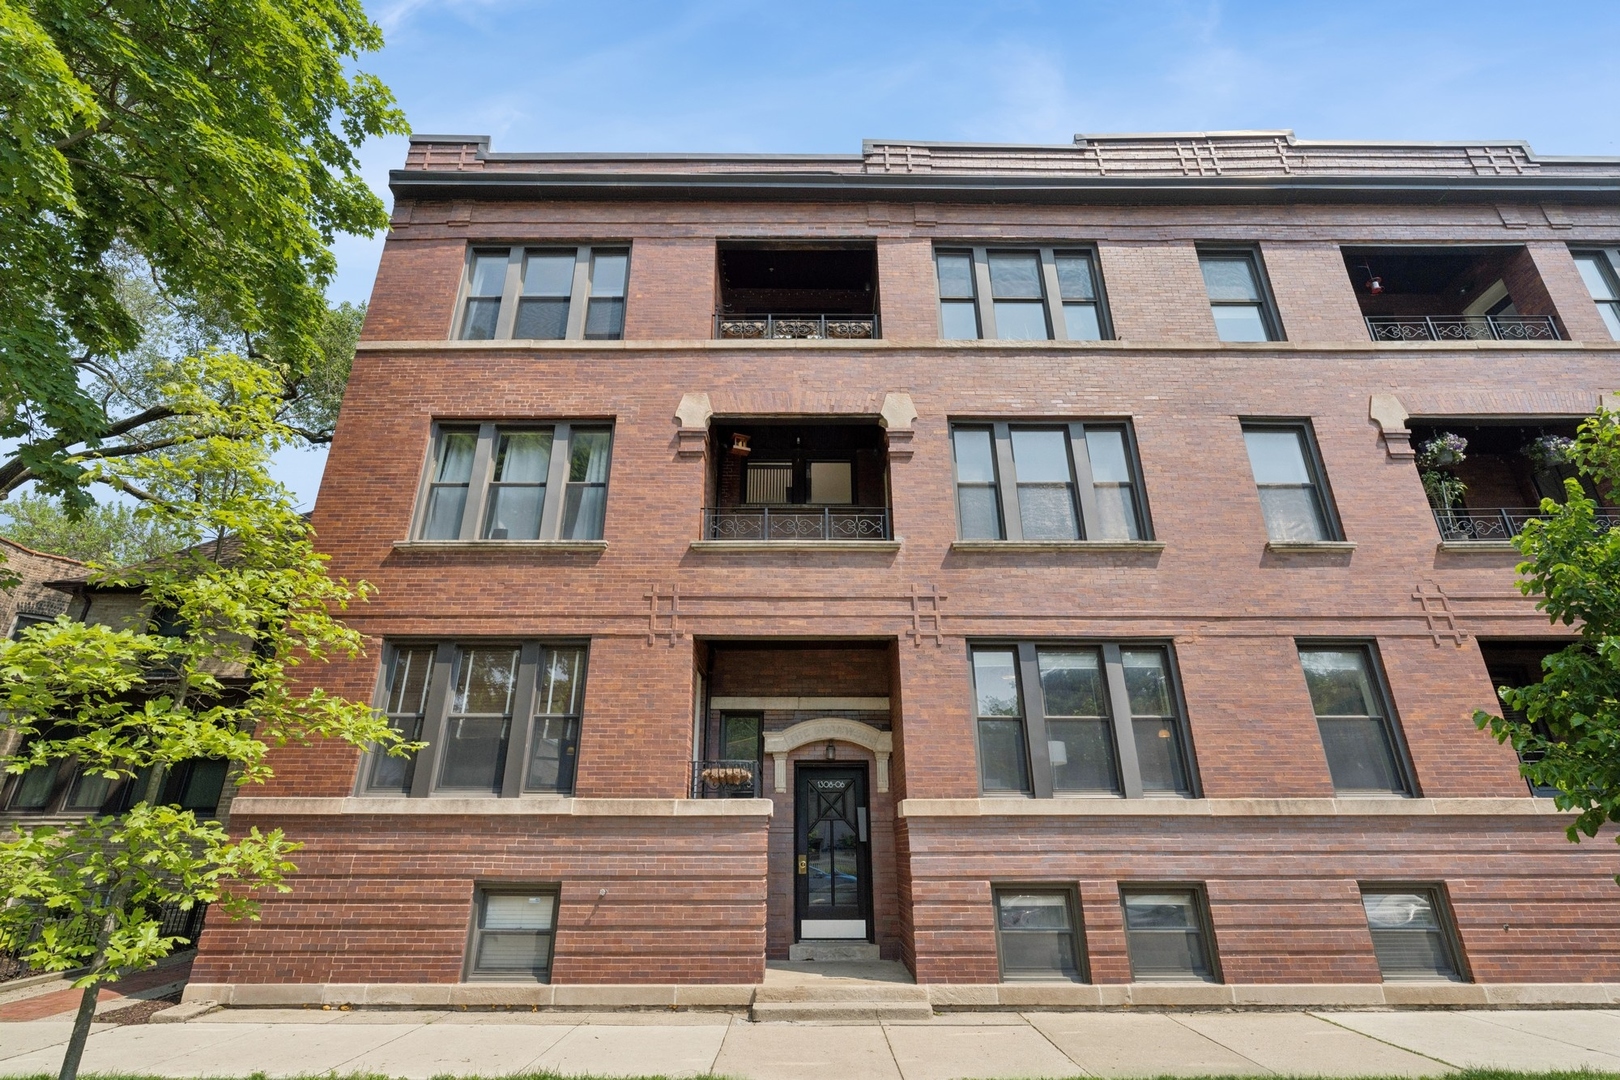
1713 W Thome Ave, Chicago, IL 60660
$-9
Cash flow
-0.2%
Cash-on-Cash Return
6.2%
Cap rate
0.9%
Rent to Value Ratio
60 out of 65 properties for sale in 60660
Limited Results Shown
Create a free account, or log in to reveal all property listings and enjoy the complete experience.
Active
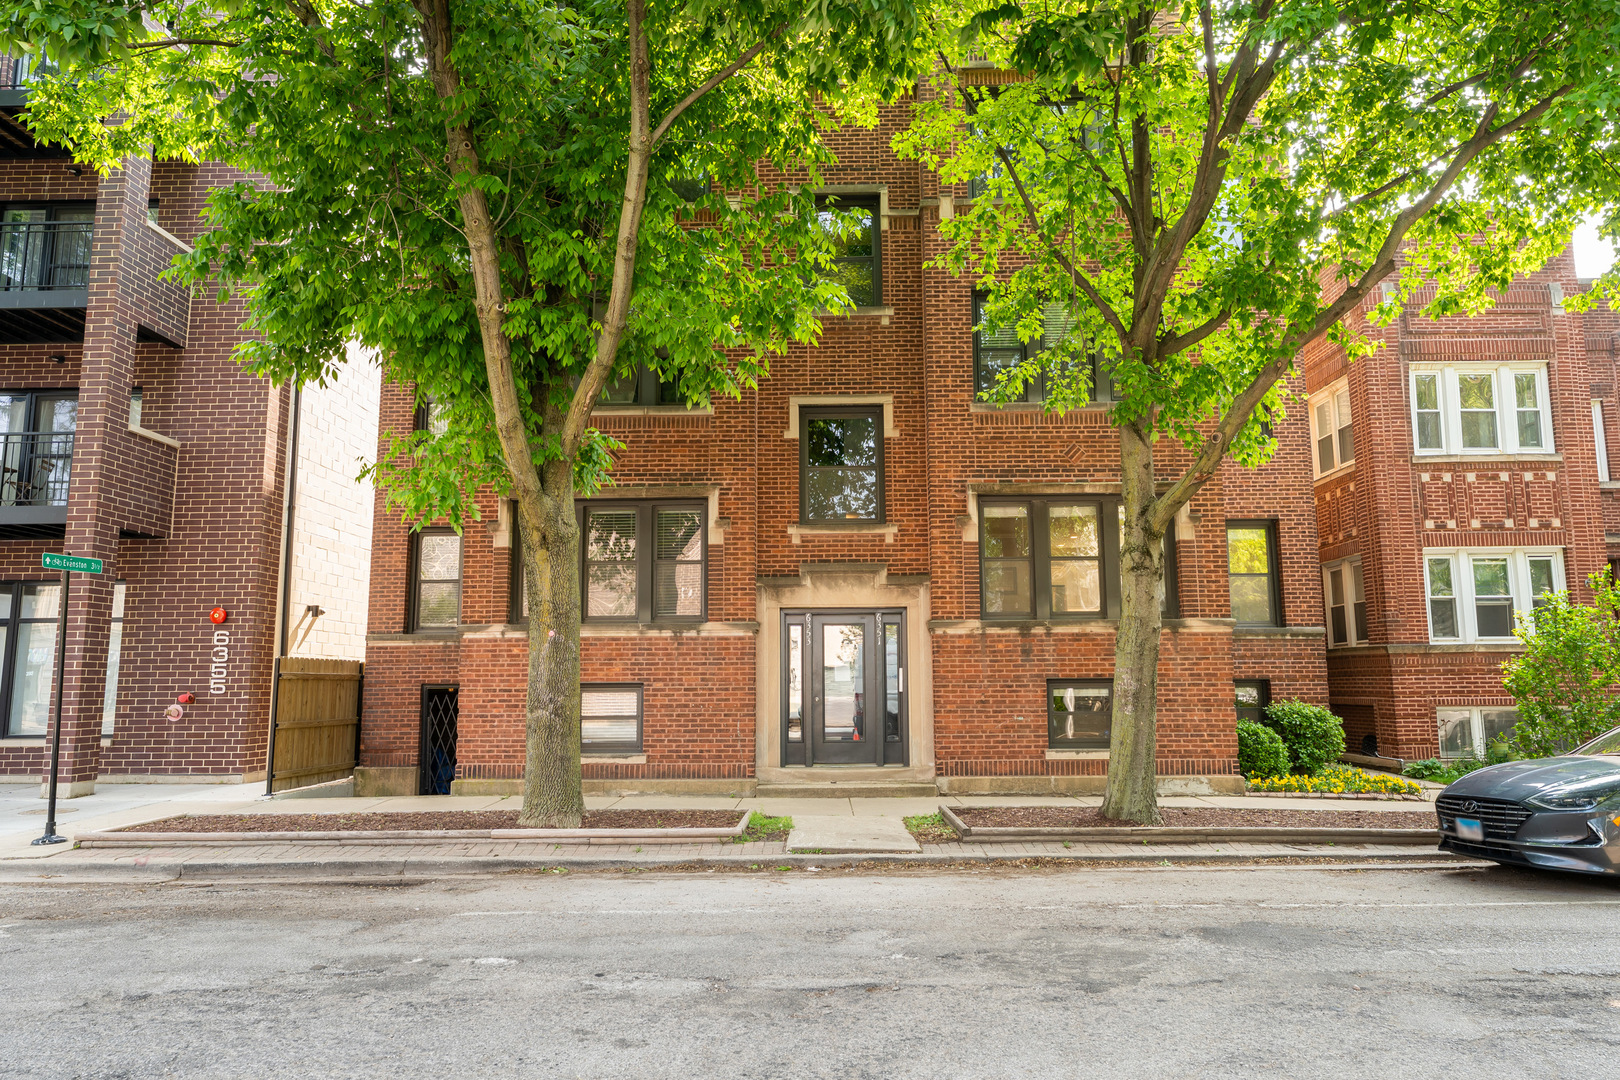
$548,000
3
bds
|
3
ba
|
2,000
sqft
|
built
1918
6351 N Glenwood Ave, Chicago, IL 60660
$-1,606
Cash flow
-15.3%
Cash-on-Cash Return
2.8%
Cap rate
0.6%
Rent to Value Ratio
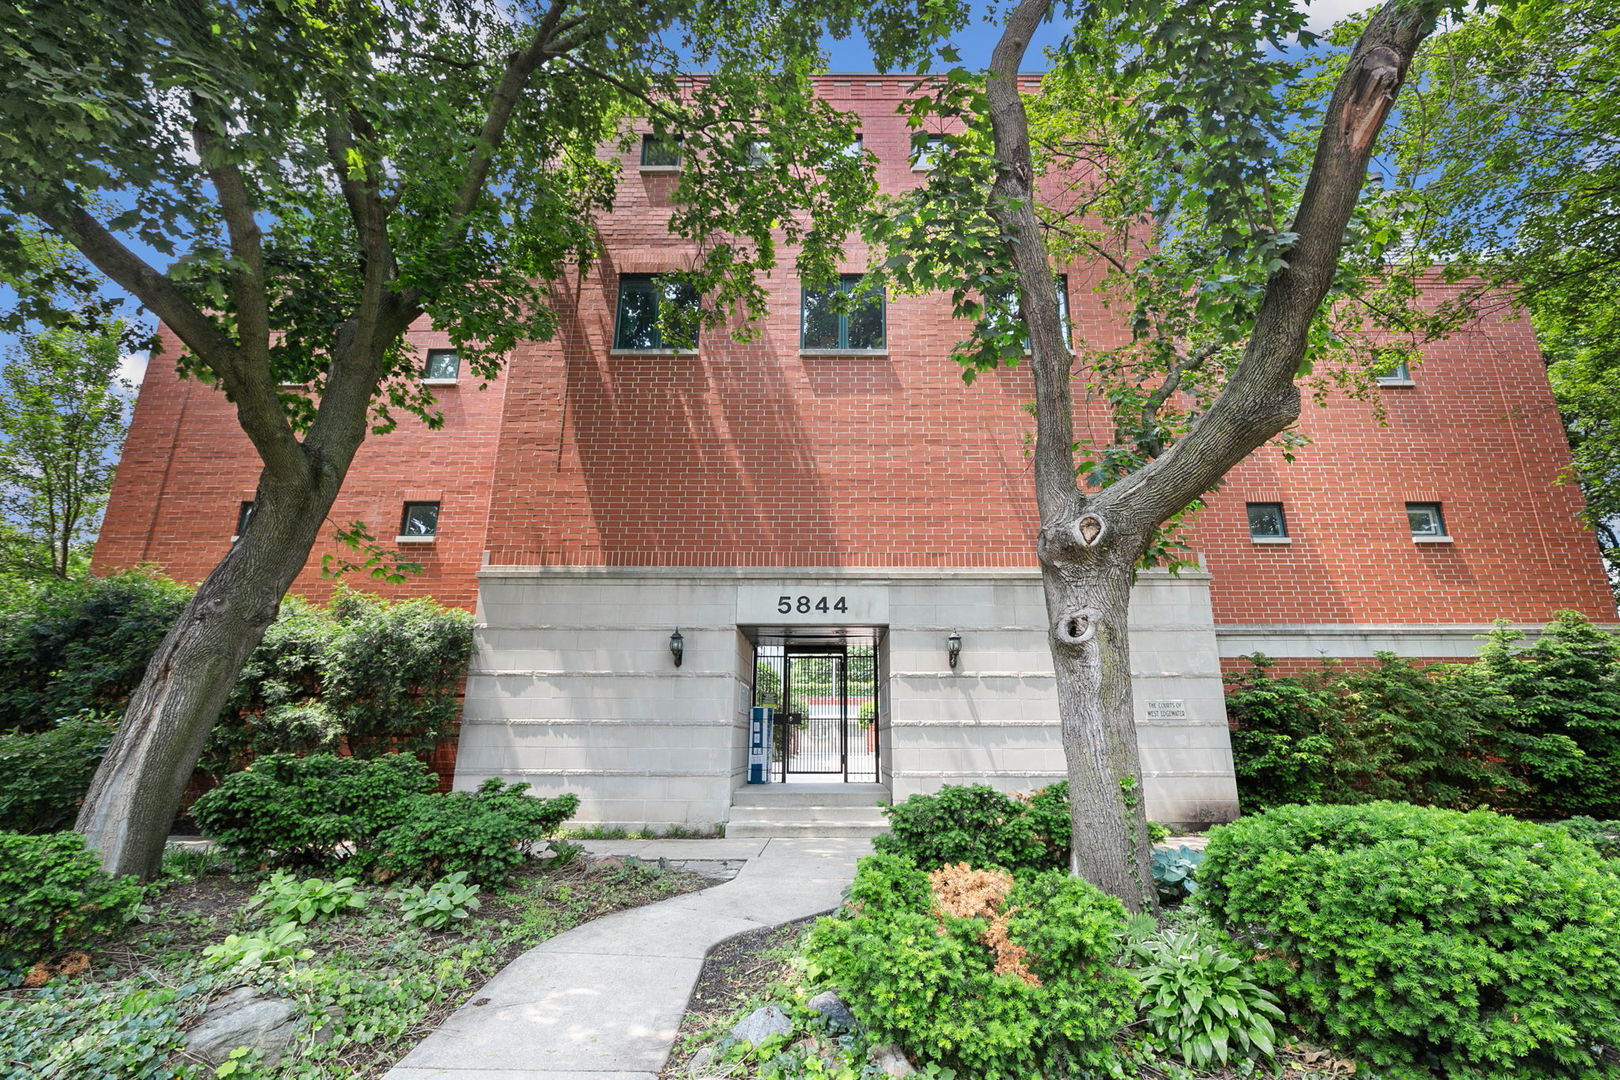
Active under contract
$635,000
3
bds
|
2
ba
|
2,100
sqft
|
built
1998
5844 N Hermitage Ave, Chicago, IL 60660
$-1,942
Cash flow
-16.0%
Cash-on-Cash Return
2.6%
Cap rate
0.6%
Rent to Value Ratio
Active
$299,900
2
bds
|
2
ba
|
1,200
sqft
|
built
1917
1217 W Hood Ave, Chicago, IL 60660
$-350
Cash flow
-6.1%
Cash-on-Cash Return
4.9%
Cap rate
0.8%
Rent to Value Ratio
Active
$350,000
2
bds
|
2
ba
|
1,150
sqft
|
built
2009
1134 W Granville Ave, Chicago, IL 60660
$-1,141
Cash flow
-17.0%
Cash-on-Cash Return
2.4%
Cap rate
0.7%
Rent to Value Ratio
Active
$237,000
1
bds
|
1
ba
|
1,001
sqft
|
built
1969
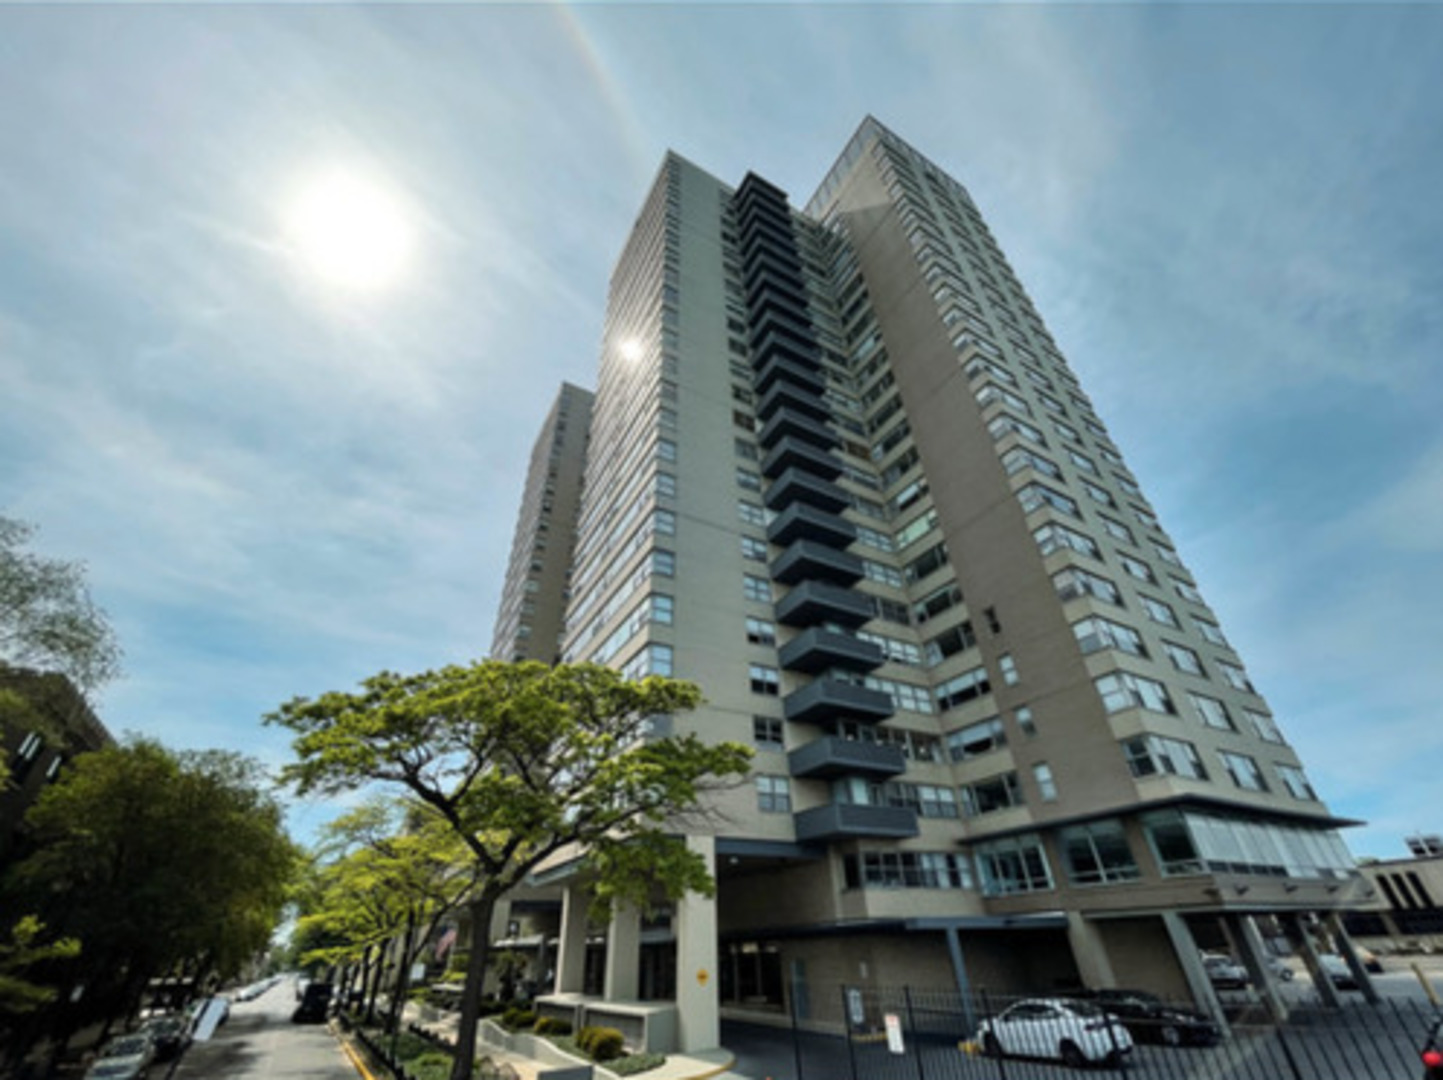
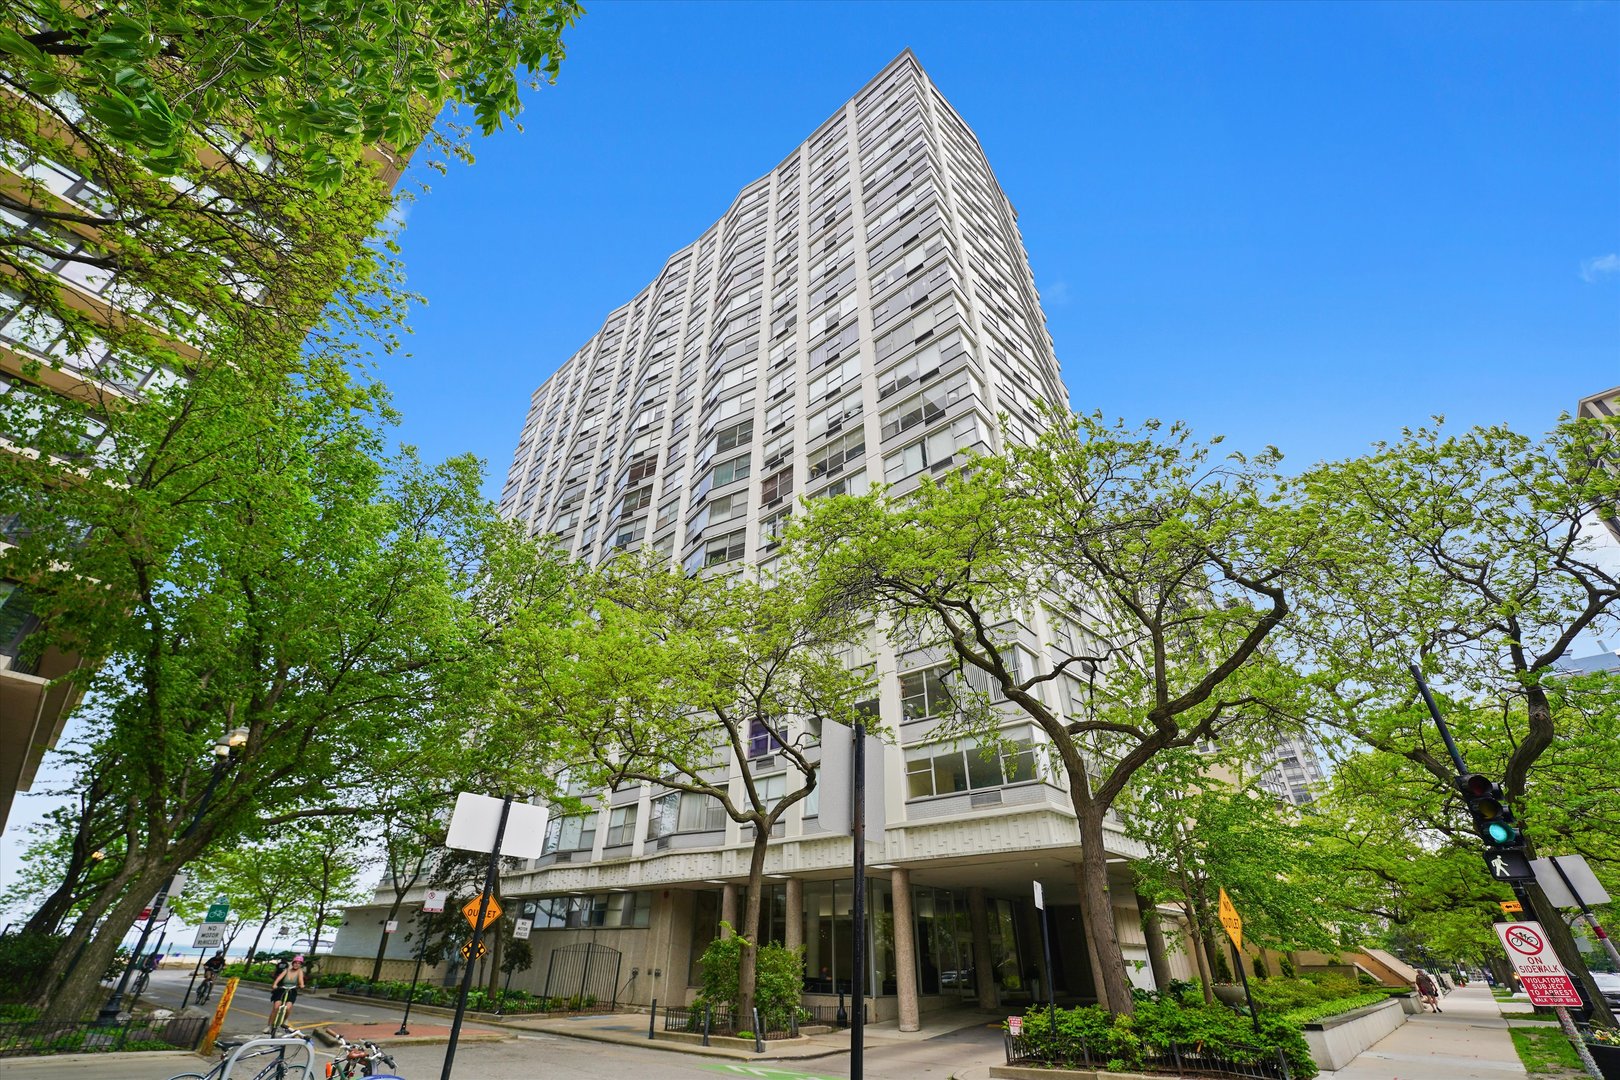
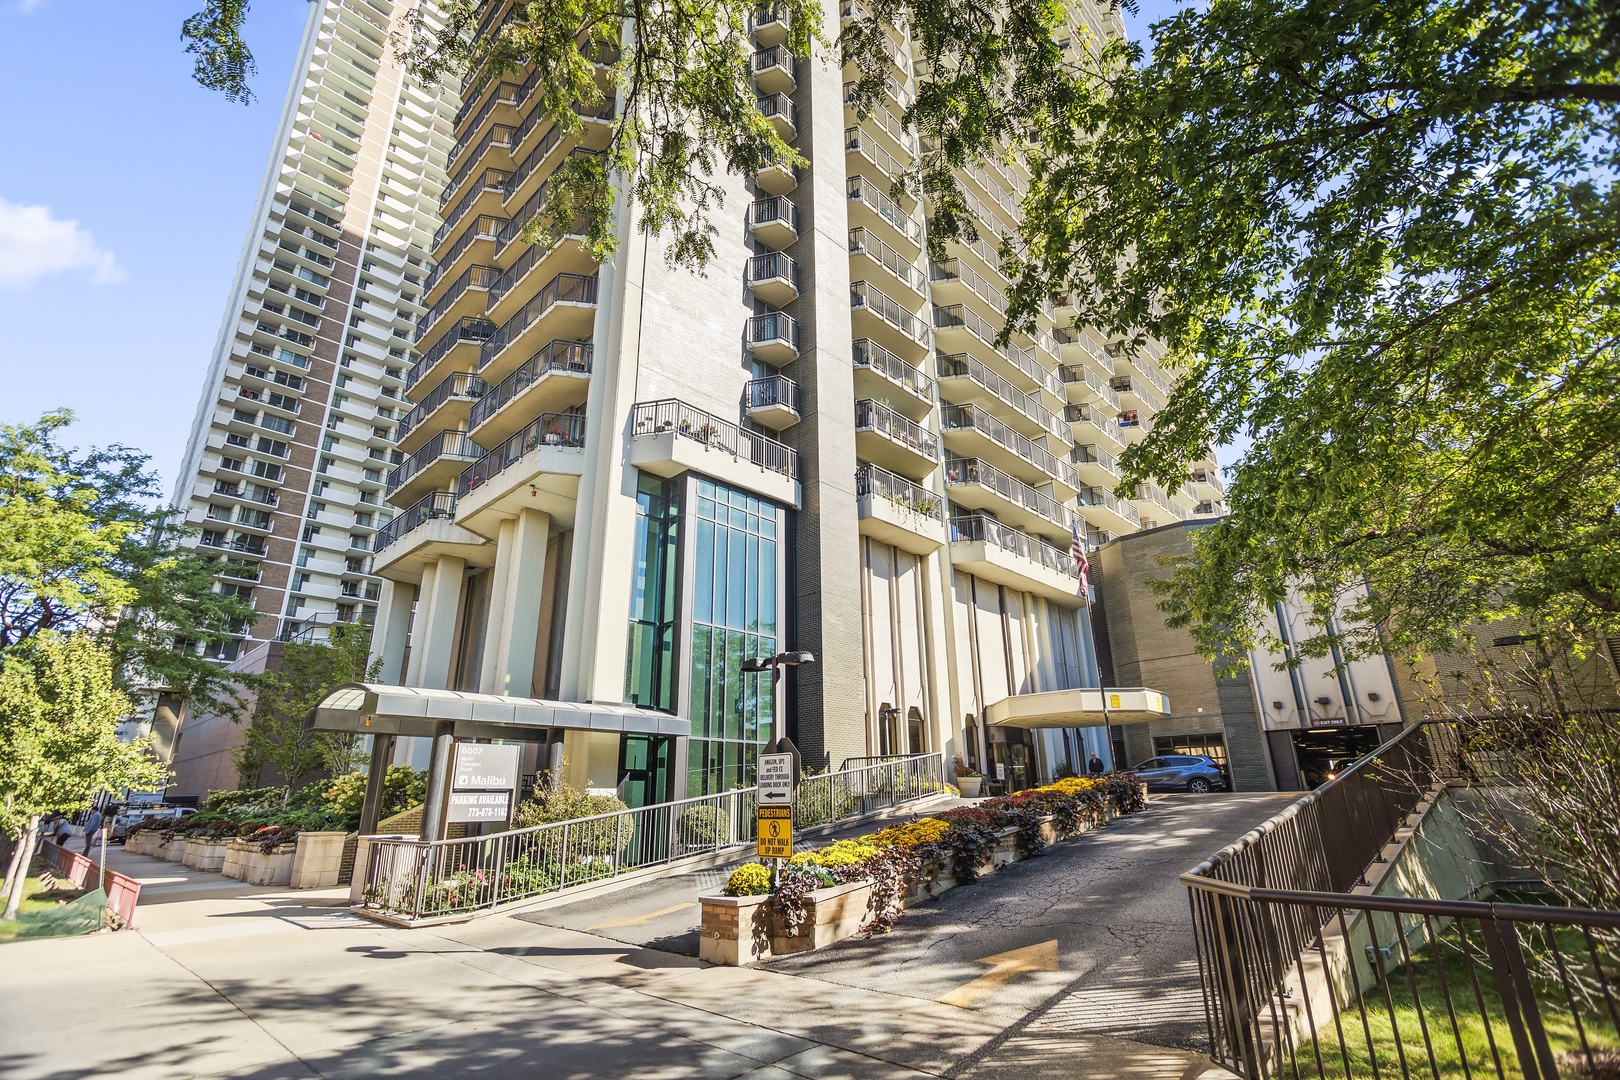
6007 N Sheridan Rd, Chicago, IL 60660
$-828
Cash flow
-18.2%
Cash-on-Cash Return
2.1%
Cap rate
0.8%
Rent to Value Ratio
Active
$270,000
2
bds
|
2
ba
|
1,200
sqft
|
built
1969
6325 N Sheridan Rd, Chicago, IL 60660
$-902
Cash flow
-17.4%
Cash-on-Cash Return
2.3%
Cap rate
1.0%
Rent to Value Ratio
Active
$259,900
2
bds
|
1
ba
|
0
sqft
|
built
1926
1453 W Elmdale Ave, Chicago, IL 60660
$-740
Cash flow
-14.9%
Cash-on-Cash Return
2.9%
Cap rate
0.7%
Rent to Value Ratio
Active
$515,000
3
bds
|
2
ba
|
0
sqft
|
built
1306 W Granville Ave, Chicago, IL 60660
$-1,829
Cash flow
-18.5%
Cash-on-Cash Return
2.0%
Cap rate
0.5%
Rent to Value Ratio
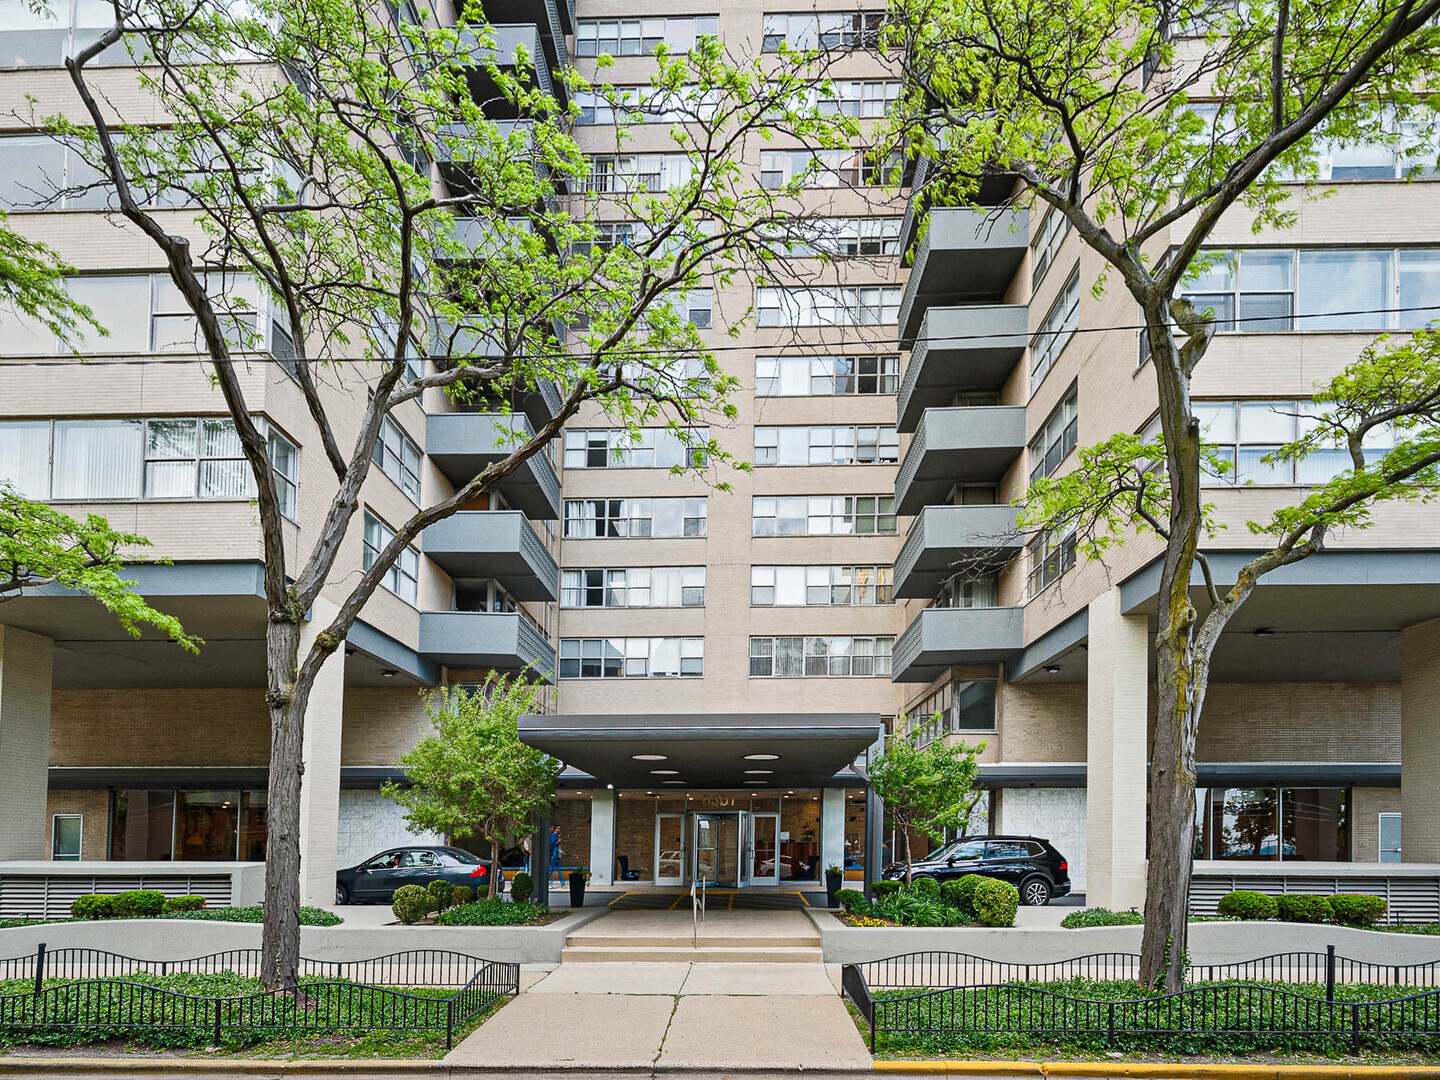
Active
$150,000
1
bds
|
1
ba
|
750
sqft
|
built
1970
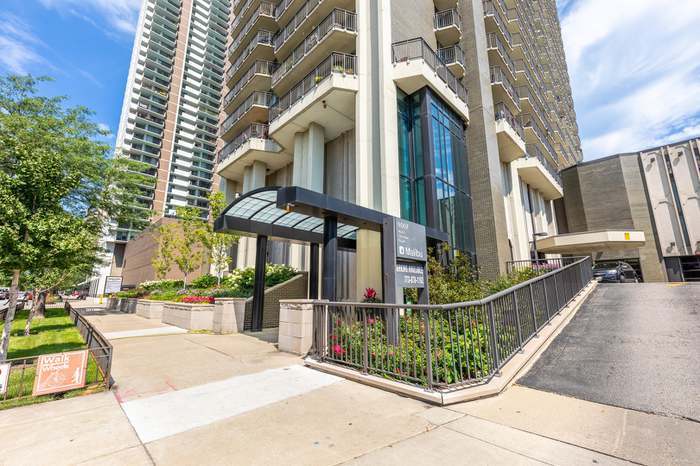
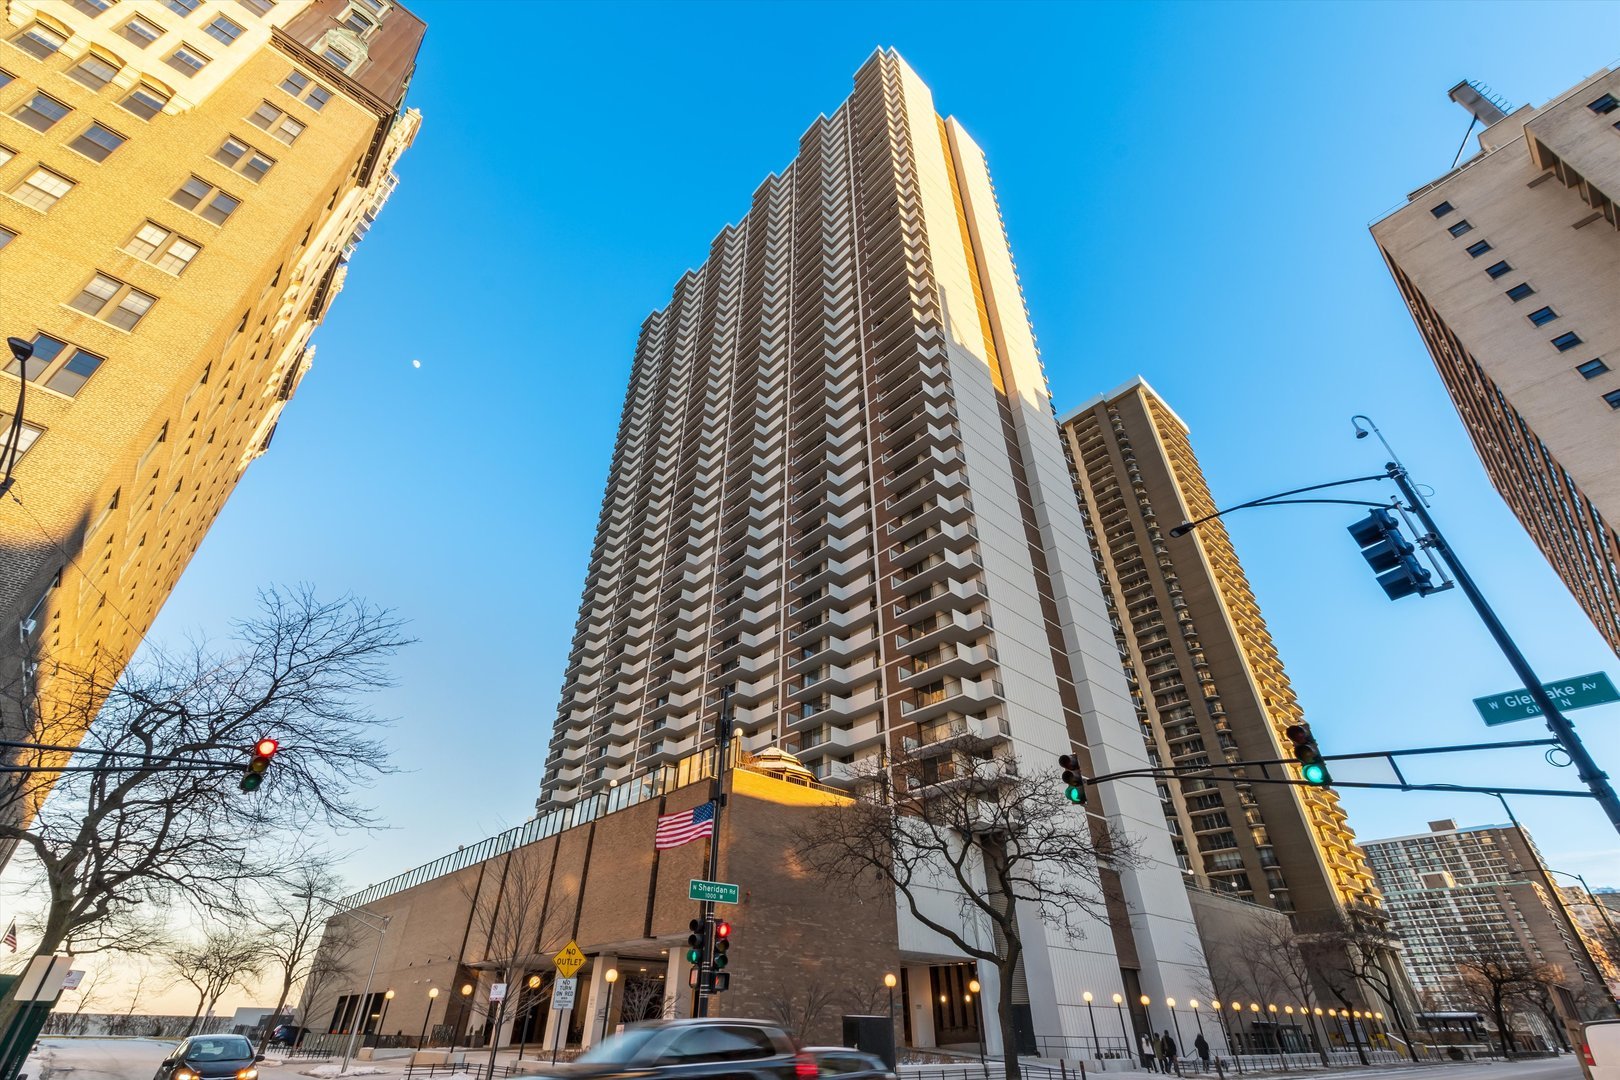
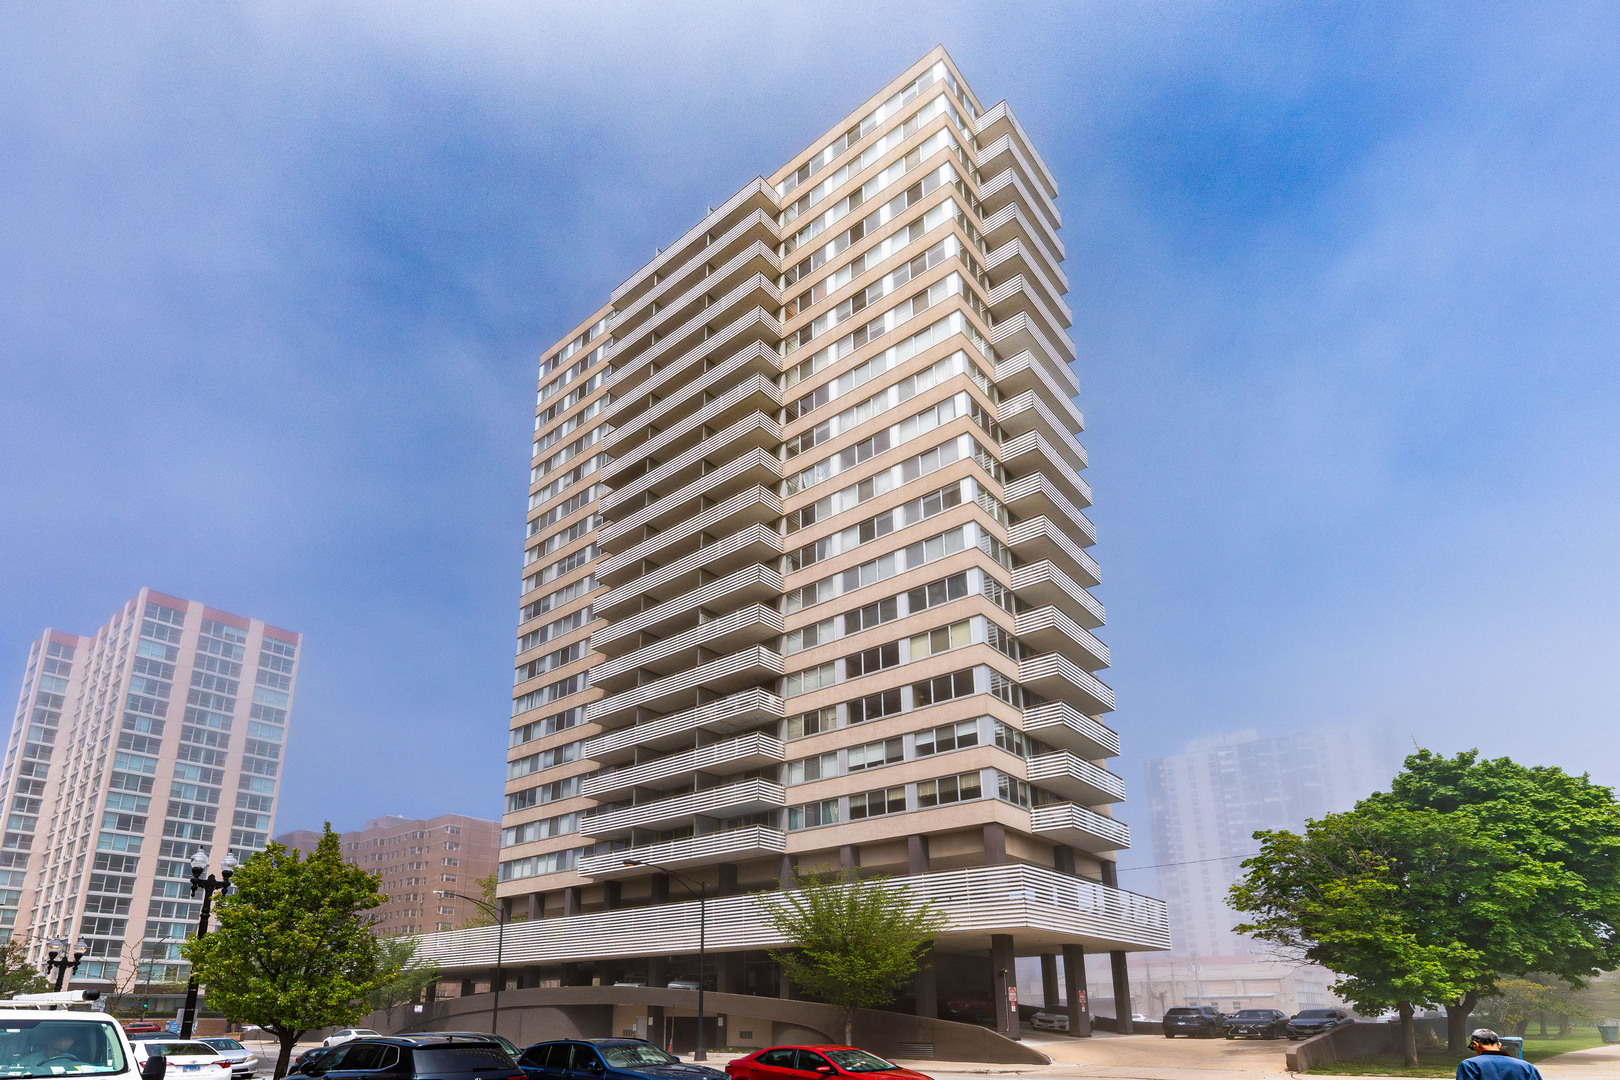
6301 N Sheridan Rd, Chicago, IL 60660
$-451
Cash flow
-15.7%
Cash-on-Cash Return
2.7%
Cap rate
1.3%
Rent to Value Ratio
Active
$325,000
1
bds
|
1
ba
|
1,000
sqft
|
built
1969
6007 N Sheridan Rd, Chicago, IL 60660
$-1,174
Cash flow
-18.8%
Cash-on-Cash Return
1.9%
Cap rate
0.7%
Rent to Value Ratio
Active
$249,900
2
bds
|
2
ba
|
1,250
sqft
|
built
1968
5757 N Sheridan Rd, Chicago, IL 60660
$-1,062
Cash flow
-22.2%
Cash-on-Cash Return
1.2%
Cap rate
1.0%
Rent to Value Ratio
Active
$269,900
1
bds
|
1
ba
|
1,000
sqft
|
built
1967
6007 N Sheridan Rd, Chicago, IL 60660
$-778
Cash flow
-15.0%
Cash-on-Cash Return
2.8%
Cap rate
0.9%
Rent to Value Ratio
Active
$700,000
5
bds
|
3
ba
|
2,600
sqft
|
built
1917
5863 N Kenmore Ave, Chicago, IL 60660
$-3,035
Cash flow
-22.6%
Cash-on-Cash Return
1.1%
Cap rate
0.3%
Rent to Value Ratio
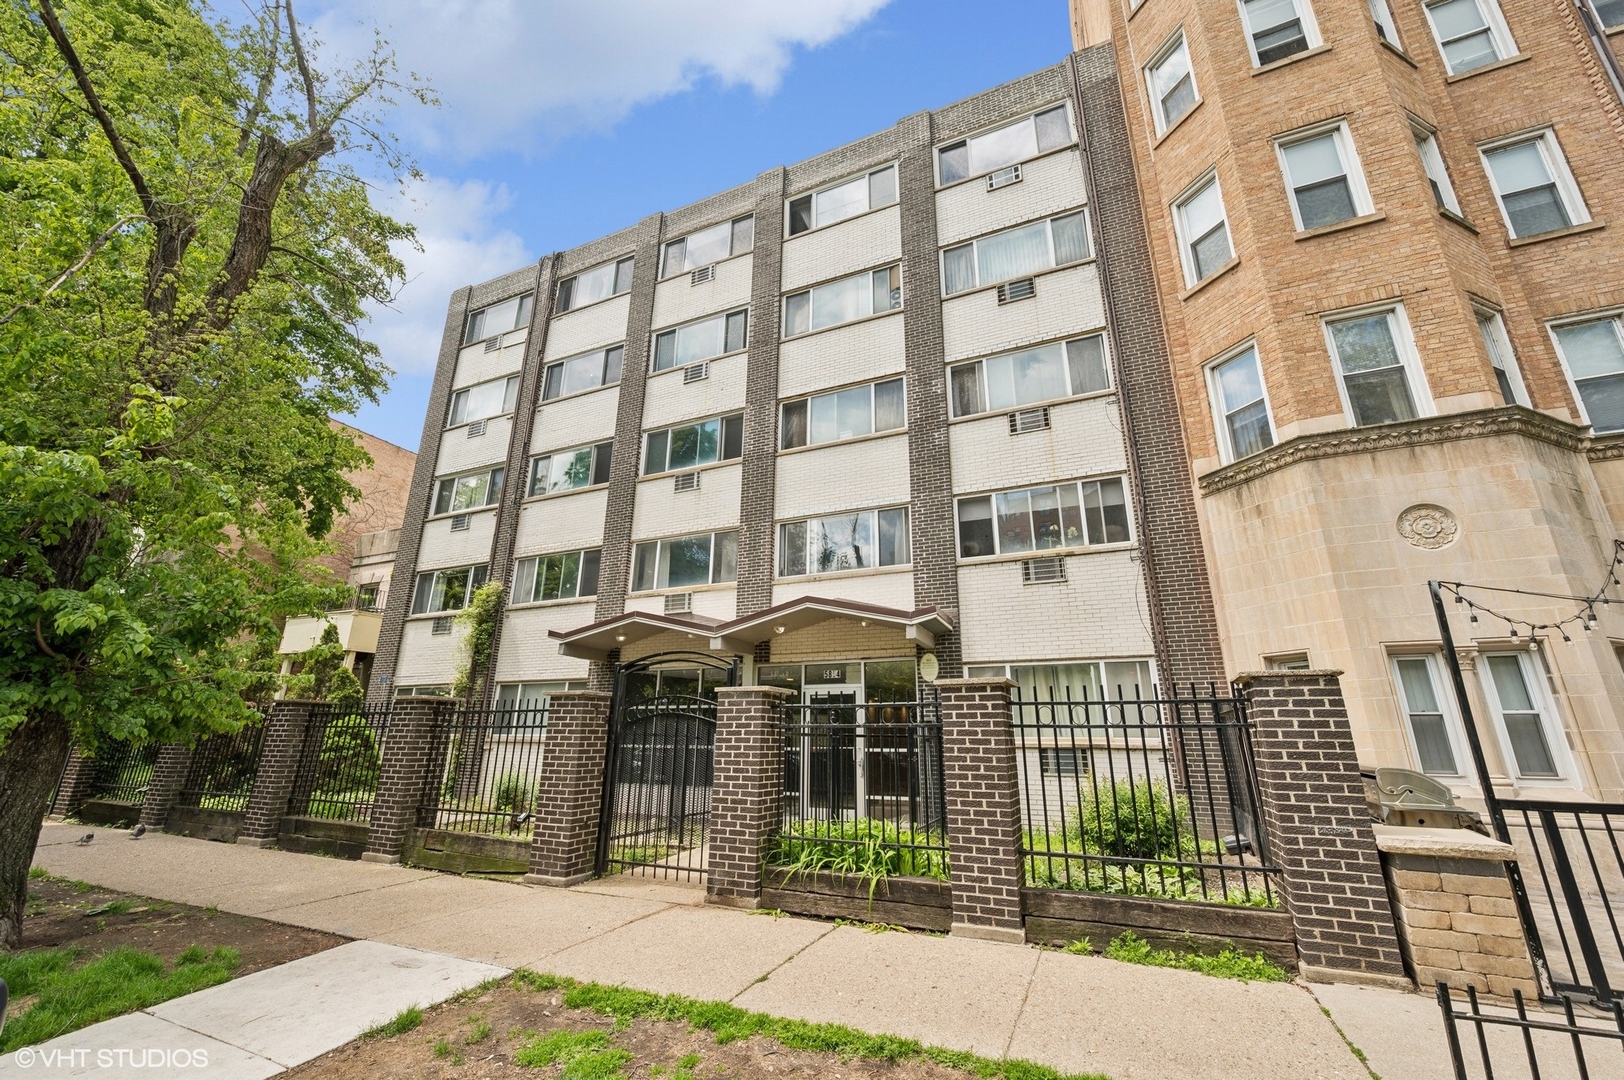
Active
$300,000
2
bds
|
1
ba
|
1,000
sqft
|
built
1915
1359 W Elmdale Ave, Chicago, IL 60660
$-874
Cash flow
-15.2%
Cash-on-Cash Return
2.8%
Cap rate
0.6%
Rent to Value Ratio
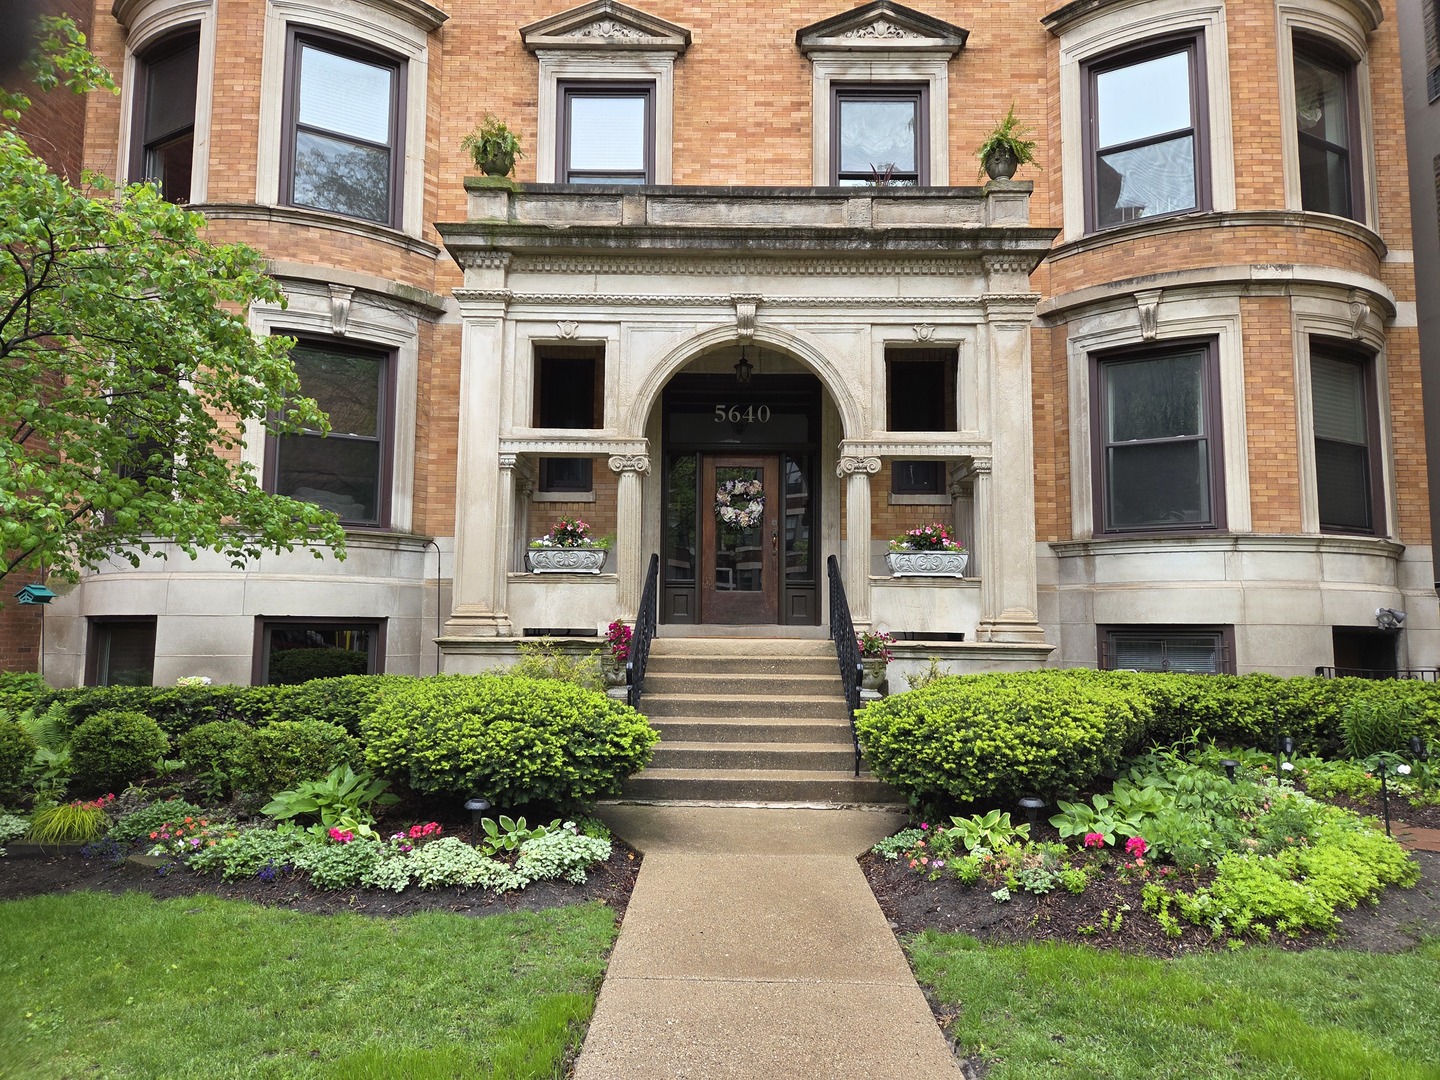
Active
$347,500
3
bds
|
2
ba
|
1,600
sqft
|
built
1920
5640 N Kenmore Ave, Chicago, IL 60660
$-240
Cash flow
-3.6%
Cash-on-Cash Return
5.5%
Cap rate
0.7%
Rent to Value Ratio
Active
$339,900
2
bds
|
1
ba
|
0
sqft
|
built
2008
1134 W Granville Ave, Chicago, IL 60660
$-1,004
Cash flow
-15.4%
Cash-on-Cash Return
2.7%
Cap rate
0.7%
Rent to Value Ratio
Active
$229,000
2
bds
|
2
ba
|
1,250
sqft
|
built
1963
6301 N Sheridan Rd, Chicago, IL 60660
$-1,320
Cash flow
-30.1%
Cash-on-Cash Return
-0.6%
Cap rate
1.0%
Rent to Value Ratio
Active
$388,000
2
bds
|
2
ba
|
1,480
sqft
|
built
1967
6007 N Sheridan Rd, Chicago, IL 60660
$-1,015
Cash flow
-13.6%
Cash-on-Cash Return
3.1%
Cap rate
0.8%
Rent to Value Ratio
Active
$164,900
1
bds
|
1
ba
|
0
sqft
|
built
1963
6301 N Sheridan Rd, Chicago, IL 60660
$-539
Cash flow
-17.1%
Cash-on-Cash Return
2.4%
Cap rate
1.0%
Rent to Value Ratio
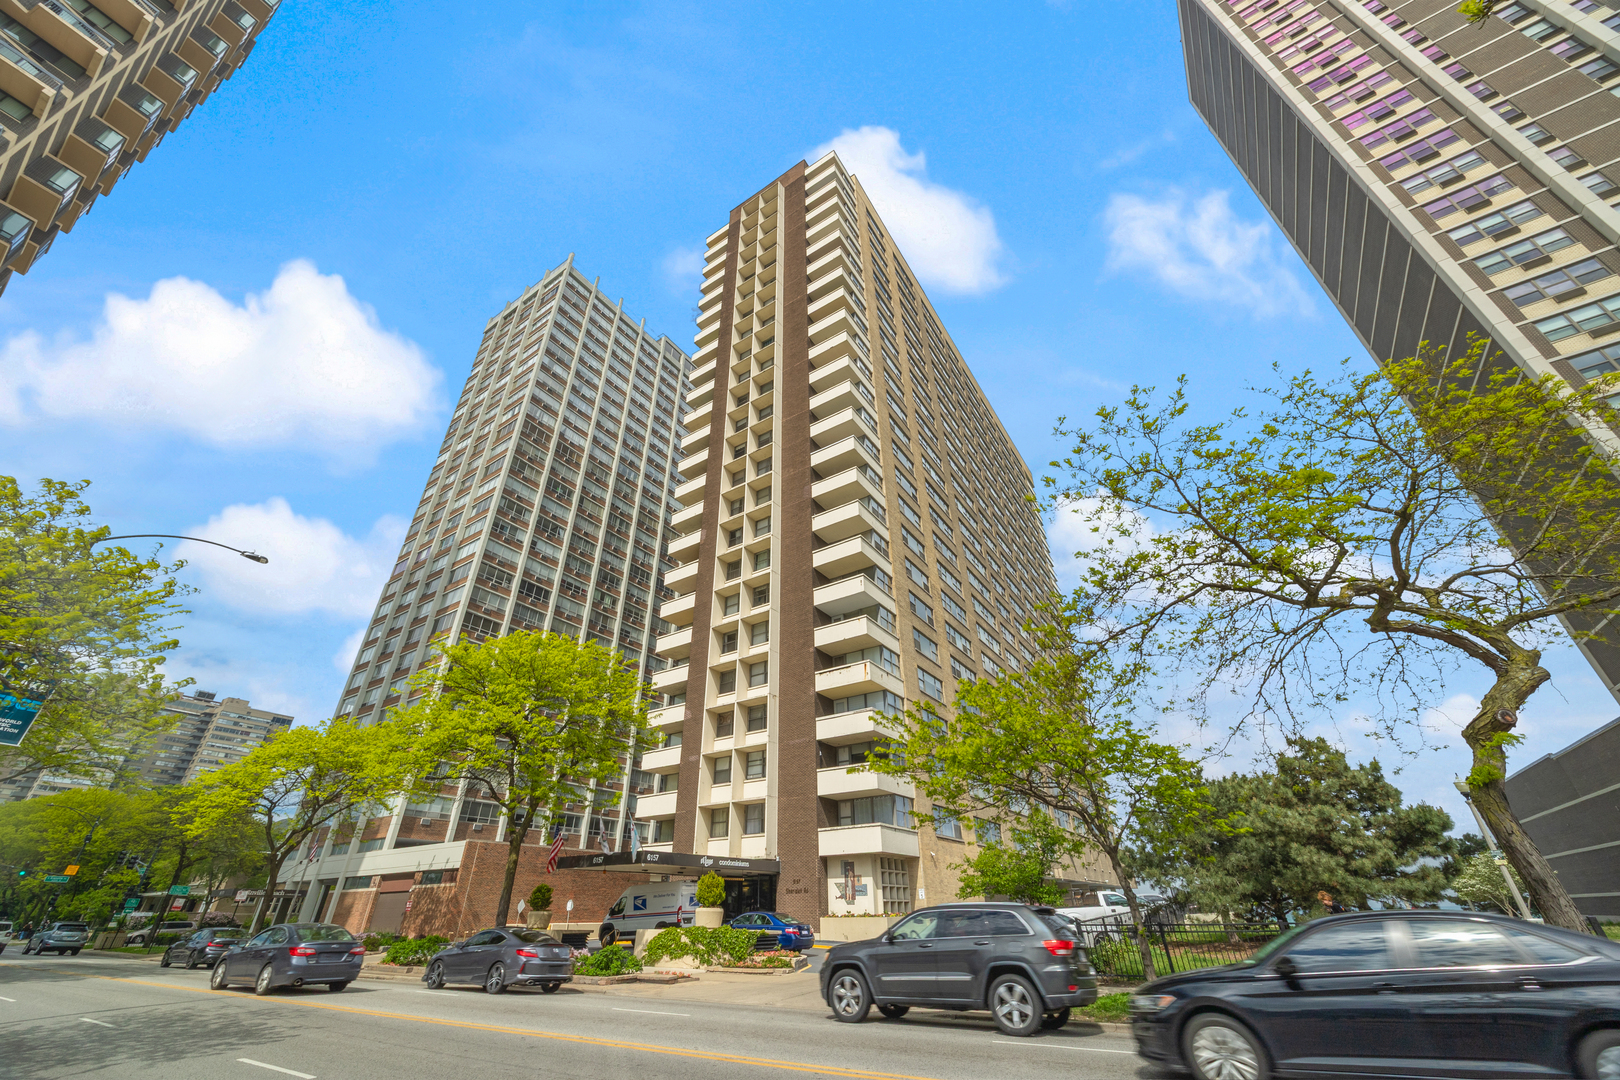
Active
$299,999
2
bds
|
2
ba
|
0
sqft
|
built
1963
6157 N Sheridan Rd, Chicago, IL 60660
$-1,152
Cash flow
-20.0%
Cash-on-Cash Return
1.7%
Cap rate
0.8%
Rent to Value Ratio

Active
$219,000
1
bds
|
1
ba
|
1,000
sqft
|
built
1963
6157 N Sheridan Rd, Chicago, IL 60660
$-698
Cash flow
-16.6%
Cash-on-Cash Return
2.5%
Cap rate
0.9%
Rent to Value Ratio
Active under contract
$225,000
1
bds
|
1
ba
|
900
sqft
|
built
1967
5854 N Kenmore Ave, Chicago, IL 60660
$-514
Cash flow
-11.9%
Cash-on-Cash Return
3.5%
Cap rate
0.8%
Rent to Value Ratio
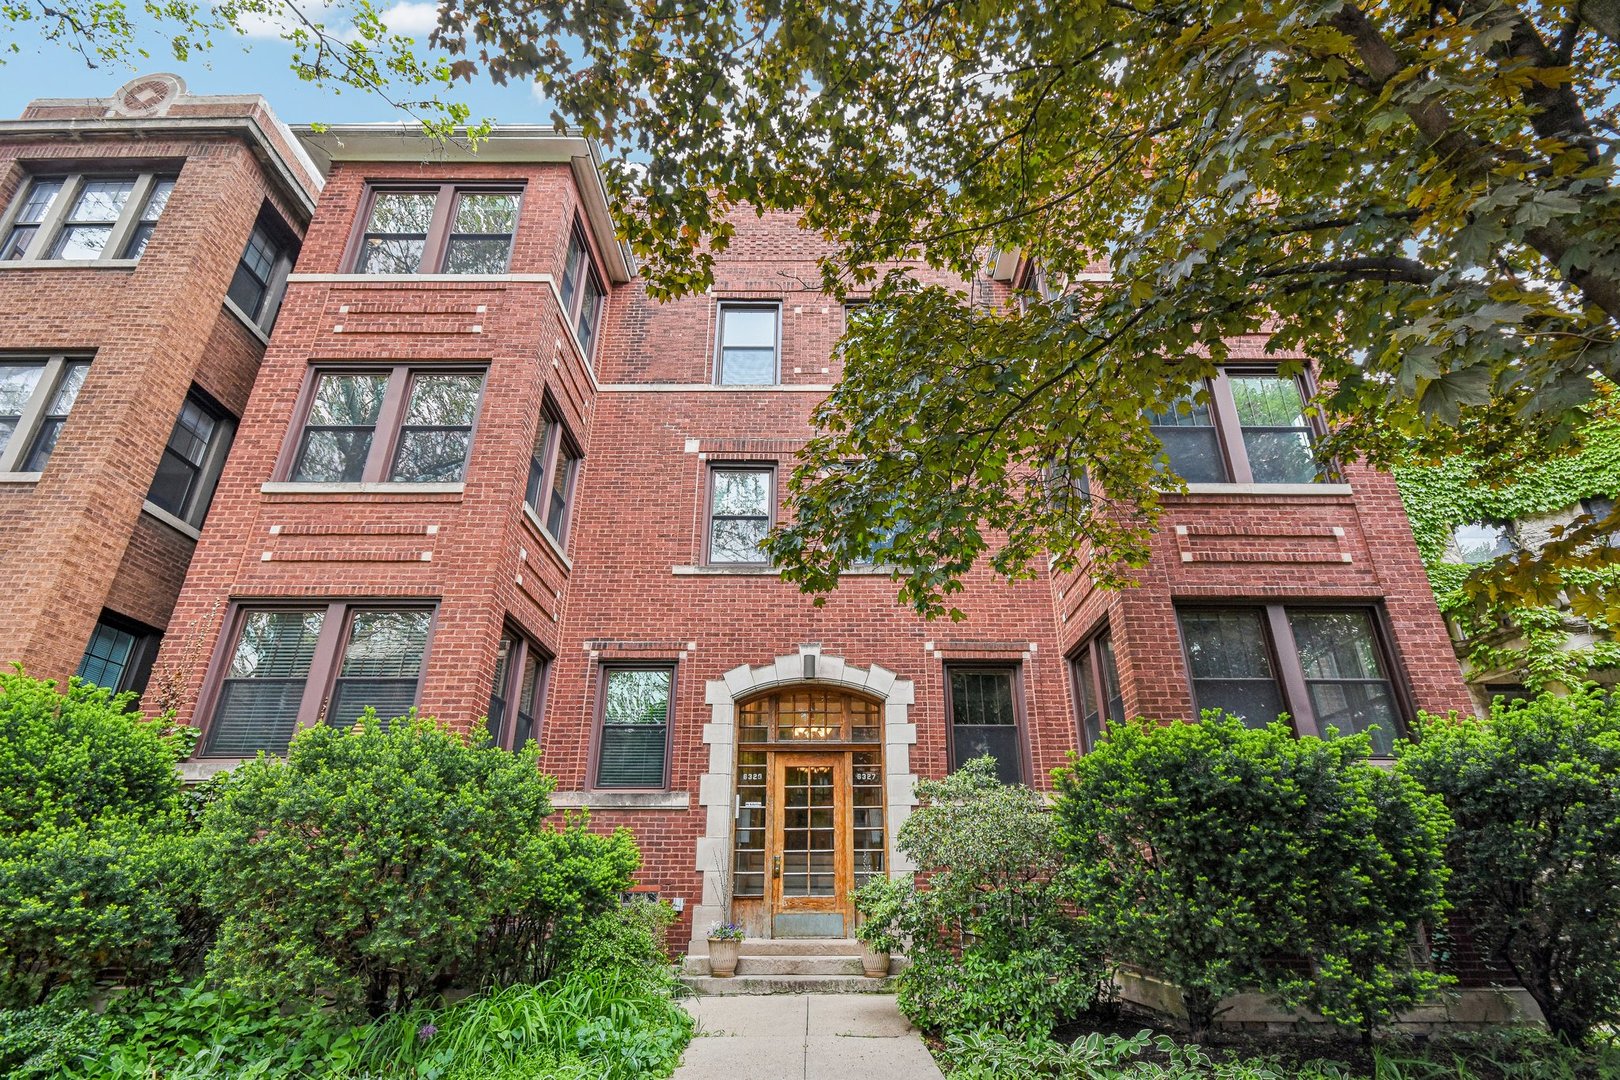
Active under contract
$435,000
3
bds
|
1
ba
|
1,500
sqft
|
built
1925
6329 N Wayne Ave, Chicago, IL 60660
$-1,120
Cash flow
-13.4%
Cash-on-Cash Return
3.2%
Cap rate
0.7%
Rent to Value Ratio
Active under contract
$225,000
2
bds
|
2
ba
|
1,433
sqft
|
built
1972
6033 N Sheridan Rd, Chicago, IL 60660
$-428
Cash flow
-9.9%
Cash-on-Cash Return
4.0%
Cap rate
1.2%
Rent to Value Ratio
Active
$475,000
2
bds
|
2
ba
|
1,350
sqft
|
built
2006
6065 N Ridge Ave, Chicago, IL 60660
$-1,117
Cash flow
-12.3%
Cash-on-Cash Return
3.5%
Cap rate
0.7%
Rent to Value Ratio
Active under contract
$150,000
1
bds
|
1
ba
|
750
sqft
|
built
1970
6301 N Sheridan Rd, Chicago, IL 60660
$-655
Cash flow
-22.8%
Cash-on-Cash Return
1.0%
Cap rate
1.1%
Rent to Value Ratio

Active
$308,000
2
bds
|
1
ba
|
0
sqft
|
built
2008
1134 W Granville Ave, Chicago, IL 60660
$-999
Cash flow
-16.9%
Cash-on-Cash Return
2.4%
Cap rate
0.7%
Rent to Value Ratio
Active
$235,000
2
bds
|
2
ba
|
1,100
sqft
|
built
1963
6301 N Sheridan Rd, Chicago, IL 60660
$-1,264
Cash flow
-28.1%
Cash-on-Cash Return
-0.2%
Cap rate
1.0%
Rent to Value Ratio
Active
$179,000
1
bds
|
1
ba
|
800
sqft
|
built
1960
6301 N Sheridan Rd, Chicago, IL 60660
$-567
Cash flow
-16.5%
Cash-on-Cash Return
2.5%
Cap rate
1.1%
Rent to Value Ratio
Active under contract
$310,000
3
bds
|
3
ba
|
1,200
sqft
|
built
1964
1713 W Thome Ave, Chicago, IL 60660
$-9
Cash flow
-0.2%
Cash-on-Cash Return
6.2%
Cap rate
0.9%
Rent to Value Ratio
Active
$185,000
2
bds
|
1
ba
|
900
sqft
|
built
1957
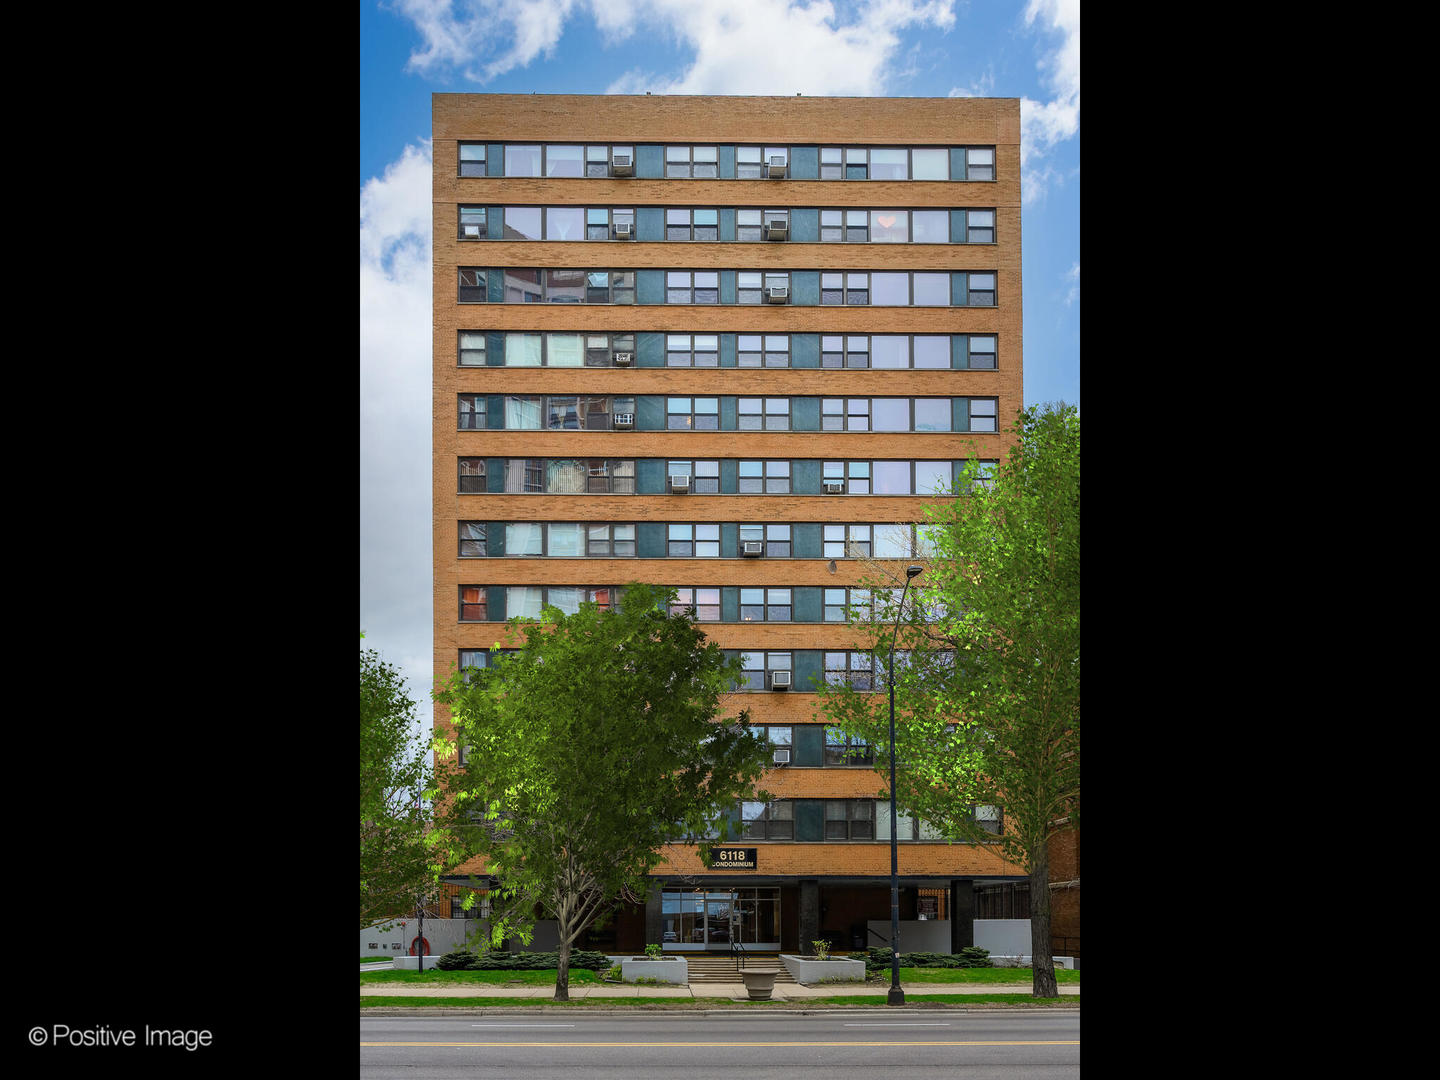
6118 N Sheridan Rd, Chicago, IL 60660
$-504
Cash flow
-14.2%
Cash-on-Cash Return
3.0%
Cap rate
1.2%
Rent to Value Ratio
Active
$144,900
bds
|
1
ba
|
470
sqft
|
built
1970
6171 N Sheridan Rd, Chicago, IL 60660
$58
Cash flow
2.1%
Cash-on-Cash Return
6.8%
Cap rate
1.4%
Rent to Value Ratio
Active
$319,000
2
bds
|
2
ba
|
1,519
sqft
|
built
1974
6033 N Sheridan Rd, Chicago, IL 60660
$-770
Cash flow
-12.6%
Cash-on-Cash Return
3.4%
Cap rate
1.0%
Rent to Value Ratio
Active
$205,000
1
bds
|
1
ba
|
750
sqft
|
built
1988
6102 N Sheridan Rd, Chicago, IL 60660
$-676
Cash flow
-17.2%
Cash-on-Cash Return
2.3%
Cap rate
1.0%
Rent to Value Ratio
Active under contract
$149,900
1
bds
|
1
ba
|
850
sqft
|
built
1963
6301 N Sheridan Rd, Chicago, IL 60660
$-595
Cash flow
-20.7%
Cash-on-Cash Return
1.5%
Cap rate
1.1%
Rent to Value Ratio
Active
$150,000
1
bds
|
1
ba
|
750
sqft
|
built
1951
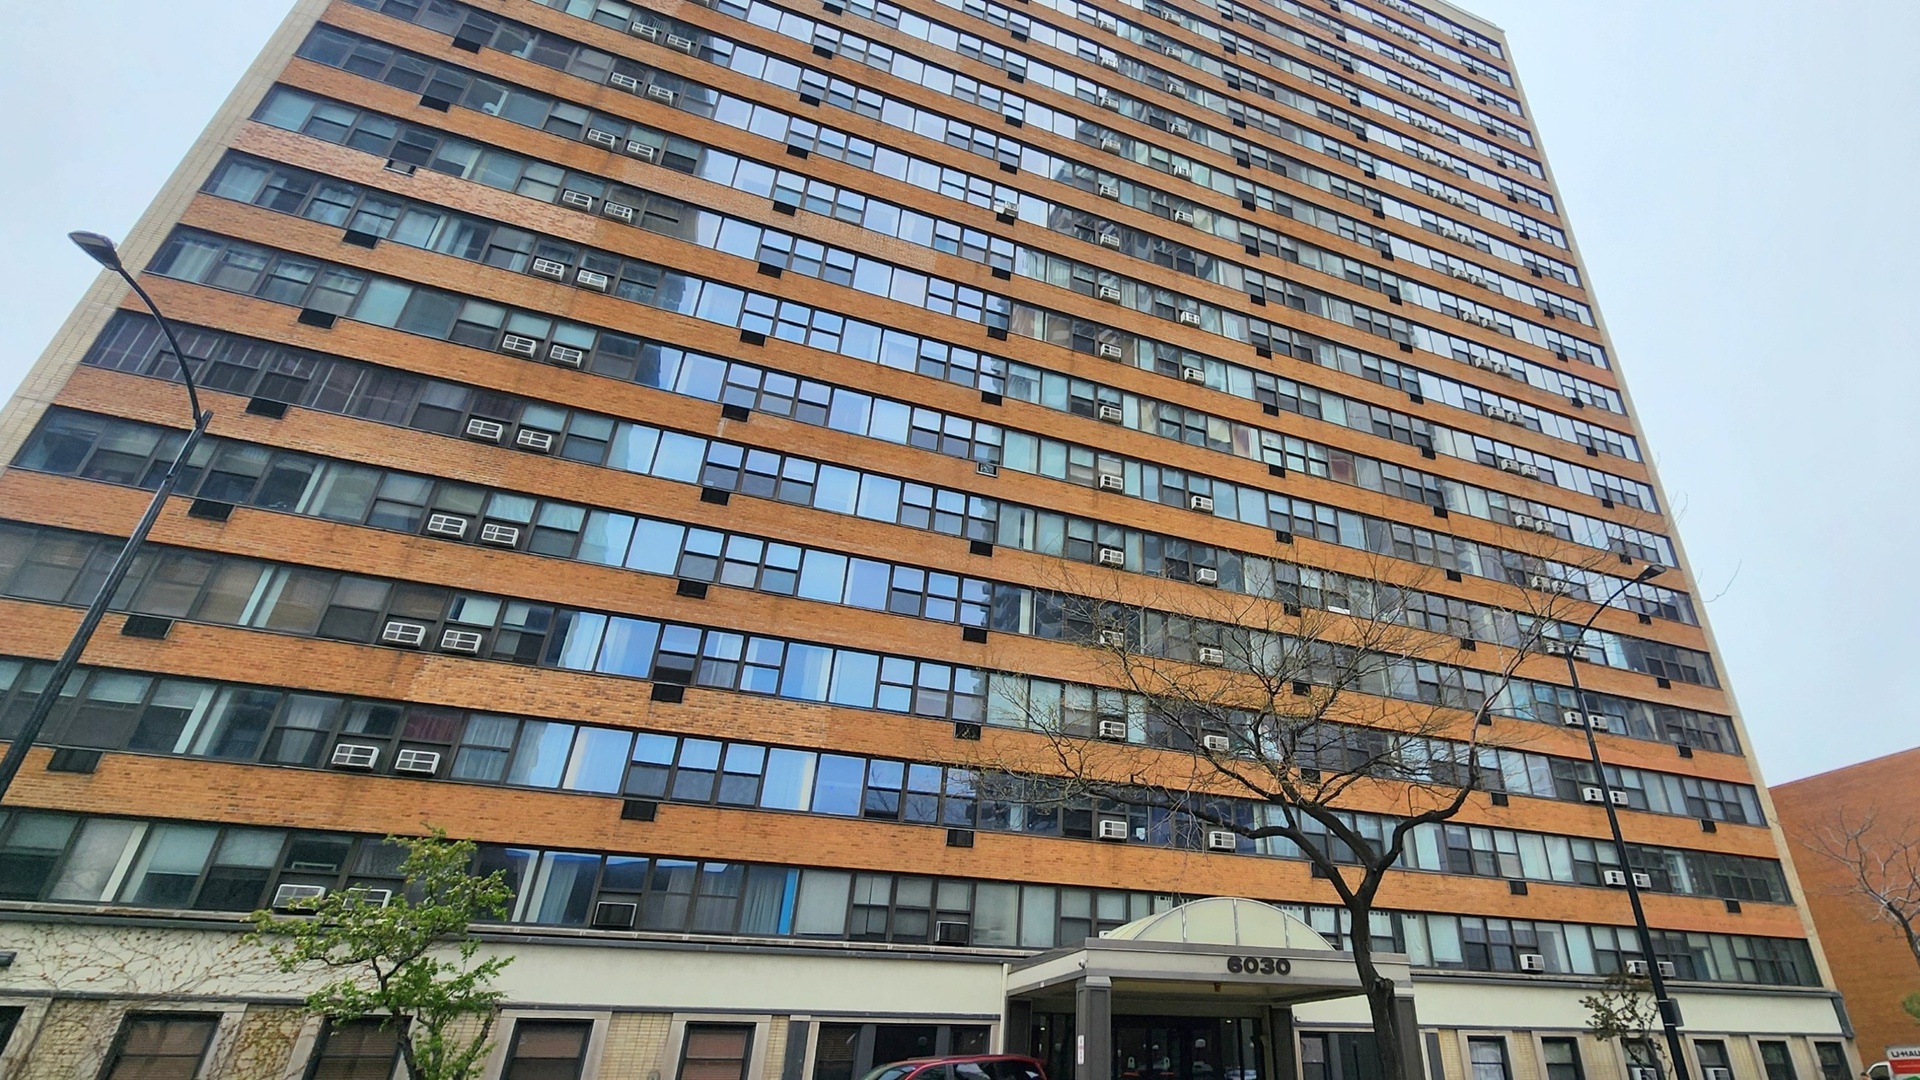
6030 N Sheridan Rd, Chicago, IL 60660
$-200
Cash flow
-7.0%
Cash-on-Cash Return
4.7%
Cap rate
1.2%
Rent to Value Ratio
Active
$129,950
bds
|
1
ba
|
0
sqft
|
built
1966
5601 N Sheridan Rd, Chicago, IL 60660
$-139
Cash flow
-5.6%
Cash-on-Cash Return
5.0%
Cap rate
1.2%
Rent to Value Ratio
Active
$359,000
2
bds
|
2
ba
|
0
sqft
|
built
1969
6007 N Sheridan Rd, Chicago, IL 60660
$-1,095
Cash flow
-15.9%
Cash-on-Cash Return
2.6%
Cap rate
0.8%
Rent to Value Ratio
Active
$179,900
1
bds
|
1
ba
|
900
sqft
|
built
1970
6171 N Sheridan Rd, Chicago, IL 60660
$-700
Cash flow
-20.3%
Cash-on-Cash Return
1.6%
Cap rate
0.9%
Rent to Value Ratio
Active
$174,900
1
bds
|
1
ba
|
720
sqft
|
built
1949
6030 N Sheridan Rd, Chicago, IL 60660
$-440
Cash flow
-13.1%
Cash-on-Cash Return
3.3%
Cap rate
1.0%
Rent to Value Ratio