77072 Investment Properties for Sale
Browse homes for sale and investment properties in 77072. Refine your search by price, property type, or more.
Best cash flowing properties in 77072
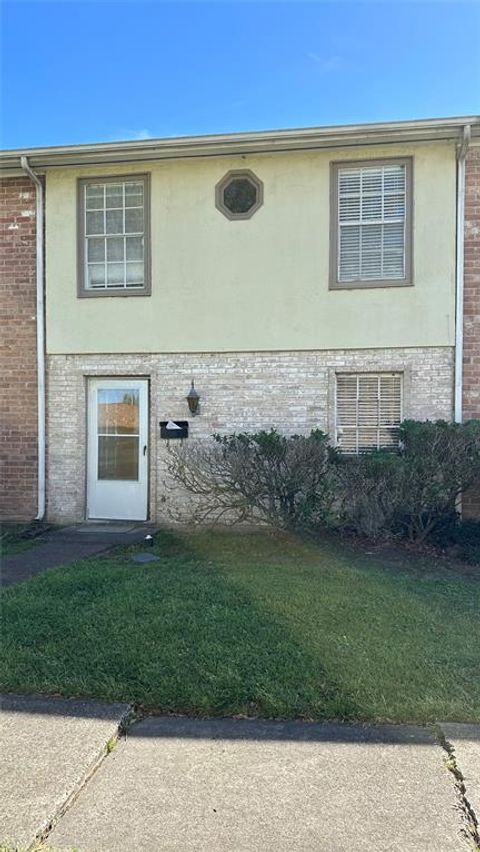
Active
$57,900
2
bds
|
1
ba
|
834
sqft
|
built
1978
8405 Wilcrest Dr, Houston, TX 77072
$371
Cash flow
7.5%
Cash-on-Cash Return
7.7%
Cap rate
1.9%
Rent to Value Ratio
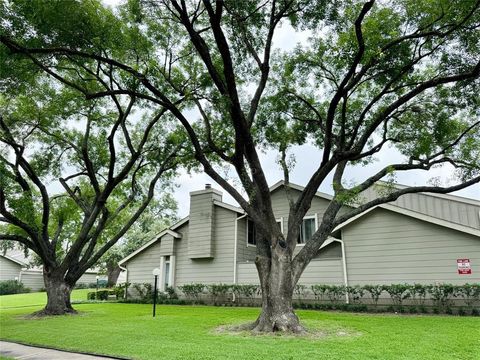
Active
$65,000
2
bds
|
1
ba
|
834
sqft
|
built
1978
8405 Wilcrest Dr, Houston, TX 77072
$259
Cash flow
4.6%
Cash-on-Cash Return
4.8%
Cap rate
1.5%
Rent to Value Ratio
76 out of 84 properties for sale in 77072
Limited Results Shown
Create a free account, or log in to reveal all property listings and enjoy the complete experience.
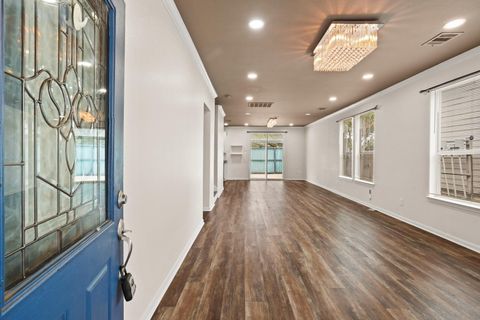
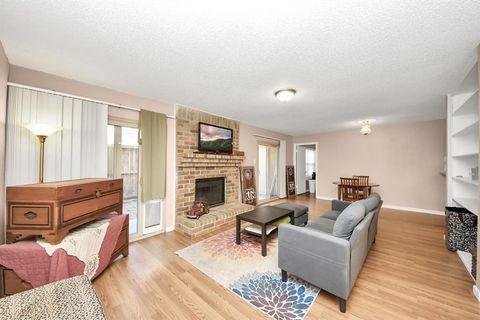
Active
$160,000
2
bds
|
2
ba
|
1,184
sqft
|
built
1970
12046 Beechnut St, Houston, TX 77072
$-281
Cash flow
-9.2%
Cash-on-Cash Return
3.6%
Cap rate
0.6%
Rent to Value Ratio
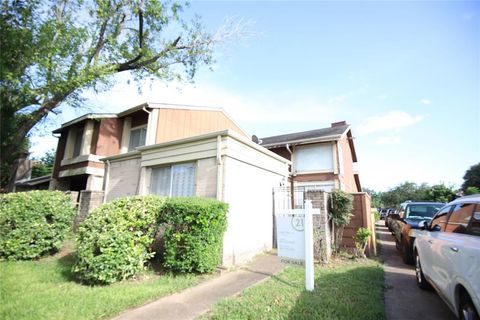
Active
$65,000
2
bds
|
2
ba
|
1,018
sqft
|
built
1978
8405 Wilcrest Dr, Houston, TX 77072
$254
Cash flow
4.6%
Cash-on-Cash Return
4.7%
Cap rate
1.5%
Rent to Value Ratio
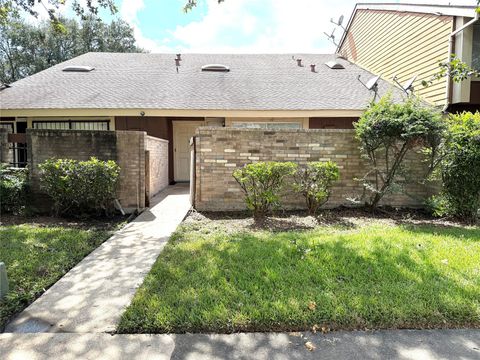
Active
$129,999
2
bds
|
3
ba
|
1,088
sqft
|
built
1969
11547 Beechnut St, Houston, TX 77072
$27
Cash flow
1.1%
Cash-on-Cash Return
5.9%
Cap rate
1.1%
Rent to Value Ratio
Active
$163,900
2
bds
|
2
ba
|
1,251
sqft
|
built
1979
12991 Wirevine Ln, Houston, TX 77072
$-326
Cash flow
-10.4%
Cash-on-Cash Return
3.3%
Cap rate
0.9%
Rent to Value Ratio

Active
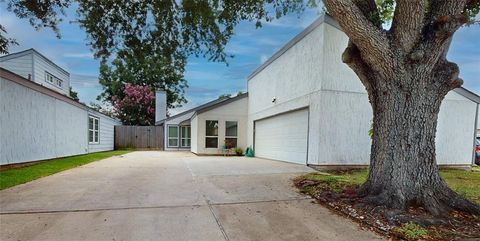
$300,000
3
bds
|
2
ba
|
2,155
sqft
|
built
1980
6130 Briar Terrace Dr, Houston, TX 77072
$-542
Cash flow
-9.4%
Cash-on-Cash Return
3.5%
Cap rate
0.7%
Rent to Value Ratio
Active
$225,000
3
bds
|
3
ba
|
1,812
sqft
|
built
2006
8002 Montague Manor Ln, Houston, TX 77072
$-449
Cash flow
-10.4%
Cash-on-Cash Return
3.3%
Cap rate
0.8%
Rent to Value Ratio

Active
$119,000
2
bds
|
2
ba
|
1,242
sqft
|
built
1977
8494 Dairy View Ln, Houston, TX 77072
$-307
Cash flow
-13.5%
Cash-on-Cash Return
2.6%
Cap rate
1.1%
Rent to Value Ratio
Active
$170,000
3
bds
|
3
ba
|
1,656
sqft
|
built
1977
12581 Wellington Park Dr, Houston, TX 77072
$-180
Cash flow
-5.5%
Cash-on-Cash Return
4.4%
Cap rate
1.0%
Rent to Value Ratio
Active
$225,000
3
bds
|
2
ba
|
1,190
sqft
|
built
1977
11542 Bellerive Dr, Houston, TX 77072
$-221
Cash flow
-5.1%
Cash-on-Cash Return
4.5%
Cap rate
0.8%
Rent to Value Ratio
Active
$194,995
3
bds
|
2
ba
|
1,504
sqft
|
built
1973
7822 Pacific Pearl St, Houston, TX 77072
$-219
Cash flow
-5.9%
Cash-on-Cash Return
4.3%
Cap rate
0.9%
Rent to Value Ratio
Active
$130,000
2
bds
|
2
ba
|
1,089
sqft
|
built
1980
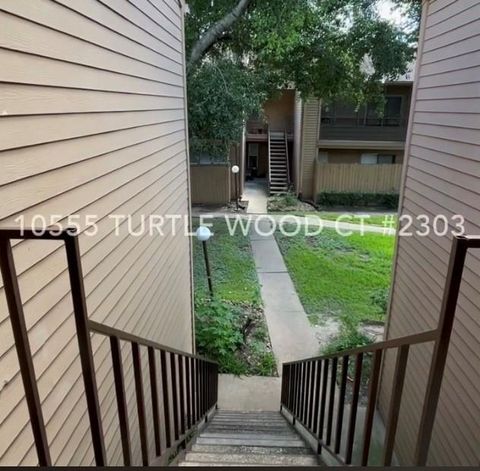
10555 Turtlewood Ct, Houston, TX 77072
$-334
Cash flow
-13.4%
Cash-on-Cash Return
2.6%
Cap rate
1.1%
Rent to Value Ratio

Active
$160,000
2
bds
|
3
ba
|
1,382
sqft
|
built
1977
12682 Newbrook Dr, Houston, TX 77072
$-204
Cash flow
-6.7%
Cash-on-Cash Return
4.1%
Cap rate
1.0%
Rent to Value Ratio
Active
$145,000
2
bds
|
1
ba
|
992
sqft
|
built
1970
7267 Cook Rd, Houston, TX 77072
$-150
Cash flow
-5.4%
Cash-on-Cash Return
4.4%
Cap rate
0.9%
Rent to Value Ratio

Active
$254,999
4
bds
|
3
ba
|
1,537
sqft
|
built
2006
12523 Prosperity River Ct, Houston, TX 77072
$-331
Cash flow
-6.8%
Cash-on-Cash Return
4.1%
Cap rate
0.8%
Rent to Value Ratio
Active
$239,000
3
bds
|
2
ba
|
2,276
sqft
|
built
1979
12210 Cliffgate Dr, Houston, TX 77072
$-215
Cash flow
-4.7%
Cash-on-Cash Return
4.6%
Cap rate
0.8%
Rent to Value Ratio

Active
$185,000
3
bds
|
3
ba
|
1,550
sqft
|
built
1976
12709 Carvel Ln, Houston, TX 77072
$-223
Cash flow
-6.3%
Cash-on-Cash Return
4.2%
Cap rate
1.0%
Rent to Value Ratio

Active
$220,000
3
bds
|
3
ba
|
1,624
sqft
|
built
2005
13047 Lawsons Creek Ln, Houston, TX 77072
$26
Cash flow
0.6%
Cash-on-Cash Return
5.8%
Cap rate
0.8%
Rent to Value Ratio

Active
$160,000
2
bds
|
2
ba
|
1,136
sqft
|
built
1970
7237 Cook Rd, Houston, TX 77072
$-285
Cash flow
-9.3%
Cash-on-Cash Return
3.5%
Cap rate
0.9%
Rent to Value Ratio
Active
$215,000
3
bds
|
3
ba
|
1,532
sqft
|
built
2007
13122 Stratford Skies Ln, Houston, TX 77072
$-367
Cash flow
-8.9%
Cash-on-Cash Return
3.6%
Cap rate
0.8%
Rent to Value Ratio
Active
$99,000
1
bds
|
1
ba
|
760
sqft
|
built
1980
10555 Turtlewood Ct, Houston, TX 77072
$-198
Cash flow
-10.4%
Cash-on-Cash Return
3.3%
Cap rate
1.1%
Rent to Value Ratio
Active
$255,000
3
bds
|
2
ba
|
2,119
sqft
|
built
1980
6230 Grandvale Dr, Houston, TX 77072
$-360
Cash flow
-7.4%
Cash-on-Cash Return
4.0%
Cap rate
0.8%
Rent to Value Ratio
Active
$61,000
2
bds
|
2
ba
|
1,018
sqft
|
built
1978
8405 Wilcrest Dr, Houston, TX 77072
$252
Cash flow
4.8%
Cash-on-Cash Return
5.0%
Cap rate
1.6%
Rent to Value Ratio

Active
$229,900
3
bds
|
2
ba
|
1,702
sqft
|
built
1977
4111 Wildacres Dr, Houston, TX 77072
$-328
Cash flow
-7.4%
Cash-on-Cash Return
4.0%
Cap rate
0.7%
Rent to Value Ratio
Active
$238,000
3
bds
|
2
ba
|
1,526
sqft
|
built
1982
4223 Amir St, Houston, TX 77072
$-273
Cash flow
-6.0%
Cash-on-Cash Return
4.3%
Cap rate
0.8%
Rent to Value Ratio
Active
$350,000
3
bds
|
2
ba
|
1,461
sqft
|
built
2006
6633 W Sam Houston Pkwy S, Houston, TX 77072
$-1,327
Cash flow
-19.8%
Cash-on-Cash Return
1.1%
Cap rate
0.5%
Rent to Value Ratio
Active
$165,900
2
bds
|
2
ba
|
1,251
sqft
|
built
1979
7111 Brendam Ln, Houston, TX 77072
$-42
Cash flow
-1.3%
Cash-on-Cash Return
5.4%
Cap rate
0.9%
Rent to Value Ratio

Active
$225,000
3
bds
|
2
ba
|
1,526
sqft
|
built
1982
4155 Amir St, Houston, TX 77072
$-134
Cash flow
-3.1%
Cash-on-Cash Return
5.0%
Cap rate
0.8%
Rent to Value Ratio
Active
$270,000
3
bds
|
2
ba
|
1,580
sqft
|
built
1968
11427 Newbrook Dr, Houston, TX 77072
$-711
Cash flow
-13.7%
Cash-on-Cash Return
2.5%
Cap rate
0.6%
Rent to Value Ratio

Active
$240,000
3
bds
|
3
ba
|
1,642
sqft
|
built
1968
11502 Leader St, Houston, TX 77072
$-210
Cash flow
-4.6%
Cash-on-Cash Return
4.6%
Cap rate
0.8%
Rent to Value Ratio

Active
$104,900
3
bds
|
3
ba
|
1,292
sqft
|
built
1978
8405 Wilcrest Dr, Houston, TX 77072
$-187
Cash flow
-9.3%
Cash-on-Cash Return
3.5%
Cap rate
1.1%
Rent to Value Ratio
Active
$120,000
2
bds
|
2
ba
|
946
sqft
|
built
1980
10555 Turtlewood Ct, Houston, TX 77072
$-125
Cash flow
-5.4%
Cash-on-Cash Return
4.4%
Cap rate
1.2%
Rent to Value Ratio
Active
$300,000
5
bds
|
3
ba
|
2,007
sqft
|
built
1972
6115 Westbranch Dr, Houston, TX 77072
$-183
Cash flow
-3.2%
Cash-on-Cash Return
4.9%
Cap rate
0.8%
Rent to Value Ratio
Active
$210,000
3
bds
|
2
ba
|
1,475
sqft
|
built
1978
4202 Boone Rd, Houston, TX 77072
$-122
Cash flow
-3.0%
Cash-on-Cash Return
5.0%
Cap rate
0.9%
Rent to Value Ratio
Active
$270,000
3
bds
|
3
ba
|
1,857
sqft
|
built
1978
11027 Oakcenter Dr, Houston, TX 77072
$-554
Cash flow
-10.7%
Cash-on-Cash Return
3.2%
Cap rate
0.7%
Rent to Value Ratio
Active
$130,000
2
bds
|
2
ba
|
0
sqft
|
built
1977
12606 Newbrook Dr, Houston, TX 77072
$-126
Cash flow
-5.1%
Cash-on-Cash Return
4.5%
Cap rate
1.1%
Rent to Value Ratio
Active
$145,000
2
bds
|
2
ba
|
946
sqft
|
built
1981
10555 Turtlewood Ct, Houston, TX 77072
$-291
Cash flow
-10.5%
Cash-on-Cash Return
3.3%
Cap rate
1.0%
Rent to Value Ratio
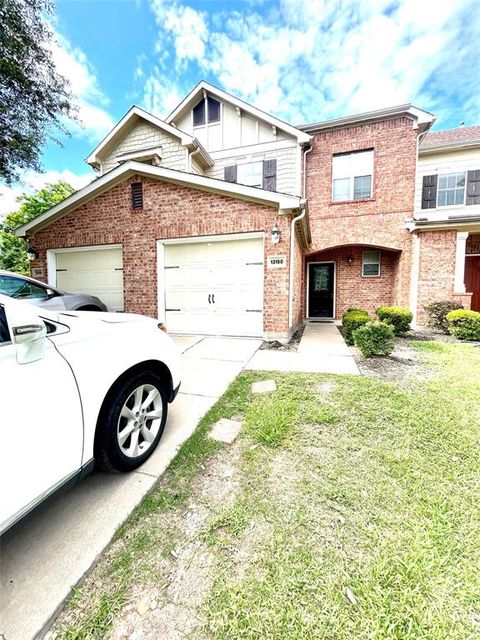
Active
$205,000
3
bds
|
3
ba
|
1,551
sqft
|
built
2007
13150 Lawsons Creek Ln, Houston, TX 77072
$-317
Cash flow
-8.1%
Cash-on-Cash Return
3.8%
Cap rate
0.9%
Rent to Value Ratio
Active
$245,000
3
bds
|
2
ba
|
1,350
sqft
|
built
1973
6223 Weststar Ln, Houston, TX 77072
$-313
Cash flow
-6.7%
Cash-on-Cash Return
4.1%
Cap rate
0.7%
Rent to Value Ratio