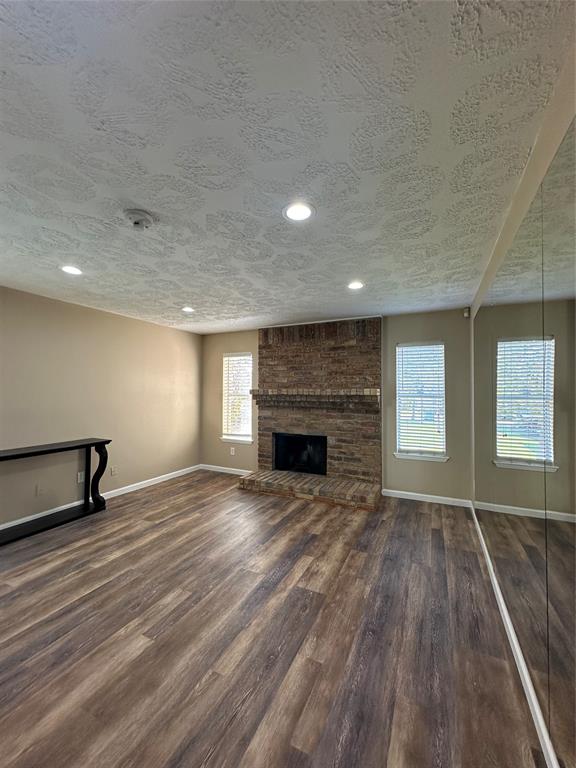
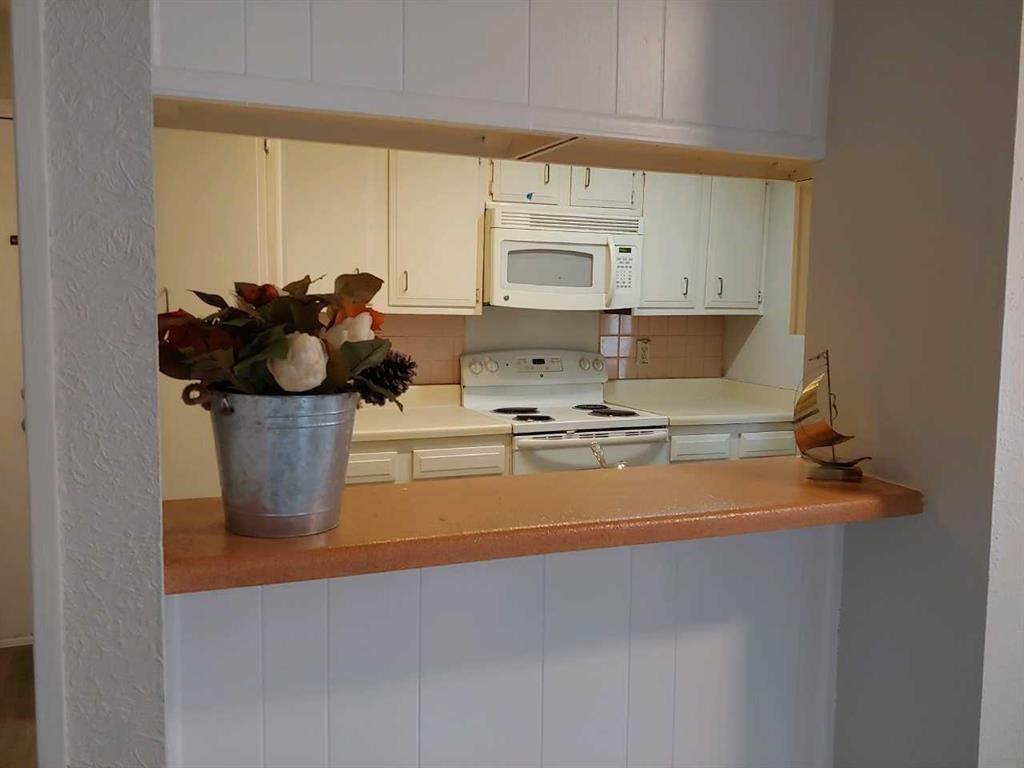
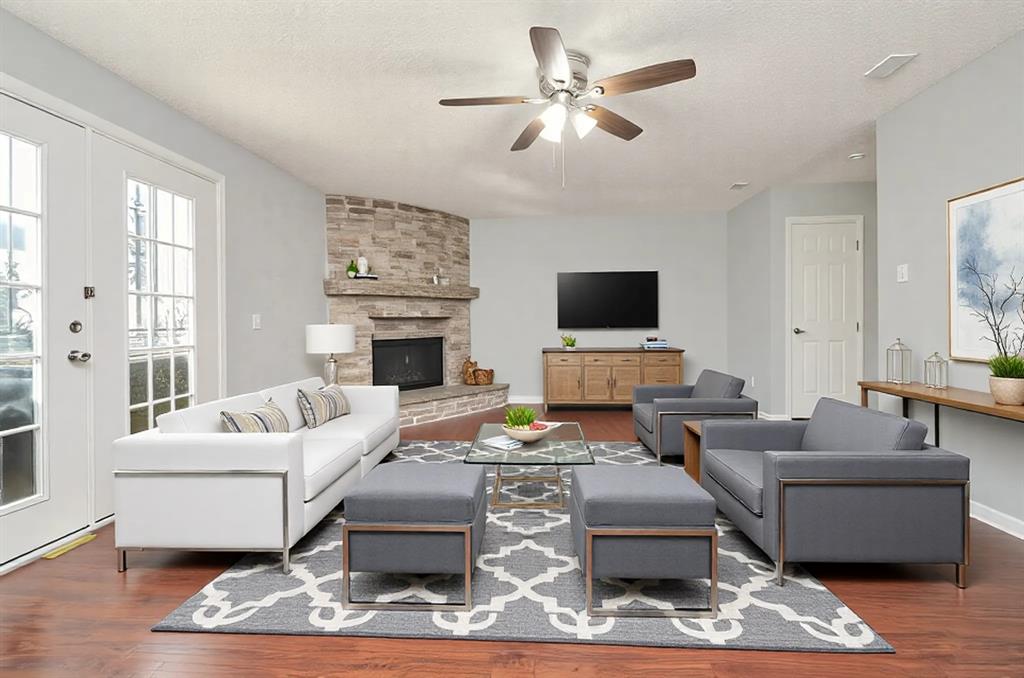
77072 Investment Properties for Sale
Browse homes for sale and investment properties in 77072. Refine your search by price, property type, or more.
Best cash flowing properties in 77072
Active
$59,000
2
bds
|
0
ba
|
0
sqft
|
built
1978
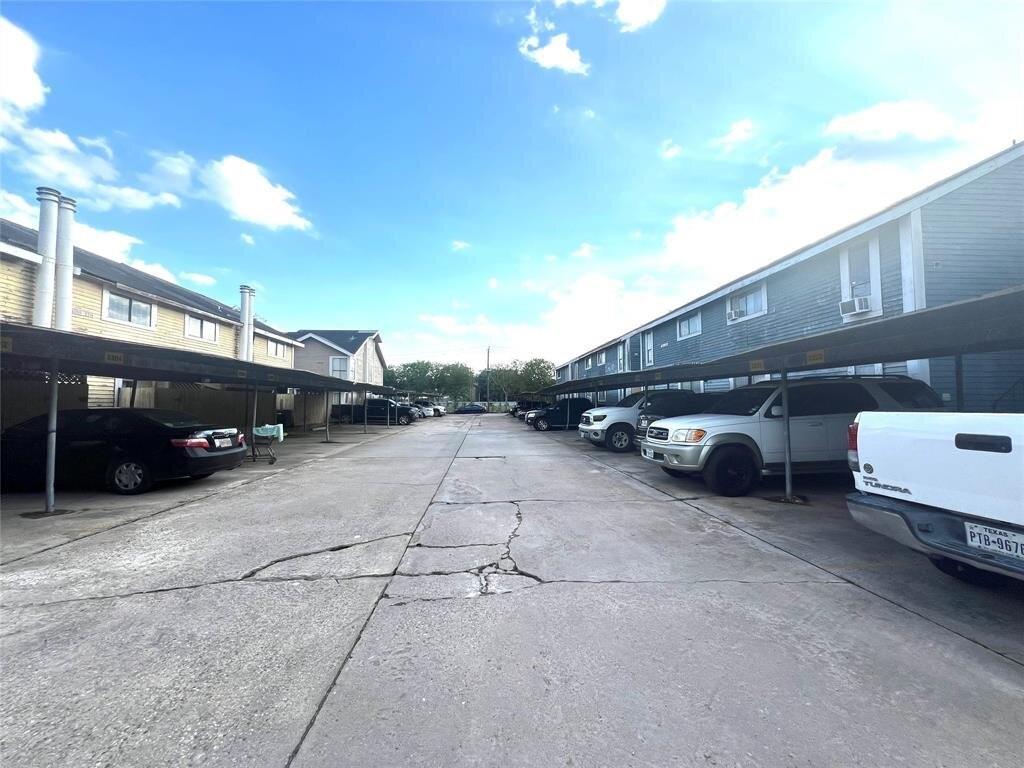
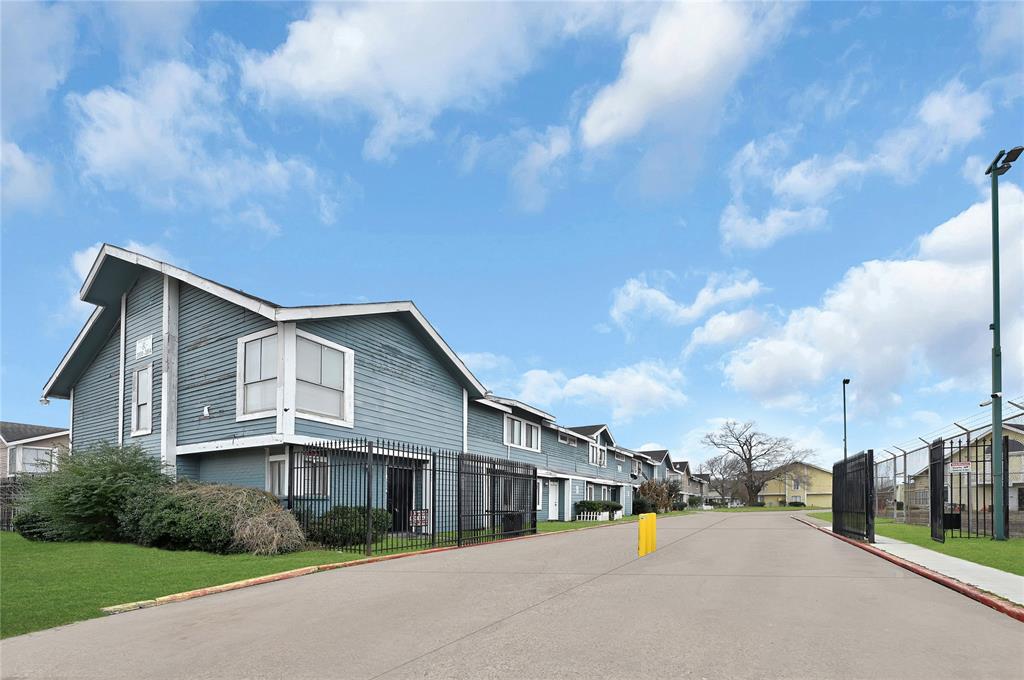
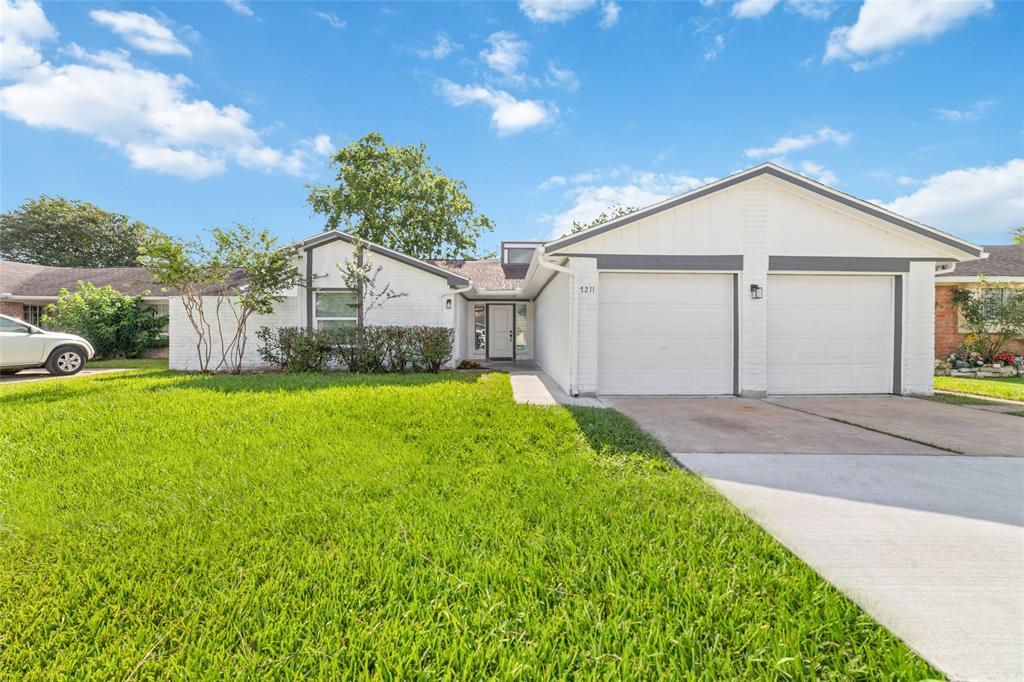
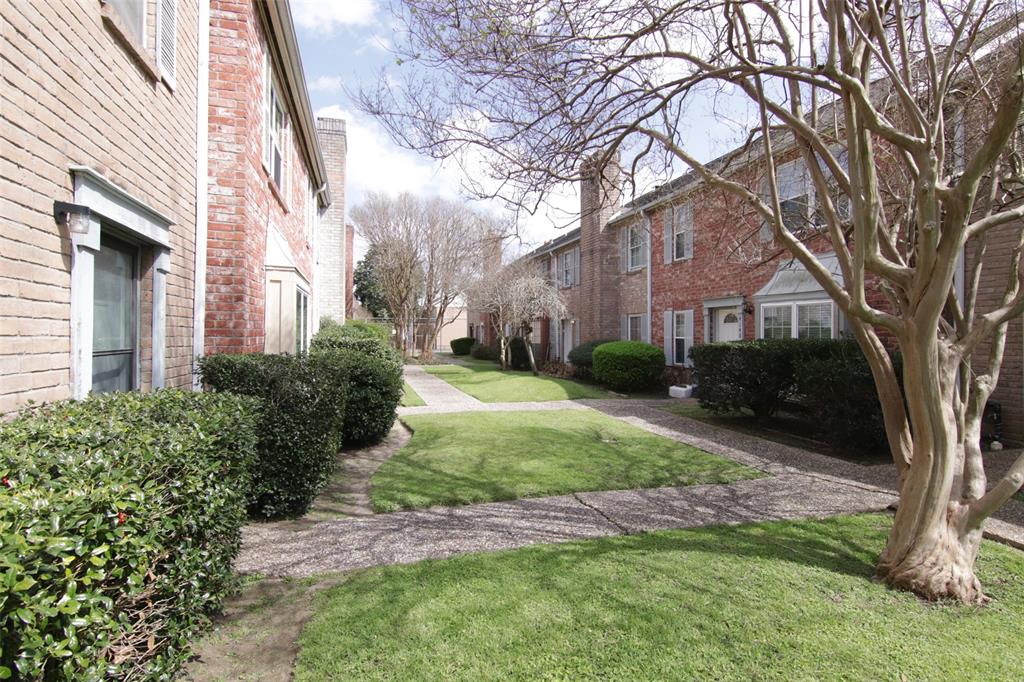
8323 Wilcrest Dr, Houston, TX 77072
$514
Cash flow
10.1%
Cash-on-Cash Return
10.5%
Cap rate
1.9%
Rent to Value Ratio
Active
$65,000
2
bds
|
0
ba
|
1,018
sqft
|
built
1978
8323 Wilcrest Dr, Houston, TX 77072
$392
Cash flow
7.0%
Cash-on-Cash Return
7.2%
Cap rate
1.8%
Rent to Value Ratio
111 out of 129 properties for sale in 77072
Limited Results Shown
Create a free account, or log in to reveal all property listings and enjoy the complete experience.
Active
$190,000
3
bds
|
0
ba
|
1,500
sqft
|
built
1977
12525 Wellington Park Dr, Houston, TX 77072
$-222
Cash flow
-6.1%
Cash-on-Cash Return
4.3%
Cap rate
0.9%
Rent to Value Ratio
Active
$65,000
2
bds
|
0
ba
|
834
sqft
|
built
1978
8405 Wilcrest Dr, Houston, TX 77072
$259
Cash flow
4.6%
Cash-on-Cash Return
4.8%
Cap rate
1.5%
Rent to Value Ratio
Active
$120,000
3
bds
|
0
ba
|
1,332
sqft
|
built
1978
8405 Wilcrest Dr, Houston, TX 77072
$-44
Cash flow
-1.9%
Cash-on-Cash Return
5.2%
Cap rate
1.1%
Rent to Value Ratio
Active
$65,000
2
bds
|
0
ba
|
1,018
sqft
|
built
1978
8405 Wilcrest Dr, Houston, TX 77072
$254
Cash flow
4.6%
Cash-on-Cash Return
4.7%
Cap rate
1.5%
Rent to Value Ratio
Active
$115,000
2
bds
|
0
ba
|
1,426
sqft
|
built
1975
4164 Belle Park Dr, Houston, TX 77072
$-224
Cash flow
-10.2%
Cash-on-Cash Return
3.3%
Cap rate
1.3%
Rent to Value Ratio
Active
$160,000
2
bds
|
0
ba
|
1,184
sqft
|
built
1970
12046 Beechnut St, Houston, TX 77072
$-281
Cash flow
-9.2%
Cash-on-Cash Return
3.6%
Cap rate
0.6%
Rent to Value Ratio
Active
$114,900
1
bds
|
0
ba
|
750
sqft
|
built
1980
10555 Turtlewood Ct, Houston, TX 77072
$-216
Cash flow
-9.8%
Cash-on-Cash Return
3.4%
Cap rate
1.0%
Rent to Value Ratio
Active
$108,000
1
bds
|
0
ba
|
760
sqft
|
built
1980
10555 Turtlewood Ct, Houston, TX 77072
$-219
Cash flow
-10.6%
Cash-on-Cash Return
3.2%
Cap rate
0.9%
Rent to Value Ratio
Active
$197,000
3
bds
|
0
ba
|
2,000
sqft
|
built
1972
7010 S Dairy Ashford Rd, Houston, TX 77072
$-247
Cash flow
-6.5%
Cash-on-Cash Return
4.2%
Cap rate
1.0%
Rent to Value Ratio
Active
$57,900
2
bds
|
0
ba
|
834
sqft
|
built
1978
8405 Wilcrest Dr, Houston, TX 77072
$391
Cash flow
7.9%
Cash-on-Cash Return
8.1%
Cap rate
1.9%
Rent to Value Ratio
Active
$129,999
2
bds
|
0
ba
|
1,088
sqft
|
built
1969
11547 Beechnut St, Houston, TX 77072
$27
Cash flow
1.1%
Cash-on-Cash Return
5.9%
Cap rate
1.1%
Rent to Value Ratio
Active
$146,900
2
bds
|
0
ba
|
956
sqft
|
built
1976
13023 High Star Dr, Houston, TX 77072
$-152
Cash flow
-5.4%
Cash-on-Cash Return
4.4%
Cap rate
1.0%
Rent to Value Ratio
Active
$229,000
3
bds
|
0
ba
|
1,399
sqft
|
built
1973
13011 Harwin Dr, Houston, TX 77072
$-273
Cash flow
-6.2%
Cash-on-Cash Return
4.2%
Cap rate
0.8%
Rent to Value Ratio
Active
$68,500
2
bds
|
0
ba
|
1,018
sqft
|
built
1978
8323 Wilcrest Dr, Houston, TX 77072
$341
Cash flow
5.8%
Cash-on-Cash Return
6.0%
Cap rate
1.6%
Rent to Value Ratio
Active under contract
$275,000
3
bds
|
0
ba
|
1,626
sqft
|
built
1978
7211 Autumn Grove Dr, Houston, TX 77072
$-552
Cash flow
-10.5%
Cash-on-Cash Return
3.3%
Cap rate
0.6%
Rent to Value Ratio
Active
$153,000
2
bds
|
0
ba
|
1,188
sqft
|
built
1979
13002 Leader St, Houston, TX 77072
$-124
Cash flow
-4.2%
Cash-on-Cash Return
4.7%
Cap rate
1.0%
Rent to Value Ratio
Active
$339,000
3
bds
|
0
ba
|
1,888
sqft
|
built
1977
11507 Willwood Dr, Houston, TX 77072
$-763
Cash flow
-11.7%
Cash-on-Cash Return
3.0%
Cap rate
0.6%
Rent to Value Ratio
Active
$241,000
3
bds
|
0
ba
|
1,190
sqft
|
built
1977
11542 Bellerive Dr, Houston, TX 77072
$-296
Cash flow
-6.4%
Cash-on-Cash Return
4.2%
Cap rate
0.7%
Rent to Value Ratio
Active
$286,000
4
bds
|
0
ba
|
2,112
sqft
|
built
1972
12126 Troulon Dr, Houston, TX 77072
$-906
Cash flow
-16.5%
Cash-on-Cash Return
1.9%
Cap rate
0.4%
Rent to Value Ratio
Active
$119,000
2
bds
|
0
ba
|
1,242
sqft
|
built
1977
8494 Dairy View Ln, Houston, TX 77072
$-307
Cash flow
-13.5%
Cash-on-Cash Return
2.6%
Cap rate
1.1%
Rent to Value Ratio
Active
$219,000
3
bds
|
0
ba
|
1,546
sqft
|
built
1978
11110 Petworth Dr, Houston, TX 77072
$-285
Cash flow
-6.8%
Cash-on-Cash Return
4.1%
Cap rate
0.8%
Rent to Value Ratio
Active
$269,999
3
bds
|
0
ba
|
1,841
sqft
|
built
1976
12719 Braewood Glen Ln, Houston, TX 77072
$-346
Cash flow
-6.7%
Cash-on-Cash Return
4.1%
Cap rate
0.7%
Rent to Value Ratio
Active
$129,000
2
bds
|
0
ba
|
1,426
sqft
|
built
1976
4150 Belle Park Dr, Houston, TX 77072
$-336
Cash flow
-13.6%
Cash-on-Cash Return
2.5%
Cap rate
1.2%
Rent to Value Ratio
Active
$115,900
2
bds
|
0
ba
|
1,380
sqft
|
built
1977
4016 Belle Park Dr, Houston, TX 77072
$-117
Cash flow
-5.3%
Cash-on-Cash Return
4.5%
Cap rate
1.2%
Rent to Value Ratio
Active
$135,000
2
bds
|
0
ba
|
953
sqft
|
built
2003
6289 Wilcrest Dr, Houston, TX 77072
$-126
Cash flow
-4.9%
Cash-on-Cash Return
4.6%
Cap rate
1.0%
Rent to Value Ratio
Active
$128,000
2
bds
|
0
ba
|
946
sqft
|
built
1980
10555 Turtlewood Ct, Houston, TX 77072
$13
Cash flow
0.5%
Cash-on-Cash Return
5.8%
Cap rate
1.1%
Rent to Value Ratio
Active
$59,000
2
bds
|
0
ba
|
0
sqft
|
built
1978
8323 Wilcrest Dr, Houston, TX 77072
$514
Cash flow
10.1%
Cash-on-Cash Return
10.5%
Cap rate
1.9%
Rent to Value Ratio
Active
$224,000
3
bds
|
0
ba
|
1,554
sqft
|
built
1967
11622 Carvel Ln, Houston, TX 77072
$-196
Cash flow
-4.6%
Cash-on-Cash Return
4.6%
Cap rate
0.8%
Rent to Value Ratio
Active
$189,000
3
bds
|
0
ba
|
1,505
sqft
|
built
1978
12356 Newbrook Dr, Houston, TX 77072
$-59
Cash flow
-1.6%
Cash-on-Cash Return
5.3%
Cap rate
1.0%
Rent to Value Ratio
Active
$128,999
2
bds
|
0
ba
|
1,426
sqft
|
built
1975
4166 Belle Park Dr, Houston, TX 77072
$-344
Cash flow
-13.9%
Cash-on-Cash Return
2.5%
Cap rate
1.2%
Rent to Value Ratio
Active
$65,000
2
bds
|
0
ba
|
1,018
sqft
|
built
1978
8323 Wilcrest Dr, Houston, TX 77072
$392
Cash flow
7.0%
Cash-on-Cash Return
7.2%
Cap rate
1.8%
Rent to Value Ratio
Active under contract
$114,900
2
bds
|
0
ba
|
1,380
sqft
|
built
1976
4064 Belle Park Dr, Houston, TX 77072
$-113
Cash flow
-5.1%
Cash-on-Cash Return
4.5%
Cap rate
1.2%
Rent to Value Ratio
Active
$160,000
2
bds
|
0
ba
|
1,422
sqft
|
built
1978
12952 Greenway Chase Ct, Houston, TX 77072
$-204
Cash flow
-6.7%
Cash-on-Cash Return
4.1%
Cap rate
1.0%
Rent to Value Ratio
Active
$299,900
3
bds
|
0
ba
|
1,914
sqft
|
built
2014
12627 Ashford Shore Dr, Houston, TX 77072
$-254
Cash flow
-4.4%
Cash-on-Cash Return
4.7%
Cap rate
0.7%
Rent to Value Ratio
Active
$325,800
4
bds
|
0
ba
|
2,015
sqft
|
built
1970
11515 Bandlon Dr, Houston, TX 77072
$-631
Cash flow
-10.1%
Cash-on-Cash Return
3.4%
Cap rate
0.6%
Rent to Value Ratio
Active
$319,900
4
bds
|
0
ba
|
2,590
sqft
|
built
2005
13007 Hill Canyon Ln, Houston, TX 77072
$-661
Cash flow
-10.8%
Cash-on-Cash Return
3.2%
Cap rate
0.7%
Rent to Value Ratio
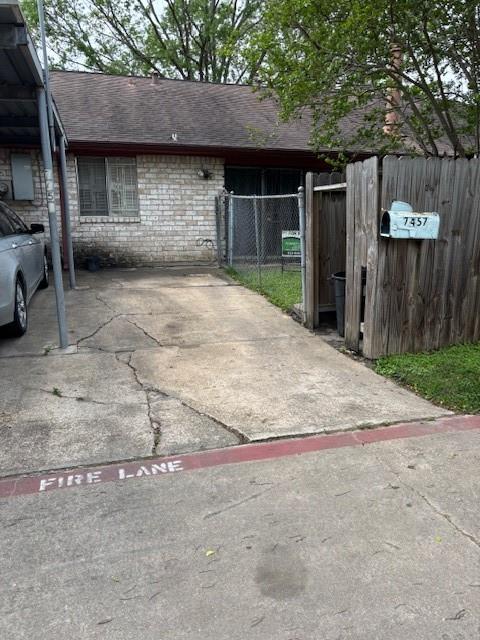
Active
$145,000
2
bds
|
0
ba
|
1,200
sqft
|
built
1970
7457 Cook Rd, Houston, TX 77072
$-141
Cash flow
-5.1%
Cash-on-Cash Return
4.5%
Cap rate
1.0%
Rent to Value Ratio
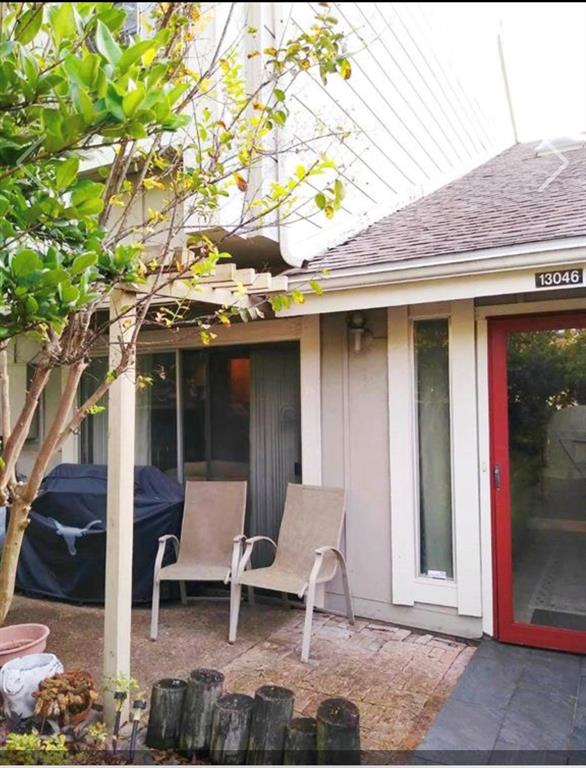
Active
$199,999
2
bds
|
0
ba
|
1,422
sqft
|
built
1978
13046 Greenway Chase Ct, Houston, TX 77072
$-62
Cash flow
-1.6%
Cash-on-Cash Return
5.3%
Cap rate
0.9%
Rent to Value Ratio
Active
$260,000
4
bds
|
0
ba
|
1,537
sqft
|
built
2006
12523 Prosperity River Ct, Houston, TX 77072
$-354
Cash flow
-7.1%
Cash-on-Cash Return
4.0%
Cap rate
0.8%
Rent to Value Ratio
Pending
$259,000
4
bds
|
0
ba
|
2,150
sqft
|
built
1966
11711 Roos Rd, Houston, TX 77072
$-349
Cash flow
-7.0%
Cash-on-Cash Return
4.1%
Cap rate
0.8%
Rent to Value Ratio