80113 Investment Properties for Sale
Browse homes for sale and investment properties in 80113. Refine your search by price, property type, or more.
Best cash flowing properties in 80113

Active
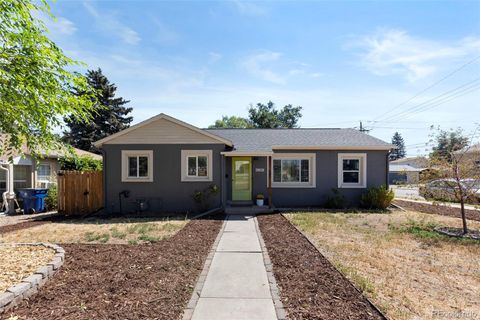
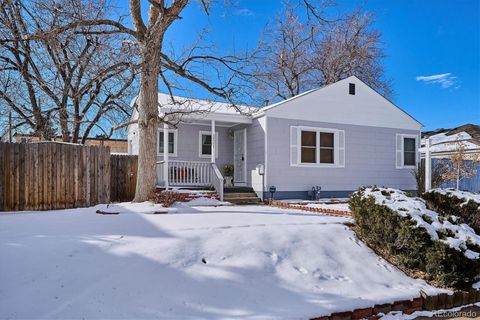
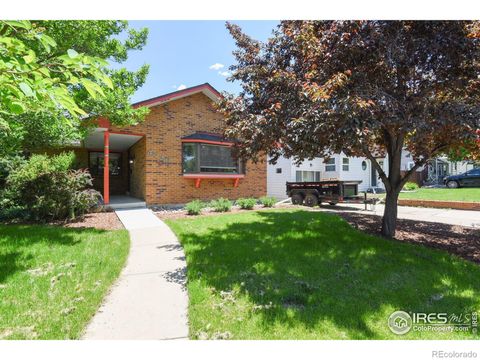
$450,000
2
bds
|
3
ba
|
1,633
sqft
|
built
1948
4540 S Pearl St, Englewood, CO 80113
$-408
Cash flow
-4.7%
Cash-on-Cash Return
4.6%
Cap rate
0.6%
Rent to Value Ratio
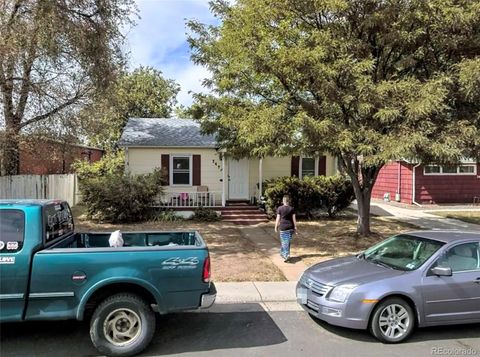
Active
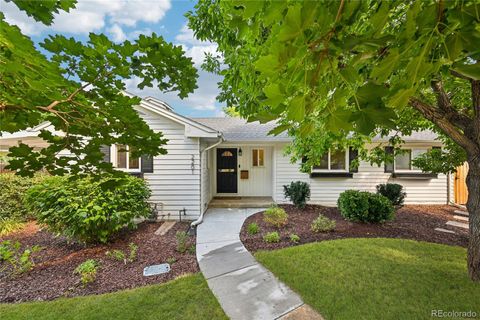
$485,000
2
bds
|
2
ba
|
944
sqft
|
built
1946
4280 S Lincoln St, Englewood, CO 80113
$-679
Cash flow
-7.3%
Cash-on-Cash Return
4.0%
Cap rate
0.5%
Rent to Value Ratio
43 out of 45 properties for sale in 80113
Limited Results Shown
Create a free account, or log in to reveal all property listings and enjoy the complete experience.
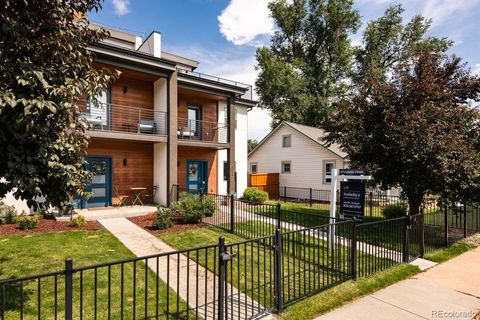
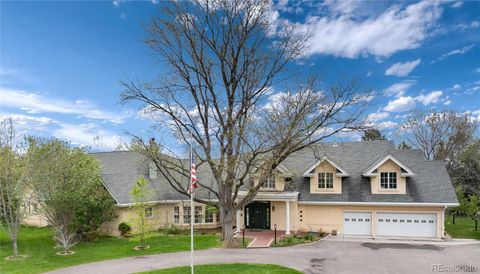
Active
$1,025,000
4
bds
|
4
ba
|
2,312
sqft
|
built
2019
3522 S Ogden St, Englewood, CO 80113
$-2,147
Cash flow
-10.9%
Cash-on-Cash Return
3.2%
Cap rate
0.4%
Rent to Value Ratio
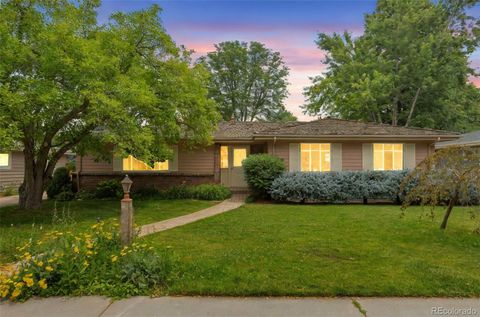
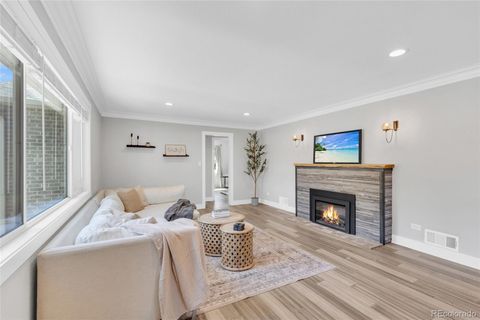
Active
$750,000
3
bds
|
3
ba
|
2,820
sqft
|
built
1955
2309 E Floyd Pl, Englewood, CO 80113
$-1,423
Cash flow
-9.9%
Cash-on-Cash Return
3.4%
Cap rate
0.5%
Rent to Value Ratio
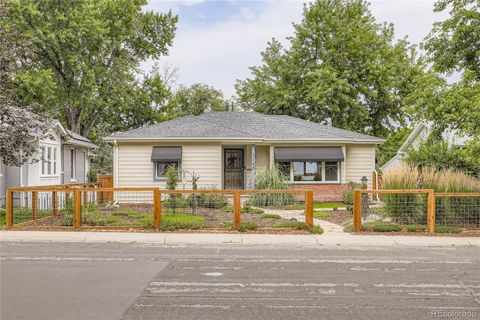
Active
$750,000
3
bds
|
2
ba
|
2,109
sqft
|
built
1951
3248 S Ogden St, Englewood, CO 80113
$-1,787
Cash flow
-12.4%
Cash-on-Cash Return
2.8%
Cap rate
0.4%
Rent to Value Ratio
Active
$899,000
5
bds
|
2
ba
|
2,307
sqft
|
built
1960
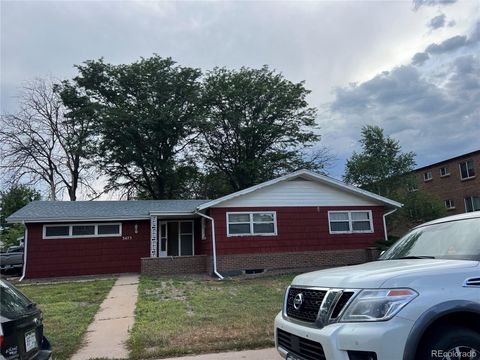
3475 S Marion St, Englewood, CO 80113
$-2,513
Cash flow
-14.6%
Cash-on-Cash Return
2.3%
Cap rate
0.3%
Rent to Value Ratio
Active
$835,000
3
bds
|
2
ba
|
1,924
sqft
|
built
1949
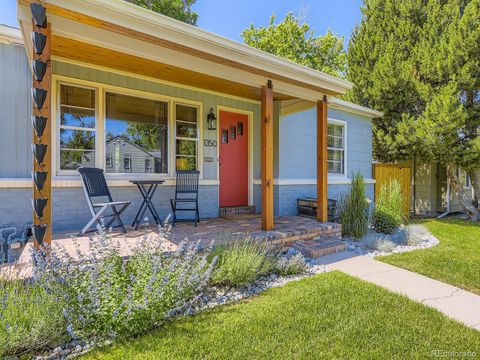
1350 E Amherst Ave, Englewood, CO 80113
$-1,831
Cash flow
-11.4%
Cash-on-Cash Return
3.0%
Cap rate
0.4%
Rent to Value Ratio
Active
$649,999
3
bds
|
2
ba
|
1,388
sqft
|
built
1993
3100 S Corona St, Englewood, CO 80113
$-1,172
Cash flow
-9.4%
Cash-on-Cash Return
3.5%
Cap rate
0.5%
Rent to Value Ratio
Active
$1,350,000
8
bds
|
4
ba
|
3,308
sqft
|
built
1931
4087 S Clarkson St, Englewood, CO 80113
$-5,627
Cash flow
-21.7%
Cash-on-Cash Return
0.7%
Cap rate
0.1%
Rent to Value Ratio
Active
$648,888
4
bds
|
2
ba
|
1,813
sqft
|
built
1910
3311 S Logan St, Englewood, CO 80113
$-1,581
Cash flow
-12.7%
Cash-on-Cash Return
2.8%
Cap rate
0.4%
Rent to Value Ratio
Active
$859,000
2
bds
|
4
ba
|
2,505
sqft
|
built
1982
1900 E Girard Pl, Englewood, CO 80113
$-4,559
Cash flow
-27.7%
Cash-on-Cash Return
-0.7%
Cap rate
0.4%
Rent to Value Ratio
Active
$850,000
5
bds
|
3
ba
|
2,398
sqft
|
built
1966
2201 E Floyd Ave, Englewood, CO 80113
$-1,731
Cash flow
-10.6%
Cash-on-Cash Return
3.2%
Cap rate
0.5%
Rent to Value Ratio
Active
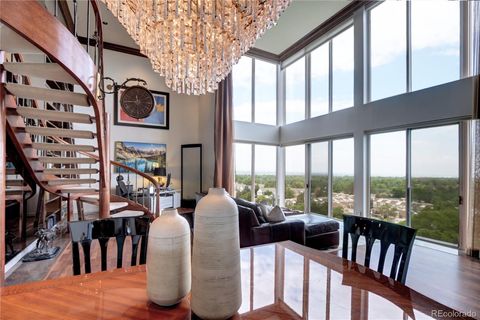
$3,095,000
6
bds
|
6
ba
|
6,183
sqft
|
built
1971
4285 S Hudson Pkwy, Englewood, CO 80113
$-12,021
Cash flow
-20.3%
Cash-on-Cash Return
1.0%
Cap rate
0.2%
Rent to Value Ratio
Active
$649,999
4
bds
|
2
ba
|
1,680
sqft
|
built
1953
3256 S Ogden St, Englewood, CO 80113
$-1,360
Cash flow
-10.9%
Cash-on-Cash Return
3.2%
Cap rate
0.4%
Rent to Value Ratio
Active
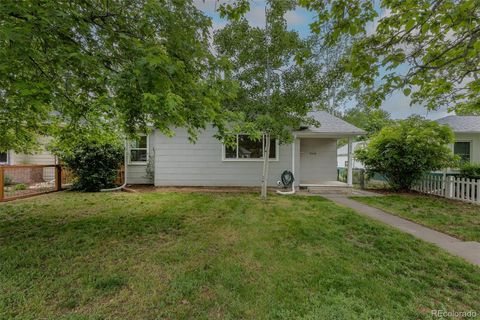
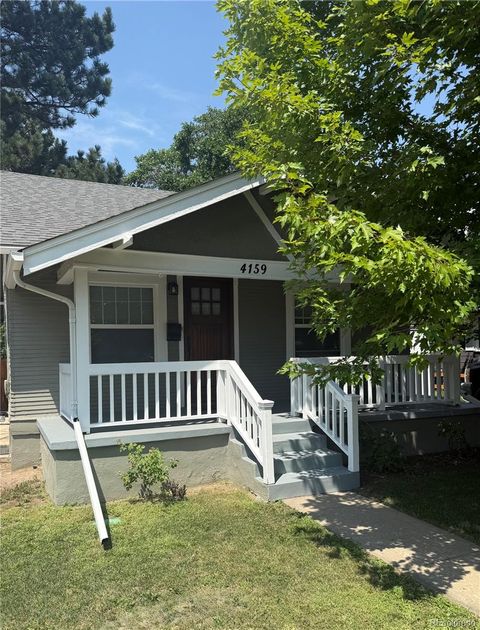
$625,000
4
bds
|
2
ba
|
1,591
sqft
|
built
1916
4159 S Sherman St, Englewood, CO 80113
$-1,203
Cash flow
-10.0%
Cash-on-Cash Return
3.4%
Cap rate
0.5%
Rent to Value Ratio

Active
$22,000,000
7
bds
|
12
ba
|
23,060
sqft
|
built
2007
12 Lynn Rd, Englewood, CO 80113
$-105,308
Cash flow
-25.0%
Cash-on-Cash Return
-0.1%
Cap rate
0.0%
Rent to Value Ratio

Active
$499,000
3
bds
|
2
ba
|
1,664
sqft
|
built
1954
4624 S Lincoln St, Englewood, CO 80113
$-783
Cash flow
-8.2%
Cash-on-Cash Return
3.8%
Cap rate
0.5%
Rent to Value Ratio

Active
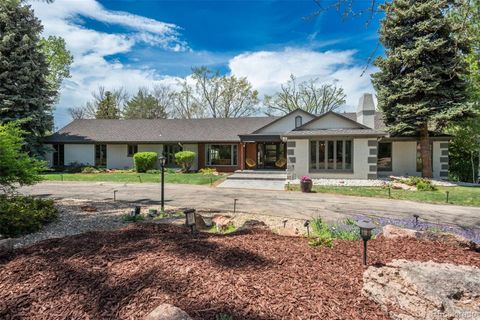
$4,100,000
5
bds
|
6
ba
|
6,166
sqft
|
built
1991
93 Glenmoor Dr, Englewood, CO 80113
$-17,973
Cash flow
-22.9%
Cash-on-Cash Return
0.4%
Cap rate
0.1%
Rent to Value Ratio
Active
$5,800,000
8
bds
|
11
ba
|
14,481
sqft
|
built
1976
9 Sedgwick Dr, Englewood, CO 80113
$-23,836
Cash flow
-21.4%
Cash-on-Cash Return
0.7%
Cap rate
0.2%
Rent to Value Ratio

Active
$2,690,000
6
bds
|
7
ba
|
5,018
sqft
|
built
1975
3500 S Franklin St, Englewood, CO 80113
$-7,388
Cash flow
-14.3%
Cash-on-Cash Return
2.4%
Cap rate
0.3%
Rent to Value Ratio

Active
$599,900
4
bds
|
2
ba
|
2,004
sqft
|
built
1957
4291 S Clarkson St, Englewood, CO 80113
$-983
Cash flow
-8.5%
Cash-on-Cash Return
3.7%
Cap rate
0.5%
Rent to Value Ratio

Active
$3,295,000
8
bds
|
7
ba
|
6,148
sqft
|
built
1955
3360 S Columbine Cir, Englewood, CO 80113
$-12,117
Cash flow
-19.2%
Cash-on-Cash Return
1.3%
Cap rate
0.2%
Rent to Value Ratio
Active
$3,295,000
5
bds
|
8
ba
|
6,920
sqft
|
built
1967
39 Sedgwick Dr, Englewood, CO 80113
$-11,607
Cash flow
-18.4%
Cash-on-Cash Return
1.5%
Cap rate
0.3%
Rent to Value Ratio

Active
$1,786,000
5
bds
|
4
ba
|
4,606
sqft
|
built
2022
3256 S Corona St, Englewood, CO 80113
$-3,158
Cash flow
-9.2%
Cash-on-Cash Return
3.6%
Cap rate
0.5%
Rent to Value Ratio
Active
$615,000
4
bds
|
2
ba
|
2,500
sqft
|
built
1984
4720 S Grant St, Englewood, CO 80113
$-1,218
Cash flow
-10.3%
Cash-on-Cash Return
3.3%
Cap rate
0.5%
Rent to Value Ratio

Active
$745,000
3
bds
|
3
ba
|
1,657
sqft
|
built
1950
3127 S Corona St, Englewood, CO 80113
$-1,762
Cash flow
-12.3%
Cash-on-Cash Return
2.8%
Cap rate
0.4%
Rent to Value Ratio

Active
$595,000
2
bds
|
2
ba
|
2,230
sqft
|
built
1982
1900 E Girard Pl, Englewood, CO 80113
$-3,187
Cash flow
-27.9%
Cash-on-Cash Return
-0.7%
Cap rate
0.4%
Rent to Value Ratio
Active
$599,000
4
bds
|
2
ba
|
1,536
sqft
|
built
1950
3477 S Marion St, Englewood, CO 80113
$-1,604
Cash flow
-14.0%
Cash-on-Cash Return
2.5%
Cap rate
0.3%
Rent to Value Ratio

Active
$3,695,000
6
bds
|
6
ba
|
6,319
sqft
|
built
2003
1 Gooseberry Ln, Englewood, CO 80113
$-15,494
Cash flow
-21.9%
Cash-on-Cash Return
0.6%
Cap rate
0.2%
Rent to Value Ratio
Active
$4,750,000
5
bds
|
5
ba
|
7,229
sqft
|
built
1977
4800 S Franklin St, Englewood, CO 80113
$-19,115
Cash flow
-21.0%
Cash-on-Cash Return
0.8%
Cap rate
0.2%
Rent to Value Ratio

Active
$1,188,000
3
bds
|
3
ba
|
2,725
sqft
|
built
1953
2990 S Sherman St, Englewood, CO 80113
$-3,593
Cash flow
-15.8%
Cash-on-Cash Return
2.0%
Cap rate
0.3%
Rent to Value Ratio

Active
$8,490,000
5
bds
|
7
ba
|
8,740
sqft
|
built
1968
4545 S High St, Englewood, CO 80113
$-38,837
Cash flow
-23.9%
Cash-on-Cash Return
0.2%
Cap rate
0.1%
Rent to Value Ratio
Active
$760,000
4
bds
|
2
ba
|
2,744
sqft
|
built
1952
3101 S Logan St, Englewood, CO 80113
$-1,206
Cash flow
-8.3%
Cash-on-Cash Return
3.8%
Cap rate
0.5%
Rent to Value Ratio
Active
$525,000
2
bds
|
2
ba
|
960
sqft
|
built
2020
3500 S Corona St, Englewood, CO 80113
$-1,377
Cash flow
-13.7%
Cash-on-Cash Return
2.5%
Cap rate
0.5%
Rent to Value Ratio

Active
$469,900
3
bds
|
1
ba
|
1,059
sqft
|
built
1940
3388 S Washington St, Englewood, CO 80113
$-693
Cash flow
-7.7%
Cash-on-Cash Return
3.9%
Cap rate
0.5%
Rent to Value Ratio

Active
$630,000
4
bds
|
2
ba
|
976
sqft
|
built
1965
4591 S Pennsylvania St, Englewood, CO 80113
$-1,584
Cash flow
-13.1%
Cash-on-Cash Return
2.7%
Cap rate
0.4%
Rent to Value Ratio

Active
$589,000
4
bds
|
2
ba
|
1,715
sqft
|
built
1950
2731 S Pearl St, Englewood, CO 80113
$-1,248
Cash flow
-11.1%
Cash-on-Cash Return
3.1%
Cap rate
0.4%
Rent to Value Ratio

Active
$699,000
3
bds
|
3
ba
|
2,433
sqft
|
built
2011
2935 S Sherman St, Englewood, CO 80113
$-1,440
Cash flow
-10.7%
Cash-on-Cash Return
3.2%
Cap rate
0.5%
Rent to Value Ratio
Active
$570,000
3
bds
|
2
ba
|
1,662
sqft
|
built
1961
3306 S Logan St, Englewood, CO 80113
$-923
Cash flow
-8.4%
Cash-on-Cash Return
3.7%
Cap rate
0.5%
Rent to Value Ratio

Active
$499,500
2
bds
|
1
ba
|
832
sqft
|
built
1956
4874 S Lincoln St, Englewood, CO 80113
$-1,018
Cash flow
-10.6%
Cash-on-Cash Return
3.2%
Cap rate
0.4%
Rent to Value Ratio