80113 Investment Properties for Sale
Browse homes for sale and investment properties in 80113. Refine your search by price, property type, or more.
Best cash flowing properties in 80113
Active
$542,000
3
bds
|
1
ba
|
1,632
sqft
|
built
1902
1111 E Dartmouth Ave, Englewood, CO 80113
$-551
Cash flow
-5.3%
Cash-on-Cash Return
4.5%
Cap rate
0.6%
Rent to Value Ratio

Active
$495,000
3
bds
|
1
ba
|
884
sqft
|
built
1925
4476 S Lincoln St, Englewood, CO 80113
$-832
Cash flow
-8.8%
Cash-on-Cash Return
3.7%
Cap rate
0.5%
Rent to Value Ratio
52 out of 95 properties for sale in 80113
Limited Results Shown
Create a free account, or log in to reveal all property listings and enjoy the complete experience.
Active
$557,000
2
bds
|
2
ba
|
978
sqft
|
built
1902
3024 S Sherman St, Englewood, CO 80113
$-835
Cash flow
-7.8%
Cash-on-Cash Return
3.9%
Cap rate
0.5%
Rent to Value Ratio
Active
$899,000
5
bds
|
2
ba
|
2,307
sqft
|
built
1960
3475 S Marion St, Englewood, CO 80113
$-2,513
Cash flow
-14.6%
Cash-on-Cash Return
2.3%
Cap rate
0.3%
Rent to Value Ratio

Active
$489,000
2
bds
|
2
ba
|
961
sqft
|
built
2020
3500 S Corona St, Englewood, CO 80113
$-1,186
Cash flow
-12.7%
Cash-on-Cash Return
2.8%
Cap rate
0.5%
Rent to Value Ratio
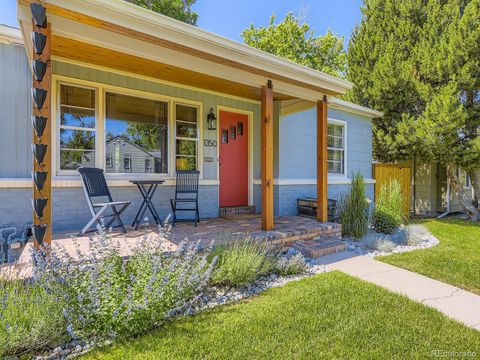
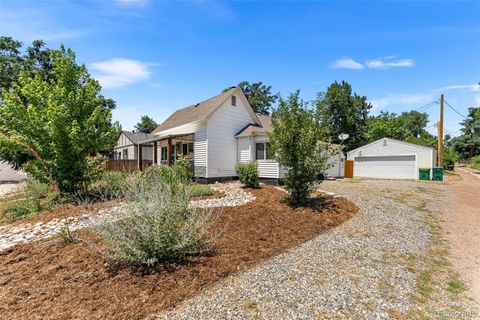
Active
$835,000
3
bds
|
2
ba
|
1,924
sqft
|
built
1949
1350 E Amherst Ave, Englewood, CO 80113
$-1,831
Cash flow
-11.4%
Cash-on-Cash Return
3.0%
Cap rate
0.4%
Rent to Value Ratio
Active
$649,999
3
bds
|
2
ba
|
1,388
sqft
|
built
1993
3100 S Corona St, Englewood, CO 80113
$-1,172
Cash flow
-9.4%
Cash-on-Cash Return
3.5%
Cap rate
0.5%
Rent to Value Ratio
Active
$1,350,000
8
bds
|
4
ba
|
3,308
sqft
|
built
1931
4087 S Clarkson St, Englewood, CO 80113
$-5,627
Cash flow
-21.7%
Cash-on-Cash Return
0.7%
Cap rate
0.1%
Rent to Value Ratio

Active
$4,800,000
5
bds
|
6
ba
|
6,507
sqft
|
built
1977
4181 S Colorado Blvd, Englewood, CO 80113
$-19,831
Cash flow
-21.6%
Cash-on-Cash Return
0.7%
Cap rate
0.1%
Rent to Value Ratio
Active
$825,000
4
bds
|
3
ba
|
2,067
sqft
|
built
1936
3755 S Sherman St, Englewood, CO 80113
$-2,013
Cash flow
-12.7%
Cash-on-Cash Return
2.8%
Cap rate
0.4%
Rent to Value Ratio

Active
$8,650,000
5
bds
|
9
ba
|
12,356
sqft
|
built
1997
5 Churchill Dr, Englewood, CO 80113
$-38,249
Cash flow
-23.1%
Cash-on-Cash Return
0.4%
Cap rate
0.1%
Rent to Value Ratio

Active
$649,000
2
bds
|
2
ba
|
1,540
sqft
|
built
1963
2900 S Downing St, Englewood, CO 80113
$-1,233
Cash flow
-9.9%
Cash-on-Cash Return
3.4%
Cap rate
0.5%
Rent to Value Ratio

Active
$490,000
2
bds
|
1
ba
|
934
sqft
|
built
1931
3798 S Grant St, Englewood, CO 80113
$-985
Cash flow
-10.5%
Cash-on-Cash Return
3.3%
Cap rate
0.4%
Rent to Value Ratio
Active
$648,888
4
bds
|
2
ba
|
1,813
sqft
|
built
1910
3311 S Logan St, Englewood, CO 80113
$-1,581
Cash flow
-12.7%
Cash-on-Cash Return
2.8%
Cap rate
0.4%
Rent to Value Ratio
Active
$859,000
2
bds
|
4
ba
|
2,505
sqft
|
built
1982
1900 E Girard Pl, Englewood, CO 80113
$-4,559
Cash flow
-27.7%
Cash-on-Cash Return
-0.7%
Cap rate
0.4%
Rent to Value Ratio
Active
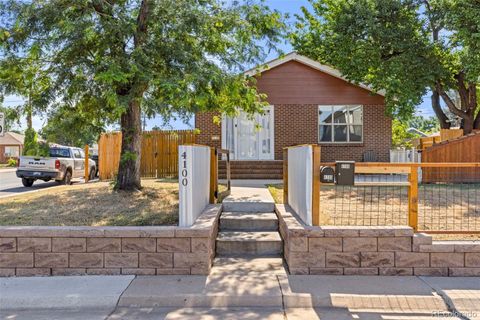
$550,000
2
bds
|
1
ba
|
912
sqft
|
built
1922
4100 S Lincoln St, Englewood, CO 80113
$-1,431
Cash flow
-13.6%
Cash-on-Cash Return
2.6%
Cap rate
0.4%
Rent to Value Ratio
Active
$3,095,000
6
bds
|
6
ba
|
6,183
sqft
|
built
1971
4285 S Hudson Pkwy, Englewood, CO 80113
$-12,021
Cash flow
-20.3%
Cash-on-Cash Return
1.0%
Cap rate
0.2%
Rent to Value Ratio
Active
$649,999
4
bds
|
2
ba
|
1,680
sqft
|
built
1953
3256 S Ogden St, Englewood, CO 80113
$-1,360
Cash flow
-10.9%
Cash-on-Cash Return
3.2%
Cap rate
0.4%
Rent to Value Ratio
Active
$597,500
3
bds
|
2
ba
|
1,290
sqft
|
built
1958
4745 S Sherman St, Englewood, CO 80113
$-1,869
Cash flow
-16.3%
Cash-on-Cash Return
1.9%
Cap rate
0.3%
Rent to Value Ratio
Active
$2,100,000
6
bds
|
5
ba
|
4,014
sqft
|
built
2018
3057 S University Cir, Englewood, CO 80113
$-5,295
Cash flow
-13.2%
Cash-on-Cash Return
2.7%
Cap rate
0.4%
Rent to Value Ratio
Active
$4,750,000
5
bds
|
5
ba
|
7,229
sqft
|
built
1977
4800 S Franklin St, Englewood, CO 80113
$-19,115
Cash flow
-21.0%
Cash-on-Cash Return
0.8%
Cap rate
0.2%
Rent to Value Ratio

Active
$1,189,900
5
bds
|
4
ba
|
3,411
sqft
|
built
2022
3261 S Sherman St, Englewood, CO 80113
$-2,681
Cash flow
-11.8%
Cash-on-Cash Return
3.0%
Cap rate
0.4%
Rent to Value Ratio

Active
$3,695,000
6
bds
|
6
ba
|
6,319
sqft
|
built
2003
1 Gooseberry Ln, Englewood, CO 80113
$-15,494
Cash flow
-21.9%
Cash-on-Cash Return
0.6%
Cap rate
0.2%
Rent to Value Ratio
Active
$599,000
4
bds
|
2
ba
|
1,536
sqft
|
built
1950
3477 S Marion St, Englewood, CO 80113
$-1,604
Cash flow
-14.0%
Cash-on-Cash Return
2.5%
Cap rate
0.3%
Rent to Value Ratio
Active
$4,995,000
6
bds
|
8
ba
|
8,874
sqft
|
built
2003
1075 E Oxford Ln, Englewood, CO 80113
$-20,286
Cash flow
-21.2%
Cash-on-Cash Return
0.8%
Cap rate
0.2%
Rent to Value Ratio

Active
$2,185,000
4
bds
|
6
ba
|
3,240
sqft
|
built
1959
3975 S Cherry St, Englewood, CO 80113
$-6,791
Cash flow
-16.2%
Cash-on-Cash Return
1.9%
Cap rate
0.3%
Rent to Value Ratio

Active
$2,695,000
4
bds
|
5
ba
|
4,224
sqft
|
built
1960
3925 S Cherry St, Englewood, CO 80113
$-10,387
Cash flow
-20.1%
Cash-on-Cash Return
1.1%
Cap rate
0.2%
Rent to Value Ratio
Active
$570,000
3
bds
|
2
ba
|
1,662
sqft
|
built
1961
3306 S Logan St, Englewood, CO 80113
$-923
Cash flow
-8.4%
Cash-on-Cash Return
3.7%
Cap rate
0.5%
Rent to Value Ratio

Active
$3,750,000
7
bds
|
11
ba
|
10,400
sqft
|
built
1999
4 Redhawk Run, Englewood, CO 80113
$-15,632
Cash flow
-21.7%
Cash-on-Cash Return
0.7%
Cap rate
0.2%
Rent to Value Ratio

Active
$499,500
2
bds
|
1
ba
|
832
sqft
|
built
1956
4874 S Lincoln St, Englewood, CO 80113
$-1,018
Cash flow
-10.6%
Cash-on-Cash Return
3.2%
Cap rate
0.4%
Rent to Value Ratio

Active
$3,400,000
4
bds
|
0
ba
|
7,262
sqft
|
built
1978
3720 E Quincy Ave, Englewood, CO 80113
$-11,770
Cash flow
-18.1%
Cash-on-Cash Return
1.5%
Cap rate
0.2%
Rent to Value Ratio
Active
$600,000
4
bds
|
2
ba
|
1,488
sqft
|
built
1955
3179 S University Blvd, Englewood, CO 80113
$-1,109
Cash flow
-9.6%
Cash-on-Cash Return
3.5%
Cap rate
0.5%
Rent to Value Ratio
Active
$2,395,000
6
bds
|
4
ba
|
3,693
sqft
|
built
1971
4121 S Cherry St, Englewood, CO 80113
$-5,454
Cash flow
-11.9%
Cash-on-Cash Return
2.9%
Cap rate
0.4%
Rent to Value Ratio

Active
$625,000
2
bds
|
2
ba
|
2,377
sqft
|
built
1982
1900 E Girard Pl, Englewood, CO 80113
$-2,894
Cash flow
-24.2%
Cash-on-Cash Return
0.1%
Cap rate
0.5%
Rent to Value Ratio

Active
$625,000
3
bds
|
2
ba
|
1,521
sqft
|
built
1931
4703 S Sherman St, Englewood, CO 80113
$-1,262
Cash flow
-10.5%
Cash-on-Cash Return
3.3%
Cap rate
0.4%
Rent to Value Ratio
Active
$474,000
2
bds
|
2
ba
|
1,120
sqft
|
built
2020
3500 S Corona St, Englewood, CO 80113
$-981
Cash flow
-10.8%
Cash-on-Cash Return
3.2%
Cap rate
0.6%
Rent to Value Ratio
Active
$999,000
3
bds
|
3
ba
|
2,700
sqft
|
built
1971
3481 S Race St, Englewood, CO 80113
$-3,305
Cash flow
-17.3%
Cash-on-Cash Return
1.7%
Cap rate
0.4%
Rent to Value Ratio
Active
$615,000
4
bds
|
2
ba
|
2,500
sqft
|
built
1984
4720 S Grant St, Englewood, CO 80113
$-1,218
Cash flow
-10.3%
Cash-on-Cash Return
3.3%
Cap rate
0.5%
Rent to Value Ratio
Active
$3,295,000
5
bds
|
8
ba
|
6,920
sqft
|
built
1967
39 Sedgwick Dr, Englewood, CO 80113
$-11,607
Cash flow
-18.4%
Cash-on-Cash Return
1.5%
Cap rate
0.3%
Rent to Value Ratio
Active
$559,000
3
bds
|
2
ba
|
1,267
sqft
|
built
1947
3348 S Corona St, Englewood, CO 80113
$-837
Cash flow
-7.8%
Cash-on-Cash Return
3.9%
Cap rate
0.5%
Rent to Value Ratio