84648 Investment Properties for Sale
Browse homes for sale and investment properties in 84648. Refine your search by price, property type, or more.
Best cash flowing properties in 84648
Active
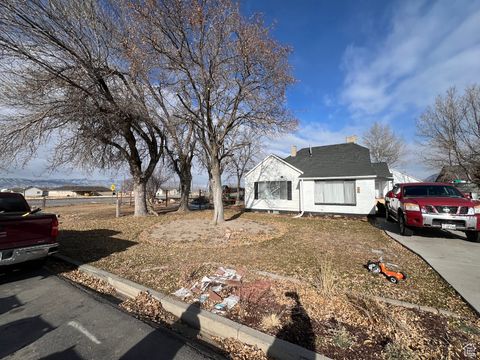
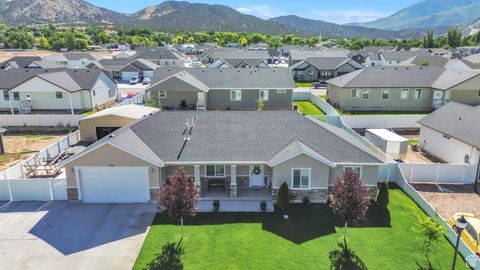
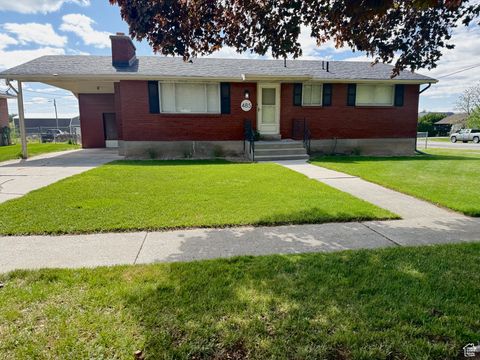
$324,900
4
bds
|
1
ba
|
2,086
sqft
|
built
1922
296 W 700 N, Nephi, UT 84648
$-338
Cash flow
-5.4%
Cash-on-Cash Return
4.4%
Cap rate
0.6%
Rent to Value Ratio
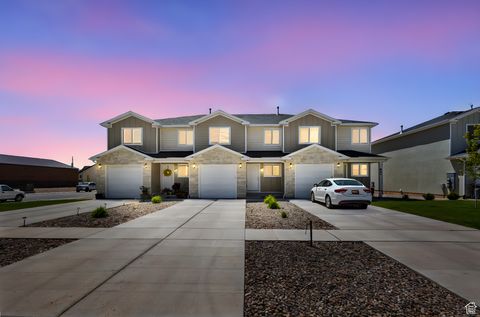
Active
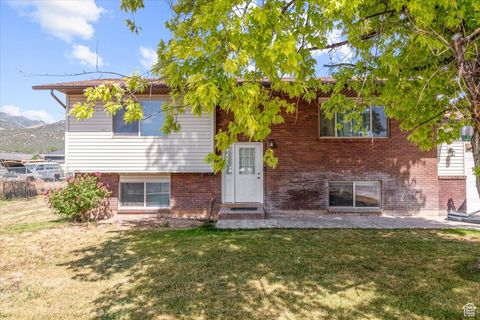
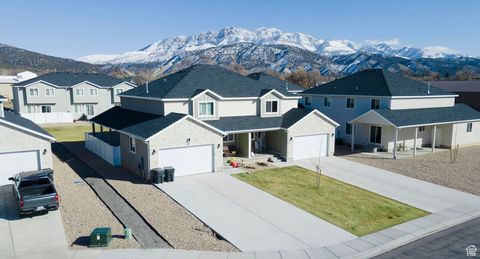
$405,000
4
bds
|
2
ba
|
1,952
sqft
|
built
1981
670 N 400 E, Nephi, UT 84648
$-666
Cash flow
-8.6%
Cash-on-Cash Return
3.7%
Cap rate
0.5%
Rent to Value Ratio
21 out of 33 properties for sale in 84648
Limited Results Shown
Create a free account, or log in to reveal all property listings and enjoy the complete experience.
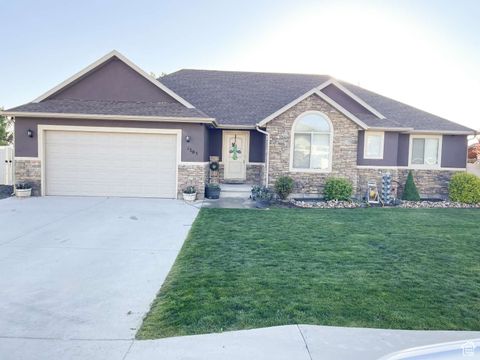
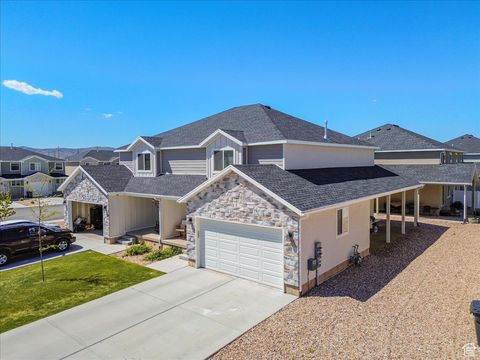
Active
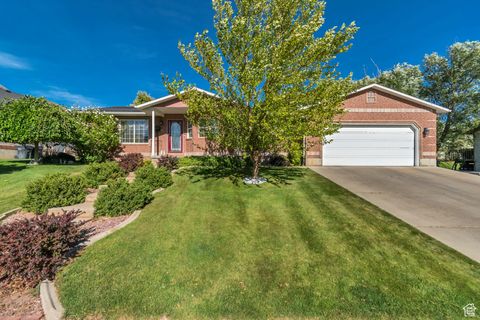
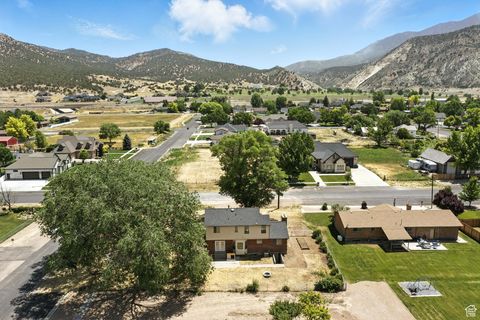
$565,000
4
bds
|
3
ba
|
2,758
sqft
|
built
1997
1318 N 550 E, Nephi, UT 84648
$-1,291
Cash flow
-11.9%
Cash-on-Cash Return
2.9%
Cap rate
0.4%
Rent to Value Ratio
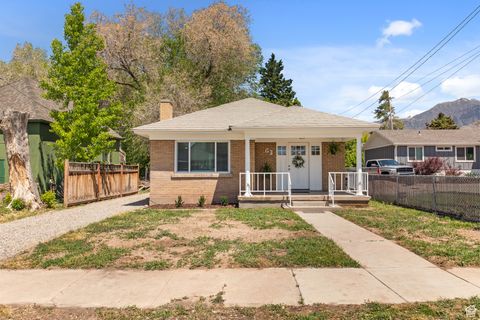
Active
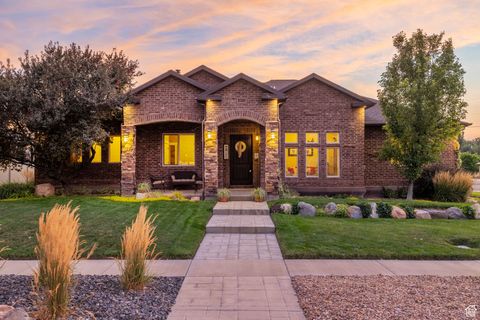
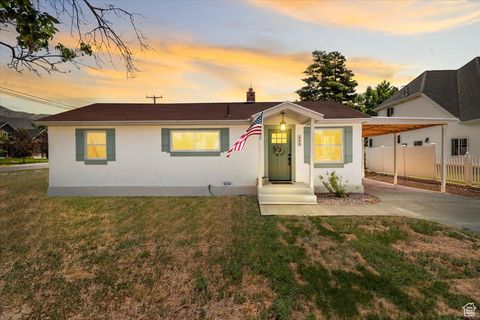
$849,000
7
bds
|
5
ba
|
5,700
sqft
|
built
2008
116 S 600 E, Nephi, UT 84648
$-2,638
Cash flow
-16.2%
Cash-on-Cash Return
2.0%
Cap rate
0.3%
Rent to Value Ratio
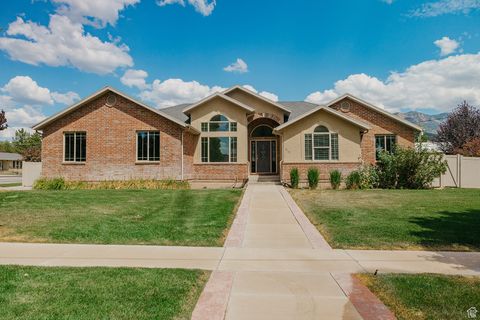
Active
$549,000
4
bds
|
4
ba
|
3,954
sqft
|
built
2005
615 S 100 W, Nephi, UT 84648
$-909
Cash flow
-8.6%
Cash-on-Cash Return
3.7%
Cap rate
0.5%
Rent to Value Ratio
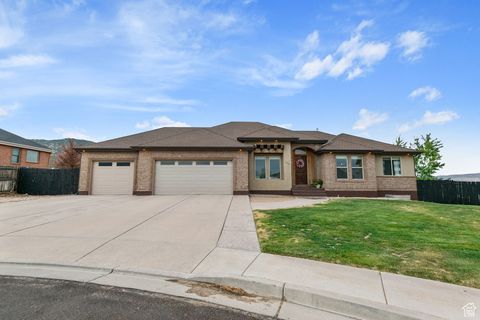
Active
$645,000
6
bds
|
3
ba
|
4,072
sqft
|
built
2006
148 E 1430 S, Nephi, UT 84648
$-1,127
Cash flow
-9.1%
Cash-on-Cash Return
3.6%
Cap rate
0.5%
Rent to Value Ratio
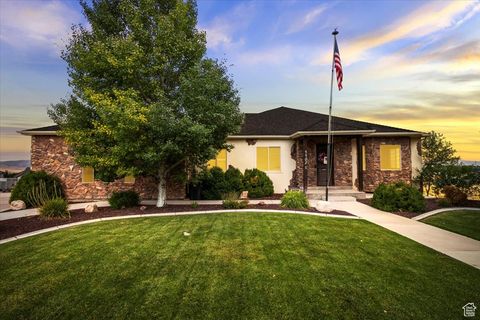
Active
$910,000
7
bds
|
4
ba
|
6,400
sqft
|
built
2005
1102 S 250 E, Nephi, UT 84648
$-2,227
Cash flow
-12.8%
Cash-on-Cash Return
2.7%
Cap rate
0.4%
Rent to Value Ratio
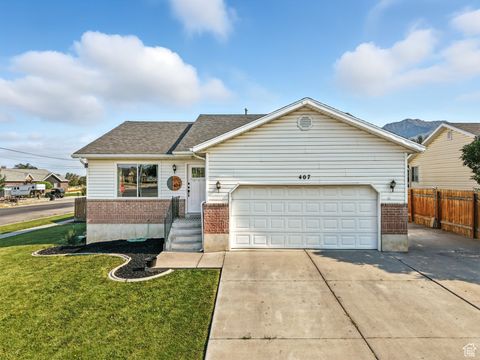
Active
$450,000
4
bds
|
2
ba
|
2,100
sqft
|
built
1999
407 E 760 S, Nephi, UT 84648
$-911
Cash flow
-10.6%
Cash-on-Cash Return
3.3%
Cap rate
0.4%
Rent to Value Ratio
Active
$535,000
3
bds
|
2
ba
|
1,803
sqft
|
built
2021
1188 N 100 E, Nephi, UT 84648
$-790
Cash flow
-7.7%
Cash-on-Cash Return
3.9%
Cap rate
0.5%
Rent to Value Ratio
Active
$393,700
3
bds
|
3
ba
|
2,529
sqft
|
built
2022
926 N 165 W, Nephi, UT 84648
$-792
Cash flow
-10.5%
Cash-on-Cash Return
3.3%
Cap rate
0.5%
Rent to Value Ratio
Active
$552,900
4
bds
|
3
ba
|
3,173
sqft
|
built
1982
585 N 700 E, Nephi, UT 84648
$-1,301
Cash flow
-12.3%
Cash-on-Cash Return
2.9%
Cap rate
0.4%
Rent to Value Ratio
Active
$349,000
2
bds
|
1
ba
|
980
sqft
|
built
1942
496 N 500 E, Nephi, UT 84648
$-998
Cash flow
-14.9%
Cash-on-Cash Return
2.2%
Cap rate
0.3%
Rent to Value Ratio
Active
$429,900
3
bds
|
2
ba
|
2,046
sqft
|
built
1966
485 N 300 E, Nephi, UT 84648
$-1,225
Cash flow
-14.9%
Cash-on-Cash Return
2.3%
Cap rate
0.3%
Rent to Value Ratio
Active
$798,000
10
bds
|
4
ba
|
4,774
sqft
|
built
2022
971 N 100 W, Nephi, UT 84648
$-2,977
Cash flow
-19.5%
Cash-on-Cash Return
1.2%
Cap rate
0.2%
Rent to Value Ratio
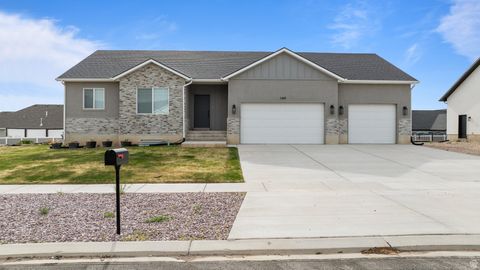
Active
$545,000
6
bds
|
3
ba
|
3,306
sqft
|
built
2016
1303 N 150 E, Nephi, UT 84648
$-1,289
Cash flow
-12.3%
Cash-on-Cash Return
2.8%
Cap rate
0.4%
Rent to Value Ratio
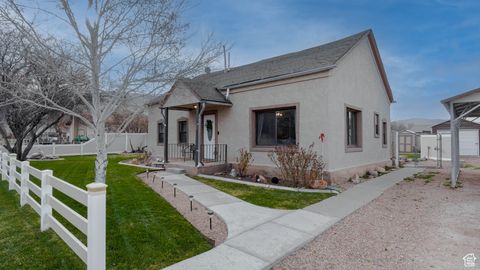
Active
$375,000
2
bds
|
2
ba
|
1,362
sqft
|
built
1928
63 E 100 S, Nephi, UT 84648
$-1,118
Cash flow
-15.6%
Cash-on-Cash Return
2.1%
Cap rate
0.3%
Rent to Value Ratio
Active
$440,000
5
bds
|
4
ba
|
2,663
sqft
|
built
2022
144 W 900 N, Nephi, UT 84648
$-975
Cash flow
-11.6%
Cash-on-Cash Return
3.0%
Cap rate
0.5%
Rent to Value Ratio
Active
$625,000
6
bds
|
3
ba
|
3,103
sqft
|
built
2022
1169 N 200 E, Nephi, UT 84648
$-793
Cash flow
-6.6%
Cash-on-Cash Return
4.2%
Cap rate
0.6%
Rent to Value Ratio
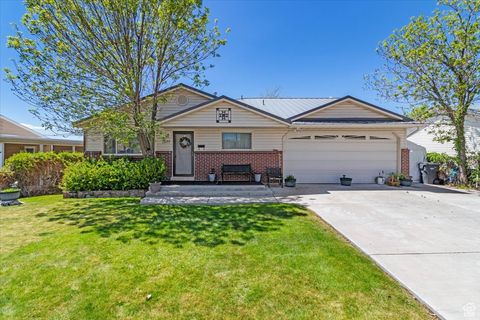
Active
$489,900
6
bds
|
3
ba
|
3,018
sqft
|
built
1963
377 E 300 S, Nephi, UT 84648
$-1,409
Cash flow
-15.0%
Cash-on-Cash Return
2.2%
Cap rate
0.3%
Rent to Value Ratio
Active
$325,000
2
bds
|
1
ba
|
962
sqft
|
built
1878
480 E 200 N, Nephi, UT 84648
$-709
Cash flow
-11.4%
Cash-on-Cash Return
3.1%
Cap rate
0.4%
Rent to Value Ratio
Active
$499,000
4
bds
|
2
ba
|
2,442
sqft
|
built
1998
68 E 100 N, Nephi, UT 84648
$-1,051
Cash flow
-11.0%
Cash-on-Cash Return
3.2%
Cap rate
0.4%
Rent to Value Ratio