84653 Investment Properties for Sale
Browse homes for sale and investment properties in 84653. Refine your search by price, property type, or more.
Best cash flowing properties in 84653
Active
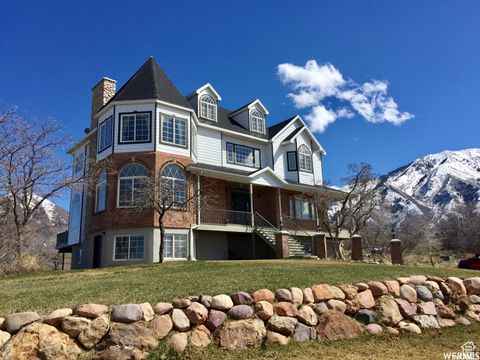
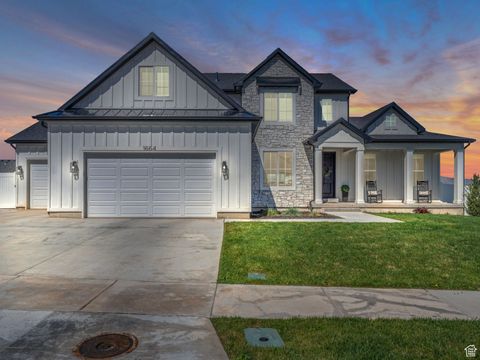
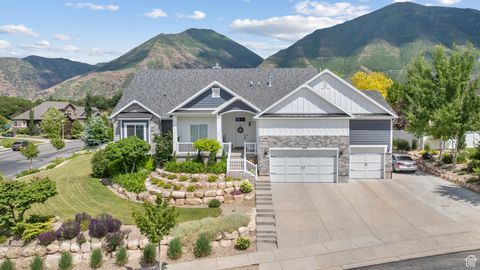
$829,900
5
bds
|
4
ba
|
4,741
sqft
|
built
1994
1473 S 50 E, Salem, UT 84653
$-1,164
Cash flow
-7.3%
Cash-on-Cash Return
4.0%
Cap rate
0.5%
Rent to Value Ratio
Active
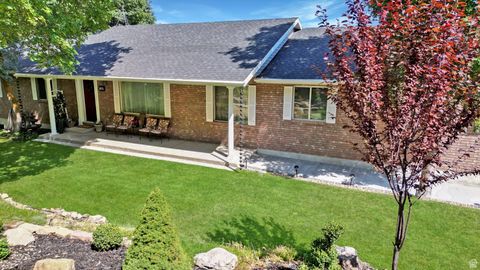
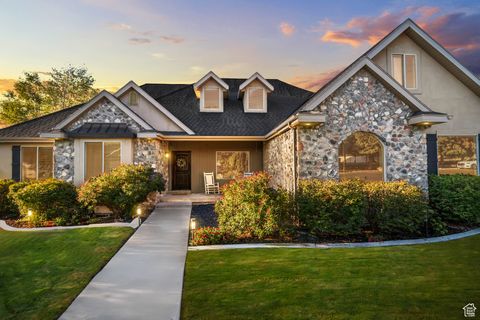
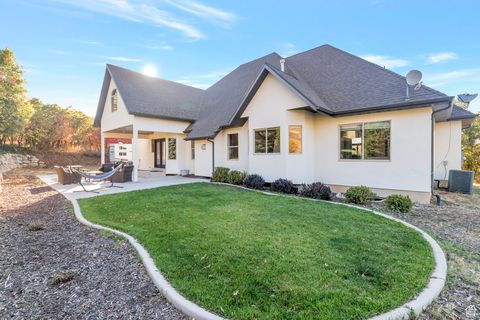
$798,000
6
bds
|
3
ba
|
3,618
sqft
|
built
1990
130 E Mountain Vale Way, Woodland Hills, UT 84653
$-1,406
Cash flow
-9.2%
Cash-on-Cash Return
3.6%
Cap rate
0.5%
Rent to Value Ratio
27 out of 83 properties for sale in 84653
Limited Results Shown
Create a free account, or log in to reveal all property listings and enjoy the complete experience.
Active
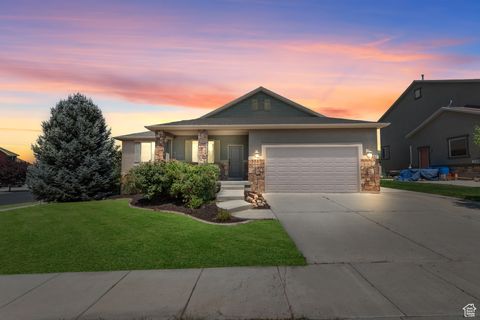
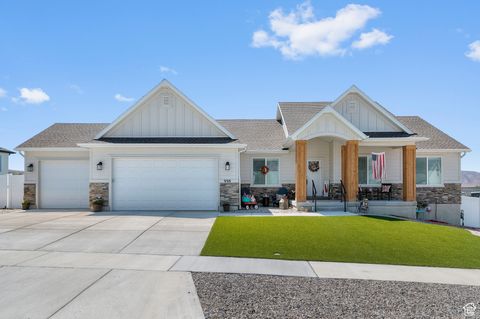
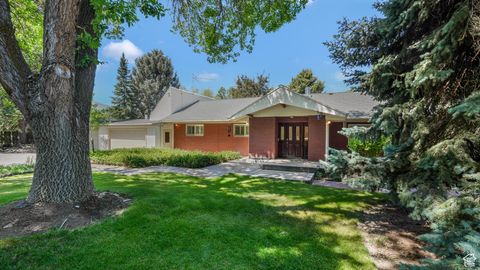
$689,900
6
bds
|
4
ba
|
3,840
sqft
|
built
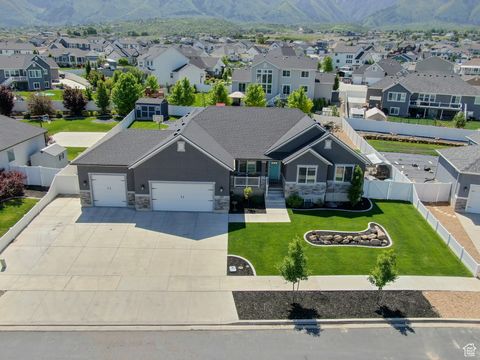
2011
301 E Salem Park Cir, Salem, UT 84653
$-1,901
Cash flow
-14.4%
Cash-on-Cash Return
2.4%
Cap rate
0.3%
Rent to Value Ratio
Active
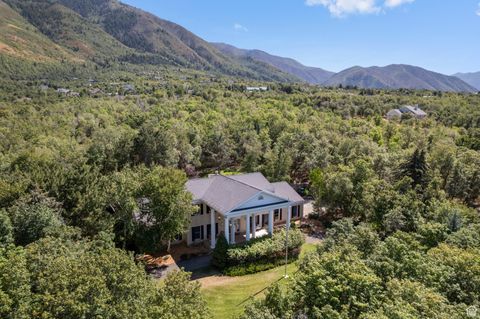
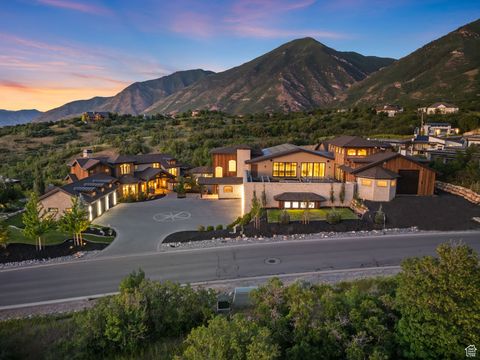
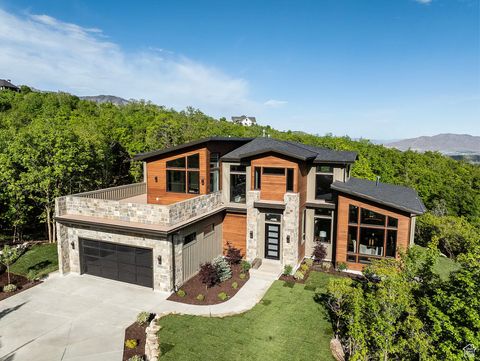
$2,599,000
5
bds
|
5
ba
|
7,492
sqft
|
built
1981
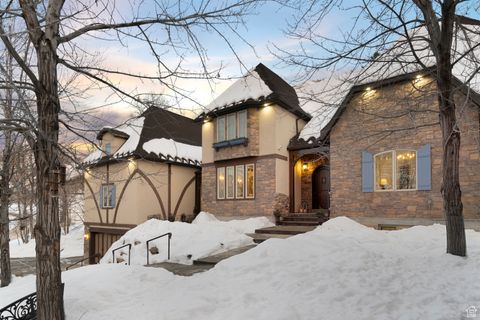
35 E Lakeview Way, Woodland Hills, UT 84653
$-10,867
Cash flow
-21.8%
Cash-on-Cash Return
0.7%
Cap rate
0.1%
Rent to Value Ratio
Active
$975,000
6
bds
|
4
ba
|
4,956
sqft
|
built
2023
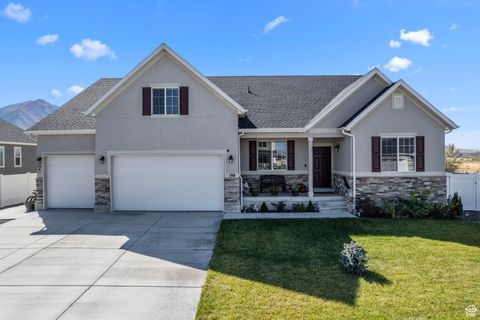
1664 S 210 W, Salem, UT 84653
$-2,838
Cash flow
-15.2%
Cash-on-Cash Return
2.2%
Cap rate
0.3%
Rent to Value Ratio
Active
$1,175,000
6
bds
|
4
ba
|
5,155
sqft
|
built
2006
360 W 800 S, Salem, UT 84653
$-3,886
Cash flow
-17.3%
Cash-on-Cash Return
1.7%
Cap rate
0.2%
Rent to Value Ratio
Active
$819,900
5
bds
|
5
ba
|
3,728
sqft
|
built
2024
998 S 880 W, Salem, UT 84653
$-2,724
Cash flow
-17.3%
Cash-on-Cash Return
1.7%
Cap rate
0.3%
Rent to Value Ratio
Active
$13,950,000
6
bds
|
10
ba
|
23,460
sqft
|
built
2017
867 S Summit Creek Dr, Woodland Hills, UT 84653
$-63,980
Cash flow
-23.9%
Cash-on-Cash Return
0.2%
Cap rate
0.0%
Rent to Value Ratio
Active
$1,200,000
5
bds
|
3
ba
|
4,896
sqft
|
built
2022
1414 S 790 E, Salem, UT 84653
$-4,303
Cash flow
-18.7%
Cash-on-Cash Return
1.4%
Cap rate
0.2%
Rent to Value Ratio
Active
$1,195,000
4
bds
|
3
ba
|
4,643
sqft
|
built
2017
1155 S Eagle Nest Dr, Woodland Hills, UT 84653
$-4,594
Cash flow
-20.1%
Cash-on-Cash Return
1.1%
Cap rate
0.2%
Rent to Value Ratio
Active
$1,000,000
4
bds
|
4
ba
|
5,102
sqft
|
built
2017
1157 S 925 E, Salem, UT 84653
$-2,985
Cash flow
-15.6%
Cash-on-Cash Return
2.1%
Cap rate
0.3%
Rent to Value Ratio
Active
$1,299,999
6
bds
|
4
ba
|
4,916
sqft
|
built
2022
325 S Autumn Blaze Cir, Woodland Hills, UT 84653
$-4,453
Cash flow
-17.9%
Cash-on-Cash Return
1.6%
Cap rate
0.2%
Rent to Value Ratio
Active
$950,000
6
bds
|
3
ba
|
4,775
sqft
|
built
2018
1043 S 900 E, Salem, UT 84653
$-2,645
Cash flow
-14.5%
Cash-on-Cash Return
2.3%
Cap rate
0.3%
Rent to Value Ratio
Active
$999,990
7
bds
|
4
ba
|
5,283
sqft
|
built
2007
1110 S Woodland Hills Dr, Woodland Hills, UT 84653
$-2,449
Cash flow
-12.8%
Cash-on-Cash Return
2.7%
Cap rate
0.4%
Rent to Value Ratio
Active
$899,500
4
bds
|
2
ba
|
3,508
sqft
|
built
1960
412 S 100 E, Salem, UT 84653
$-2,046
Cash flow
-11.9%
Cash-on-Cash Return
2.9%
Cap rate
0.4%
Rent to Value Ratio
Active
$2,995,000
6
bds
|
6
ba
|
5,753
sqft
|
built
2024
1040 S Summit Creek Dr, Woodland Hills, UT 84653
$-10,099
Cash flow
-17.6%
Cash-on-Cash Return
1.6%
Cap rate
0.2%
Rent to Value Ratio
Active
$815,000
7
bds
|
4
ba
|
4,118
sqft
|
built
2019
343 W Deer Creek Trl, Salem, UT 84653
$-1,995
Cash flow
-12.8%
Cash-on-Cash Return
2.7%
Cap rate
0.4%
Rent to Value Ratio
Active
$832,500
8
bds
|
4
ba
|
3,628
sqft
|
built
2008
384 N 710 E, Salem, UT 84653
$-1,963
Cash flow
-12.3%
Cash-on-Cash Return
2.8%
Cap rate
0.4%
Rent to Value Ratio
Active
$1,395,000
5
bds
|
5
ba
|
6,281
sqft
|
built
2020
1104 S 950 E, Salem, UT 84653
$-3,114
Cash flow
-11.6%
Cash-on-Cash Return
3.0%
Cap rate
0.4%
Rent to Value Ratio
Active
$3,000,000
8
bds
|
7
ba
|
8,699
sqft
|
built
2023
565 W Autumn Blaze, Woodland Hills, UT 84653
$-12,477
Cash flow
-21.7%
Cash-on-Cash Return
0.7%
Cap rate
0.1%
Rent to Value Ratio
Active
$599,900
4
bds
|
3
ba
|
2,656
sqft
|
built
1992
567 S Hazel Dr, Salem, UT 84653
$-1,665
Cash flow
-14.5%
Cash-on-Cash Return
2.3%
Cap rate
0.3%
Rent to Value Ratio
Active
$7,750,000
6
bds
|
9
ba
|
14,043
sqft
|
built
2020
1230 S Eagle Nest Dr, Woodland Hills, UT 84653
$-33,398
Cash flow
-22.5%
Cash-on-Cash Return
0.5%
Cap rate
0.1%
Rent to Value Ratio
Active
$899,000
5
bds
|
4
ba
|
4,499
sqft
|
built
2013
1072 S 925 E, Salem, UT 84653
$-2,817
Cash flow
-16.3%
Cash-on-Cash Return
1.9%
Cap rate
0.3%
Rent to Value Ratio
Active
$689,000
6
bds
|
4
ba
|
3,537
sqft
|
built
2010
1137 S 925 E, Salem, UT 84653
$-2,139
Cash flow
-16.2%
Cash-on-Cash Return
2.0%
Cap rate
0.3%
Rent to Value Ratio
Active
$2,000,000
5
bds
|
6
ba
|
7,101
sqft
|
built
2006
1190 S Eagle Nest Dr, Woodland Hills, UT 84653
$-7,451
Cash flow
-19.4%
Cash-on-Cash Return
1.2%
Cap rate
0.2%
Rent to Value Ratio
Active
$1,460,000
4
bds
|
2
ba
|
2,769
sqft
|
built
1930
555 W 300 S, Salem, UT 84653
$-4,916
Cash flow
-17.6%
Cash-on-Cash Return
1.6%
Cap rate
0.2%
Rent to Value Ratio
Active
$999,900
8
bds
|
6
ba
|
4,354
sqft
|
built
2022
198 E Wood Thrush Cv, Salem, UT 84653
$-2,509
Cash flow
-13.1%
Cash-on-Cash Return
2.7%
Cap rate
0.4%
Rent to Value Ratio