85018 Investment Properties for Sale
Browse homes for sale and investment properties in 85018. Refine your search by price, property type, or more.
Best cash flowing properties in 85018
Active
$165,000
1
bds
|
1
ba
|
735
sqft
|
built
1967
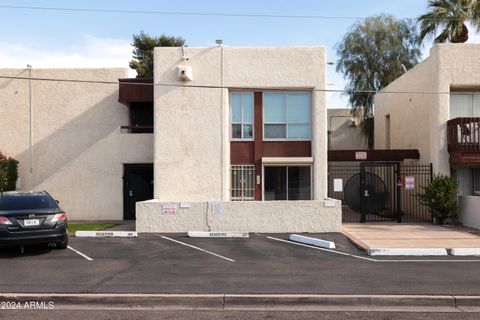
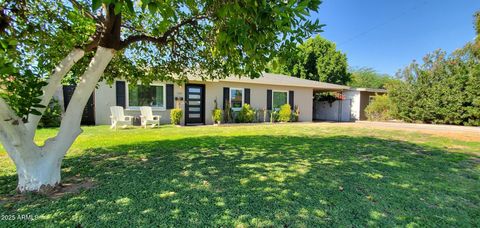
3828 N 32nd St, Phoenix, AZ 85018
$-109
Cash flow
-3.4%
Cash-on-Cash Return
4.9%
Cap rate
0.8%
Rent to Value Ratio

Active
$314,900
2
bds
|
1
ba
|
910
sqft
|
built
1967
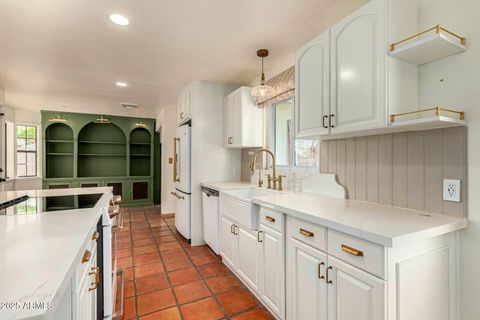
4206 N 38th St, Phoenix, AZ 85018
$-175
Cash flow
-2.9%
Cash-on-Cash Return
5.0%
Cap rate
0.8%
Rent to Value Ratio
119 out of 128 properties for sale in 85018
Limited Results Shown
Create a free account, or log in to reveal all property listings and enjoy the complete experience.

Active
$724,999
3
bds
|
2
ba
|
1,681
sqft
|
built
1950
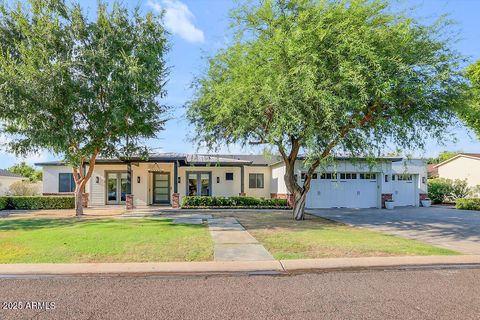
4020 N 34th St, Phoenix, AZ 85018
$-1,311
Cash flow
-9.4%
Cash-on-Cash Return
3.5%
Cap rate
0.5%
Rent to Value Ratio
Active
$840,000
4
bds
|
2
ba
|
1,494
sqft
|
built
1954
4314 E Montecito Ave, Phoenix, AZ 85018
$-2,010
Cash flow
-12.5%
Cash-on-Cash Return
2.8%
Cap rate
0.4%
Rent to Value Ratio
Active
$750,000
4
bds
|
2
ba
|
1,470
sqft
|
built
1954
4418 E Montecito Ave, Phoenix, AZ 85018
$-2,137
Cash flow
-14.9%
Cash-on-Cash Return
2.3%
Cap rate
0.3%
Rent to Value Ratio
Active
$417,000
2
bds
|
2
ba
|
1,277
sqft
|
built
1990
5104 N 32nd St, Phoenix, AZ 85018
$-1,161
Cash flow
-14.5%
Cash-on-Cash Return
2.3%
Cap rate
0.5%
Rent to Value Ratio

Active
$2,200,000
3
bds
|
3
ba
|
3,193
sqft
|
built
1975
4448 E Camelback Rd, Phoenix, AZ 85018
$-7,783
Cash flow
-18.5%
Cash-on-Cash Return
1.4%
Cap rate
0.3%
Rent to Value Ratio

Active
$2,125,000
4
bds
|
3
ba
|
3,745
sqft
|
built
1970
3500 E Lincoln Dr, Phoenix, AZ 85018
$-7,450
Cash flow
-18.3%
Cash-on-Cash Return
1.5%
Cap rate
0.3%
Rent to Value Ratio

Active
$1,497,000
3
bds
|
3
ba
|
3,100
sqft
|
built
1957
4022 E Stanford Dr, Phoenix, AZ 85018
$-2,558
Cash flow
-8.9%
Cash-on-Cash Return
3.6%
Cap rate
0.5%
Rent to Value Ratio
Active
$13,500,000
4
bds
|
7
ba
|
9,084
sqft
|
built
1980
4949 E Red Rock Dr, Phoenix, AZ 85018
$-57,969
Cash flow
-22.4%
Cash-on-Cash Return
0.5%
Cap rate
0.1%
Rent to Value Ratio

Active
$2,385,000
4
bds
|
5
ba
|
4,027
sqft
|
built
2015
4515 N 36th Way, Phoenix, AZ 85018
$-6,062
Cash flow
-13.3%
Cash-on-Cash Return
2.6%
Cap rate
0.4%
Rent to Value Ratio
Active
$15,000,000
4
bds
|
7
ba
|
5,361
sqft
|
built
1990
5630 E Rockridge Rd, Phoenix, AZ 85018
$-65,978
Cash flow
-22.9%
Cash-on-Cash Return
0.4%
Cap rate
0.1%
Rent to Value Ratio
Active
$190,000
2
bds
|
2
ba
|
1,044
sqft
|
built
1969
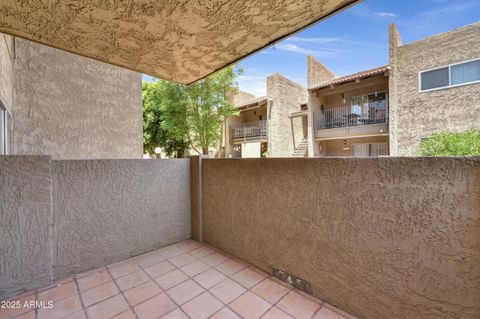
3416 N 44th St, Phoenix, AZ 85018
$-482
Cash flow
-13.2%
Cash-on-Cash Return
2.6%
Cap rate
0.7%
Rent to Value Ratio

Active
$6,575,000
5
bds
|
6
ba
|
7,828
sqft
|
built
2015
4743 N 54th St, Phoenix, AZ 85018
$-24,629
Cash flow
-19.5%
Cash-on-Cash Return
1.2%
Cap rate
0.2%
Rent to Value Ratio

Active
$497,000
3
bds
|
1
ba
|
1,344
sqft
|
built
1950
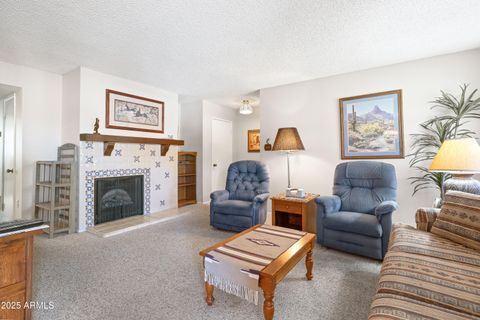
3526 E Cheery Lynn Rd, Phoenix, AZ 85018
$-947
Cash flow
-9.9%
Cash-on-Cash Return
3.4%
Cap rate
0.4%
Rent to Value Ratio

Active
$2,095,000
bds
|
0
ba
|
0
sqft
|
built
1960
3949 E Earll Dr, Phoenix, AZ 85018
$-9,463
Cash flow
-23.6%
Cash-on-Cash Return
0.3%
Cap rate
0.1%
Rent to Value Ratio
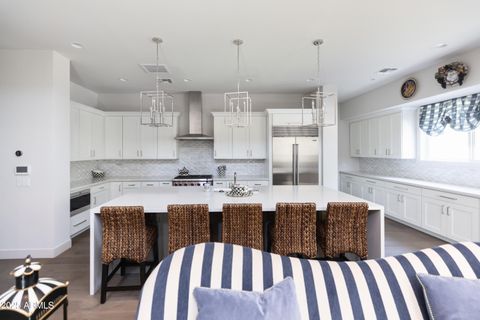
Active
$1,495,000
4
bds
|
4
ba
|
2,802
sqft
|
built
2017
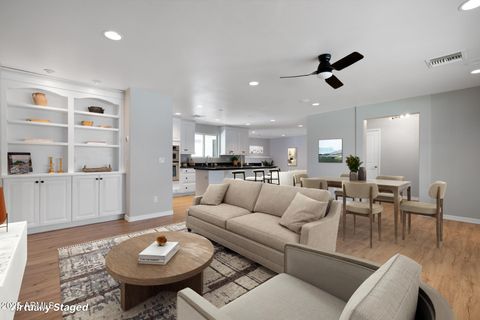
4306 E Flower St, Phoenix, AZ 85018
$-1,930
Cash flow
-6.7%
Cash-on-Cash Return
4.1%
Cap rate
0.5%
Rent to Value Ratio
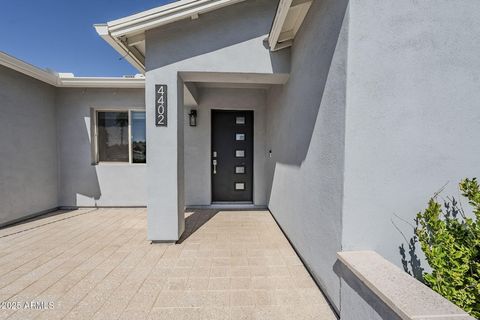
Active
$949,900
4
bds
|
3
ba
|
2,105
sqft
|
built
1954
4402 E Montecito Ave, Phoenix, AZ 85018
$-1,174
Cash flow
-6.4%
Cash-on-Cash Return
4.2%
Cap rate
0.5%
Rent to Value Ratio
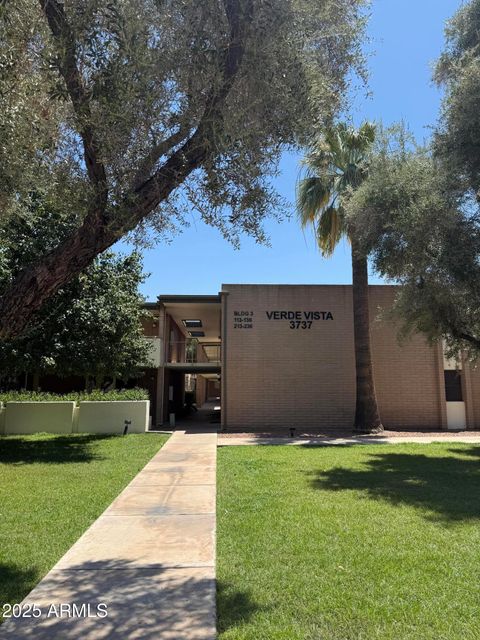
Active
$325,000
2
bds
|
1
ba
|
957
sqft
|
built
1962
3737 E Turney Ave, Phoenix, AZ 85018
$-611
Cash flow
-9.8%
Cash-on-Cash Return
3.4%
Cap rate
0.6%
Rent to Value Ratio

Active
$995,000
bds
|
0
ba
|
0
sqft
|
built
1957
3518 E Montecito Ave, Phoenix, AZ 85018
$-3,043
Cash flow
-16.0%
Cash-on-Cash Return
2.0%
Cap rate
0.3%
Rent to Value Ratio
Active
$2,095,000
3
bds
|
3
ba
|
3,597
sqft
|
built
2019
3912 E Crittenden Ln, Phoenix, AZ 85018
$-4,999
Cash flow
-12.4%
Cash-on-Cash Return
2.8%
Cap rate
0.4%
Rent to Value Ratio

Active
$3,495,000
5
bds
|
6
ba
|
4,264
sqft
|
built
2025
3923 E Heatherbrae Dr, Phoenix, AZ 85018
$-14,490
Cash flow
-21.6%
Cash-on-Cash Return
0.7%
Cap rate
0.1%
Rent to Value Ratio
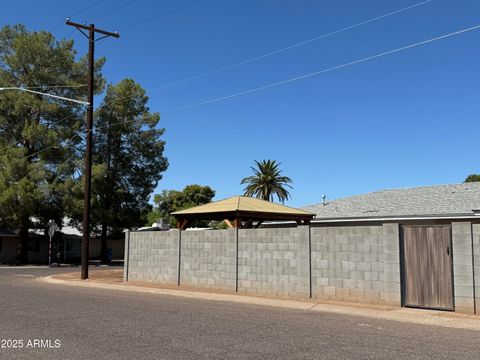
Active
$740,000
3
bds
|
2
ba
|
1,578
sqft
|
built
1955
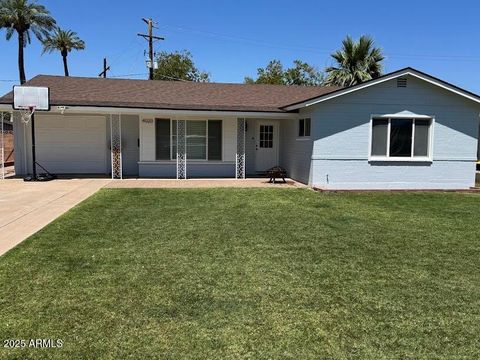
4526 E Earll Dr, Phoenix, AZ 85018
$-1,550
Cash flow
-10.9%
Cash-on-Cash Return
3.2%
Cap rate
0.4%
Rent to Value Ratio
Active
$749,900
4
bds
|
2
ba
|
1,892
sqft
|
built
1950
3526 E Piccadilly Rd, Phoenix, AZ 85018
$-1,548
Cash flow
-10.8%
Cash-on-Cash Return
3.2%
Cap rate
0.4%
Rent to Value Ratio

Active
$3,925,000
4
bds
|
3
ba
|
3,455
sqft
|
built
1964
4959 E Red Rock Dr, Phoenix, AZ 85018
$-13,198
Cash flow
-17.5%
Cash-on-Cash Return
1.6%
Cap rate
0.2%
Rent to Value Ratio
Active
$235,000
2
bds
|
2
ba
|
982
sqft
|
built
1974
5525 E Thomas Rd, Phoenix, AZ 85018
$-349
Cash flow
-7.7%
Cash-on-Cash Return
3.9%
Cap rate
0.7%
Rent to Value Ratio

Active
$3,645,000
4
bds
|
4
ba
|
4,555
sqft
|
built
2022
5812 N 44th Pl, Phoenix, AZ 85018
$-11,357
Cash flow
-16.3%
Cash-on-Cash Return
1.9%
Cap rate
0.3%
Rent to Value Ratio

Active
$340,000
3
bds
|
2
ba
|
1,050
sqft
|
built
1969
3402 N 32nd St, Phoenix, AZ 85018
$-764
Cash flow
-11.7%
Cash-on-Cash Return
3.0%
Cap rate
0.5%
Rent to Value Ratio
Active
$265,000
2
bds
|
2
ba
|
982
sqft
|
built
1974
5525 E Thomas Rd, Phoenix, AZ 85018
$-478
Cash flow
-9.4%
Cash-on-Cash Return
3.5%
Cap rate
0.6%
Rent to Value Ratio
Active
$2,299,990
4
bds
|
4
ba
|
3,103
sqft
|
built
1957
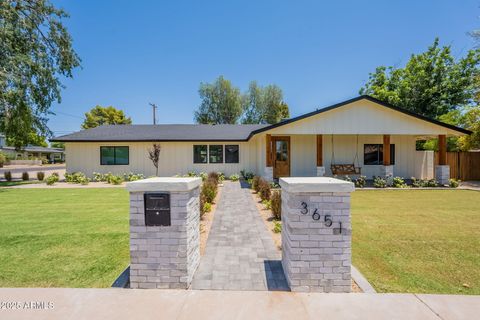
3651 N 49th Pl, Phoenix, AZ 85018
$-7,789
Cash flow
-17.7%
Cash-on-Cash Return
1.6%
Cap rate
0.2%
Rent to Value Ratio

Active
$2,599,000
bds
|
0
ba
|
0
sqft
|
built
1955
3139 N 40th St, Phoenix, AZ 85018
$-9,786
Cash flow
-19.6%
Cash-on-Cash Return
1.2%
Cap rate
0.2%
Rent to Value Ratio
Active
$3,985,000
4
bds
|
5
ba
|
4,272
sqft
|
built
2017
3924 E Roma Ave, Phoenix, AZ 85018
$-12,927
Cash flow
-16.9%
Cash-on-Cash Return
1.8%
Cap rate
0.3%
Rent to Value Ratio

Active
$1,625,000
4
bds
|
4
ba
|
3,671
sqft
|
built
2010
3812 E Camelback Rd, Phoenix, AZ 85018
$-2,538
Cash flow
-8.1%
Cash-on-Cash Return
3.8%
Cap rate
0.5%
Rent to Value Ratio

Active
$1,050,000
4
bds
|
3
ba
|
2,159
sqft
|
built
1959
4814 N 35th St, Phoenix, AZ 85018
$-2,816
Cash flow
-14.0%
Cash-on-Cash Return
2.5%
Cap rate
0.4%
Rent to Value Ratio
Active
$875,000
3
bds
|
2
ba
|
1,717
sqft
|
built
1955
4020 N 44th Pl, Phoenix, AZ 85018
$-1,843
Cash flow
-11.0%
Cash-on-Cash Return
3.2%
Cap rate
0.4%
Rent to Value Ratio
Active
$1,200,000
bds
|
0
ba
|
0
sqft
|
built
1979
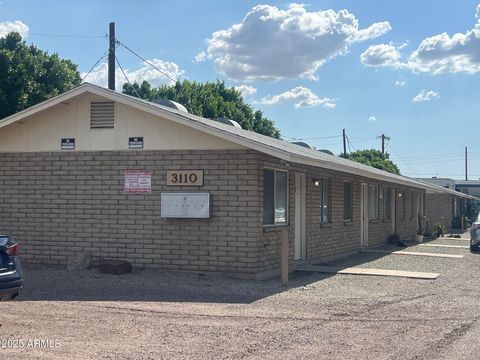
3110 N 37th St, Phoenix, AZ 85018
$-3,747
Cash flow
-16.3%
Cash-on-Cash Return
1.9%
Cap rate
0.2%
Rent to Value Ratio
Active
$1,130,000
3
bds
|
4
ba
|
2,154
sqft
|
built
1967
3437 E Meadowbrook Ave, Phoenix, AZ 85018
$-3,402
Cash flow
-15.7%
Cash-on-Cash Return
2.1%
Cap rate
0.3%
Rent to Value Ratio
Active
$5,124,850
5
bds
|
7
ba
|
4,941
sqft
|
built
2020
5712 E Calle Camelia, Phoenix, AZ 85018
$-19,095
Cash flow
-19.4%
Cash-on-Cash Return
1.2%
Cap rate
0.2%
Rent to Value Ratio
Active
$189,990
1
bds
|
1
ba
|
622
sqft
|
built
1979
3619 E Monterosa St, Phoenix, AZ 85018
$-375
Cash flow
-10.3%
Cash-on-Cash Return
3.3%
Cap rate
0.7%
Rent to Value Ratio
Active
$530,000
2
bds
|
2
ba
|
1,494
sqft
|
built
1981
3401 N 37th St, Phoenix, AZ 85018
$-1,605
Cash flow
-15.8%
Cash-on-Cash Return
2.0%
Cap rate
0.4%
Rent to Value Ratio