85021 Investment Properties for Sale
Browse homes for sale and investment properties in 85021. Refine your search by price, property type, or more.
Best cash flowing properties in 85021
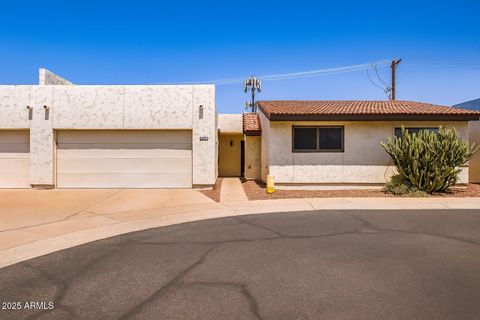
Active
$270,000
2
bds
|
2
ba
|
1,030
sqft
|
built
1981
7780 N 19th Dr, Phoenix, AZ 85021
$-213
Cash flow
-4.1%
Cash-on-Cash Return
4.7%
Cap rate
0.7%
Rent to Value Ratio
Active
$499,000
3
bds
|
2
ba
|
1,631
sqft
|
built
1966
1708 W Harmont Dr, Phoenix, AZ 85021
$-410
Cash flow
-4.3%
Cash-on-Cash Return
4.7%
Cap rate
0.6%
Rent to Value Ratio
88 out of 102 properties for sale in 85021
Limited Results Shown
Create a free account, or log in to reveal all property listings and enjoy the complete experience.
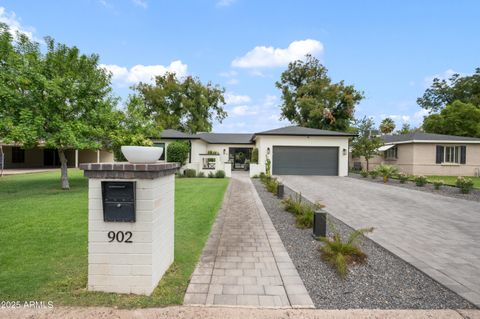
Active
$1,550,000
4
bds
|
4
ba
|
2,954
sqft
|
built
2020
902 W State Ave, Phoenix, AZ 85021
$-3,194
Cash flow
-10.8%
Cash-on-Cash Return
3.2%
Cap rate
0.4%
Rent to Value Ratio
Active
$1,199,000
4
bds
|
4
ba
|
3,079
sqft
|
built
1954
8024 N 7th Ave, Phoenix, AZ 85021
$-3,023
Cash flow
-13.2%
Cash-on-Cash Return
2.7%
Cap rate
0.4%
Rent to Value Ratio
Active
$660,000
3
bds
|
2
ba
|
2,240
sqft
|
built
1964
1327 W Dunlap Ave, Phoenix, AZ 85021
$-1,848
Cash flow
-14.6%
Cash-on-Cash Return
2.3%
Cap rate
0.3%
Rent to Value Ratio
Active
$269,900
2
bds
|
2
ba
|
1,202
sqft
|
built
1983
8214 N 21st Dr, Phoenix, AZ 85021
$-455
Cash flow
-8.8%
Cash-on-Cash Return
3.7%
Cap rate
0.7%
Rent to Value Ratio
Active
$1,250,000
3
bds
|
4
ba
|
2,970
sqft
|
built
1949
8045 N 7th Ave, Phoenix, AZ 85021
$-2,471
Cash flow
-10.3%
Cash-on-Cash Return
3.3%
Cap rate
0.4%
Rent to Value Ratio
Active
$379,900
3
bds
|
2
ba
|
1,600
sqft
|
built
1952
1200 W Cochise Dr, Phoenix, AZ 85021
$-470
Cash flow
-6.5%
Cash-on-Cash Return
4.2%
Cap rate
0.5%
Rent to Value Ratio
Active
$850,000
4
bds
|
3
ba
|
2,451
sqft
|
built
1959
711 W Northern Ave, Phoenix, AZ 85021
$-1,302
Cash flow
-8.0%
Cash-on-Cash Return
3.8%
Cap rate
0.5%
Rent to Value Ratio

Active
$1,180,000
3
bds
|
2
ba
|
2,082
sqft
|
built
1954
7630 N 4th Ave, Phoenix, AZ 85021
$-2,456
Cash flow
-10.9%
Cash-on-Cash Return
3.2%
Cap rate
0.4%
Rent to Value Ratio
Active
$425,000
3
bds
|
2
ba
|
1,494
sqft
|
built
1961
8912 N 17th Ave, Phoenix, AZ 85021
$-643
Cash flow
-7.9%
Cash-on-Cash Return
3.9%
Cap rate
0.5%
Rent to Value Ratio
Active
$1,600,000
4
bds
|
4
ba
|
3,484
sqft
|
built
1974
8051 N 15th Ave, Phoenix, AZ 85021
$-4,434
Cash flow
-14.5%
Cash-on-Cash Return
2.4%
Cap rate
0.3%
Rent to Value Ratio

Active
$2,175,000
4
bds
|
3
ba
|
3,526
sqft
|
built
1994
103 W Vista Ave, Phoenix, AZ 85021
$-7,624
Cash flow
-18.3%
Cash-on-Cash Return
1.5%
Cap rate
0.2%
Rent to Value Ratio
Active
$615,000
4
bds
|
2
ba
|
1,811
sqft
|
built
1972
1742 W Butler Dr, Phoenix, AZ 85021
$-923
Cash flow
-7.8%
Cash-on-Cash Return
3.9%
Cap rate
0.5%
Rent to Value Ratio
Active
$2,550,000
5
bds
|
5
ba
|
4,800
sqft
|
built
2023
733 W El Camino Dr, Phoenix, AZ 85021
$-5,360
Cash flow
-11.0%
Cash-on-Cash Return
3.2%
Cap rate
0.4%
Rent to Value Ratio

Active
$549,900
3
bds
|
2
ba
|
1,773
sqft
|
built
1954
7719 N 17th Ave, Phoenix, AZ 85021
$-958
Cash flow
-9.1%
Cash-on-Cash Return
3.6%
Cap rate
0.5%
Rent to Value Ratio

Active
$1,777,000
6
bds
|
5
ba
|
3,556
sqft
|
built
1959
7508 N 13th Ave, Phoenix, AZ 85021
$-3,272
Cash flow
-9.6%
Cash-on-Cash Return
3.5%
Cap rate
0.5%
Rent to Value Ratio

Active
$572,499
4
bds
|
2
ba
|
1,681
sqft
|
built
1966
8146 N 17th Dr, Phoenix, AZ 85021
$-1,194
Cash flow
-10.9%
Cash-on-Cash Return
3.2%
Cap rate
0.4%
Rent to Value Ratio

Active
$375,000
3
bds
|
2
ba
|
1,379
sqft
|
built
1957
2115 W Myrtle Ave, Phoenix, AZ 85021
$-514
Cash flow
-7.2%
Cash-on-Cash Return
4.0%
Cap rate
0.5%
Rent to Value Ratio
Active
$1,299,900
4
bds
|
3
ba
|
2,433
sqft
|
built
1972
7820 N 5th Ave, Phoenix, AZ 85021
$-2,213
Cash flow
-8.9%
Cash-on-Cash Return
3.6%
Cap rate
0.5%
Rent to Value Ratio
Active
$565,000
3
bds
|
2
ba
|
1,631
sqft
|
built
1966
8129 N 17th Dr, Phoenix, AZ 85021
$-1,149
Cash flow
-10.6%
Cash-on-Cash Return
3.2%
Cap rate
0.4%
Rent to Value Ratio
Active
$775,000
3
bds
|
3
ba
|
2,021
sqft
|
built
2002
36 W Foothill Dr, Phoenix, AZ 85021
$-1,744
Cash flow
-11.7%
Cash-on-Cash Return
3.0%
Cap rate
0.5%
Rent to Value Ratio

Active
$1,599,000
5
bds
|
5
ba
|
6,046
sqft
|
built
1975
8426 N 15th Dr, Phoenix, AZ 85021
$-4,044
Cash flow
-13.2%
Cash-on-Cash Return
2.6%
Cap rate
0.4%
Rent to Value Ratio
Active
$749,000
3
bds
|
3
ba
|
2,000
sqft
|
built
1968
1327 W Glendale Ave, Phoenix, AZ 85021
$-1,521
Cash flow
-10.6%
Cash-on-Cash Return
3.2%
Cap rate
0.5%
Rent to Value Ratio

Active
$544,750
4
bds
|
3
ba
|
2,062
sqft
|
built
1953
7819 N 17th Ave, Phoenix, AZ 85021
$-740
Cash flow
-7.1%
Cash-on-Cash Return
4.0%
Cap rate
0.5%
Rent to Value Ratio
Active
$474,999
4
bds
|
2
ba
|
1,392
sqft
|
built
1947
7006 N 14th Ave, Phoenix, AZ 85021
$-687
Cash flow
-7.5%
Cash-on-Cash Return
3.9%
Cap rate
0.5%
Rent to Value Ratio
Active
$537,000
3
bds
|
2
ba
|
1,756
sqft
|
built
1969
1649 W Royal Palm Rd, Phoenix, AZ 85021
$-810
Cash flow
-7.9%
Cash-on-Cash Return
3.9%
Cap rate
0.5%
Rent to Value Ratio
Active
$350,000
2
bds
|
3
ba
|
1,457
sqft
|
built
2022
2256 W Laurie Ln, Phoenix, AZ 85021
$-606
Cash flow
-9.0%
Cash-on-Cash Return
3.6%
Cap rate
0.6%
Rent to Value Ratio

Active
$329,000
3
bds
|
1
ba
|
1,040
sqft
|
built
1958
10012 N 16th Dr, Phoenix, AZ 85021
$-503
Cash flow
-8.0%
Cash-on-Cash Return
3.8%
Cap rate
0.5%
Rent to Value Ratio
Active
$500,000
bds
|
0
ba
|
0
sqft
|
built
1947
721 W Cinnabar Ave, Phoenix, AZ 85021
$-1,520
Cash flow
-15.9%
Cash-on-Cash Return
2.0%
Cap rate
0.3%
Rent to Value Ratio
Active
$1,196,900
5
bds
|
4
ba
|
3,371
sqft
|
built
1975
8464 N 7th Ave, Phoenix, AZ 85021
$-3,318
Cash flow
-14.5%
Cash-on-Cash Return
2.4%
Cap rate
0.3%
Rent to Value Ratio
Active
$850,000
3
bds
|
3
ba
|
2,552
sqft
|
built
2005
1535 W Winter Dr, Phoenix, AZ 85021
$-2,121
Cash flow
-13.0%
Cash-on-Cash Return
2.7%
Cap rate
0.4%
Rent to Value Ratio
Active
$334,000
3
bds
|
1
ba
|
1,000
sqft
|
built
1957
1526 W North Ln, Phoenix, AZ 85021
$-529
Cash flow
-8.3%
Cash-on-Cash Return
3.8%
Cap rate
0.5%
Rent to Value Ratio
Active
$1,300,000
4
bds
|
3
ba
|
2,649
sqft
|
built
1961
201 W Gardenia Dr, Phoenix, AZ 85021
$-4,199
Cash flow
-16.9%
Cash-on-Cash Return
1.8%
Cap rate
0.3%
Rent to Value Ratio
Active
$549,000
bds
|
0
ba
|
0
sqft
|
built
1957
1322 W North Ln, Phoenix, AZ 85021
$-1,611
Cash flow
-15.3%
Cash-on-Cash Return
2.2%
Cap rate
0.3%
Rent to Value Ratio
Active
$825,000
5
bds
|
4
ba
|
2,786
sqft
|
built
1959
1532 W Northern Ave, Phoenix, AZ 85021
$-1,158
Cash flow
-7.3%
Cash-on-Cash Return
4.0%
Cap rate
0.5%
Rent to Value Ratio
Active
$649,900
3
bds
|
2
ba
|
2,034
sqft
|
built
1996
742 W Puget Ave, Phoenix, AZ 85021
$-1,401
Cash flow
-11.2%
Cash-on-Cash Return
3.1%
Cap rate
0.5%
Rent to Value Ratio

Active
$365,000
3
bds
|
2
ba
|
1,200
sqft
|
built
1958
2218 W State Ave, Phoenix, AZ 85021
$-558
Cash flow
-8.0%
Cash-on-Cash Return
3.8%
Cap rate
0.5%
Rent to Value Ratio
Active
$389,900
4
bds
|
2
ba
|
1,680
sqft
|
built
1959
2320 W Freeway Ln, Phoenix, AZ 85021
$-554
Cash flow
-7.4%
Cash-on-Cash Return
4.0%
Cap rate
0.5%
Rent to Value Ratio
Active
$1,975,000
bds
|
0
ba
|
0
sqft
|
built
1961
7537 N 21st Ave, Phoenix, AZ 85021
$-8,933
Cash flow
-23.6%
Cash-on-Cash Return
0.3%
Cap rate
0.1%
Rent to Value Ratio