Jefferson County Investment Properties for Sale
Browse homes for sale and investment properties in Jefferson County. Refine your search by price, property type, or more.
Best cash flowing properties in Jefferson County
Active
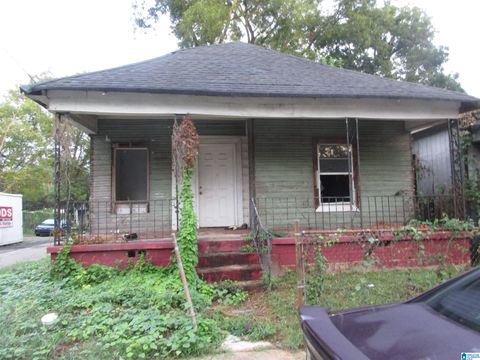
$17,000
2
bds
|
1
ba
|
990
sqft
|
built
1920
820 19th St SW, Birmingham, AL 35211
$759
Cash flow
52.0%
Cash-on-Cash Return
53.6%
Cap rate
6.5%
Rent to Value Ratio
Active
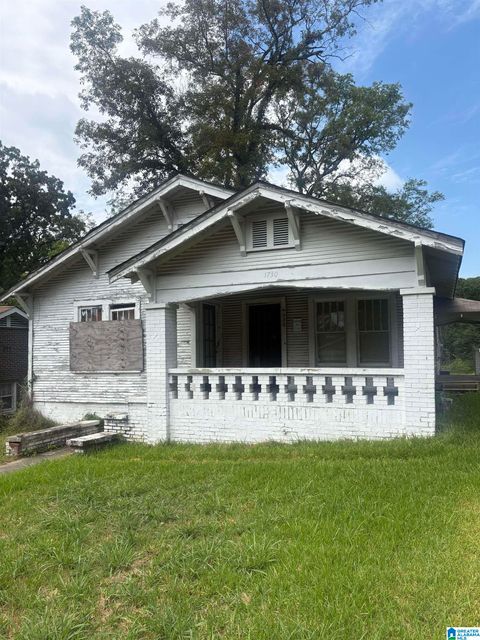
$50,000
3
bds
|
1
ba
|
1,296
sqft
|
built
1924
1730 Damon St, Birmingham, AL 35217
$690
Cash flow
16.1%
Cash-on-Cash Return
16.6%
Cap rate
2.0%
Rent to Value Ratio
1,409 out of 1,893 properties for sale in Jefferson County
Limited Results Shown
Create a free account, or log in to reveal all property listings and enjoy the complete experience.
Active
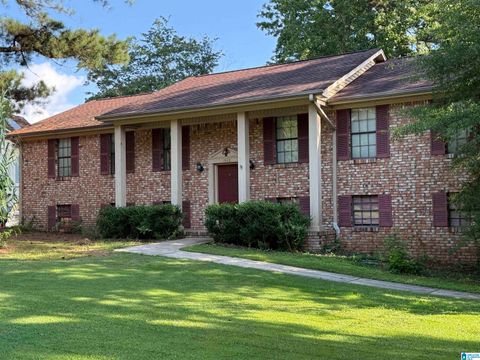
$255,000
3
bds
|
3
ba
|
2,402
sqft
|
built
1984
1505 Lake Site Dr, Birmingham, AL 35235
$163
Cash flow
3.3%
Cash-on-Cash Return
6.4%
Cap rate
0.8%
Rent to Value Ratio
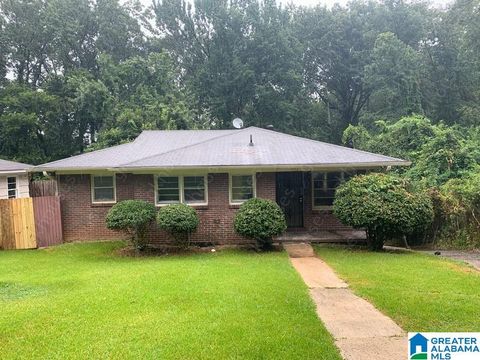
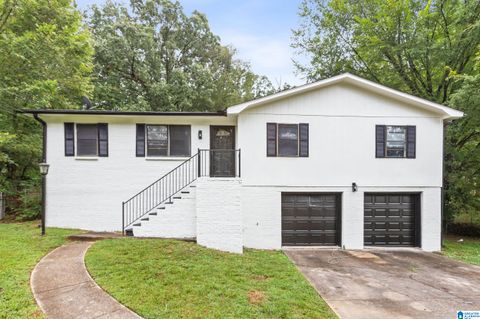
Active
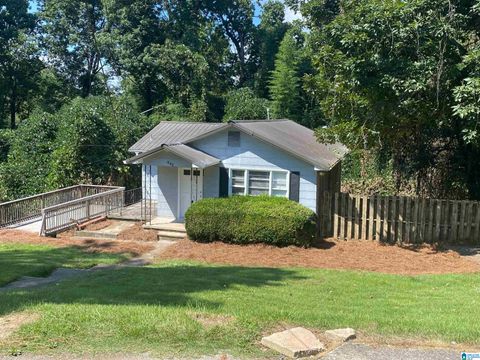
$107,000
3
bds
|
2
ba
|
1,680
sqft
|
built
1945
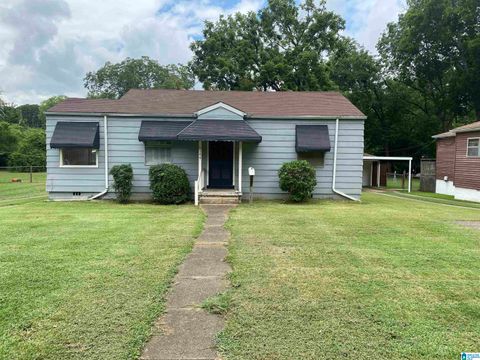
942 Hillcrest Ave, Birmingham, AL 35235
$253
Cash flow
12.3%
Cash-on-Cash Return
8.5%
Cap rate
1.0%
Rent to Value Ratio
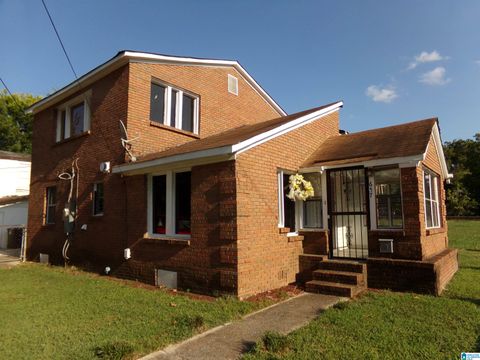
Active
$150,000
3
bds
|
2
ba
|
1,786
sqft
|
built
1925
2108 Maywood Dr, Birmingham, AL 35214
$394
Cash flow
13.7%
Cash-on-Cash Return
8.8%
Cap rate
1.1%
Rent to Value Ratio
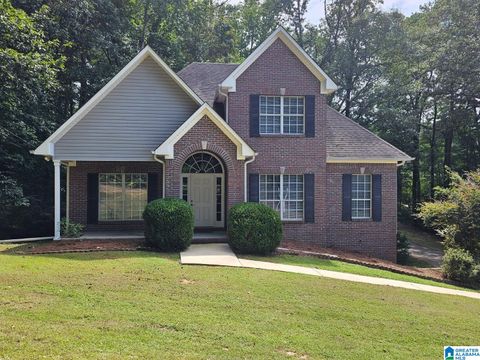
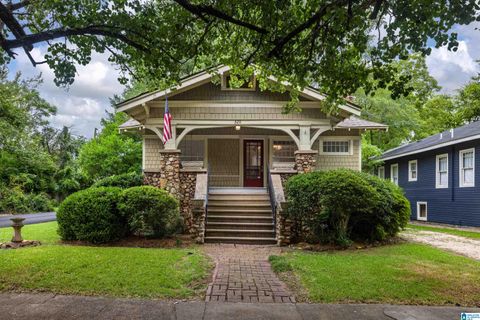
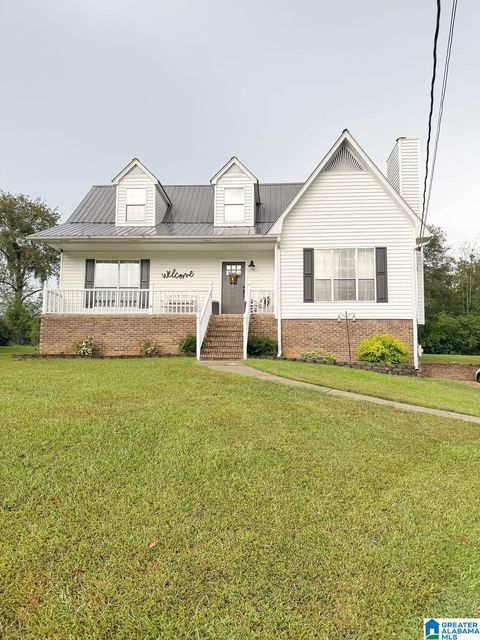
Active
$299,900
3
bds
|
2.5
ba
|
1,882
sqft
|
built
2003
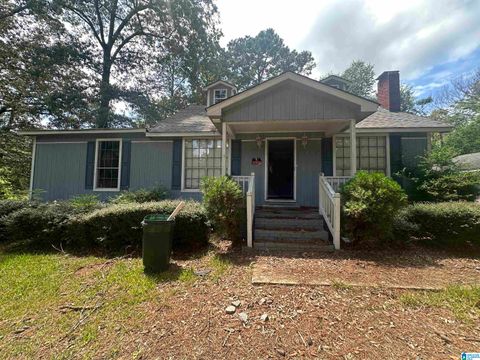
6471 Hillview St, Pinson, AL 35126
$-39
Cash flow
-0.7%
Cash-on-Cash Return
5.5%
Cap rate
0.7%
Rent to Value Ratio
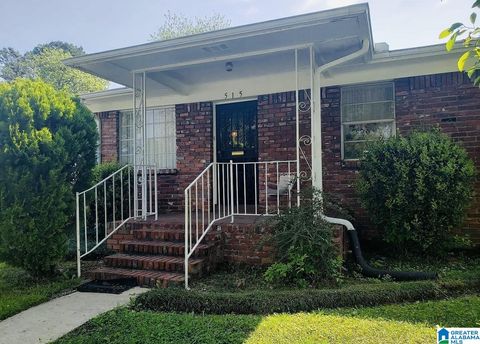
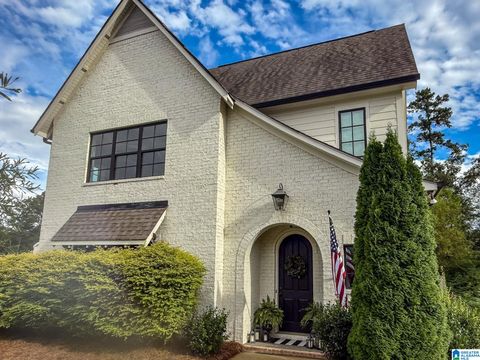
Active
$120,000
3
bds
|
1
ba
|
1,053
sqft
|
built
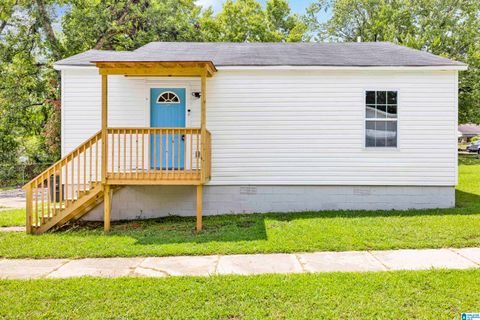
1950
515 Avenue X, Birmingham, AL 35214
$122
Cash flow
5.3%
Cash-on-Cash Return
6.9%
Cap rate
0.8%
Rent to Value Ratio
Active
$120,000
2
bds
|
1
ba
|
1,150
sqft
|
built
1955
7931 6th Ave N, Birmingham, AL 35206
$260
Cash flow
11.3%
Cash-on-Cash Return
8.3%
Cap rate
1.0%
Rent to Value Ratio
Active
$95,000
3
bds
|
1.5
ba
|
1,238
sqft
|
built
1963
913 77th St S, Birmingham, AL 35206
$516
Cash flow
28.3%
Cash-on-Cash Return
12.2%
Cap rate
1.5%
Rent to Value Ratio
Active
$144,900
4
bds
|
2
ba
|
1,378
sqft
|
built
1932
657 29th St SW, Birmingham, AL 35211
$280
Cash flow
10.1%
Cash-on-Cash Return
8.0%
Cap rate
1.0%
Rent to Value Ratio
Active
$435,000
3
bds
|
3
ba
|
2,164
sqft
|
built
1926
520 49th St S, Birmingham, AL 35222
$-541
Cash flow
-6.5%
Cash-on-Cash Return
4.2%
Cap rate
0.5%
Rent to Value Ratio
Active
$615,000
4
bds
|
3.5
ba
|
2,549
sqft
|
built
2020
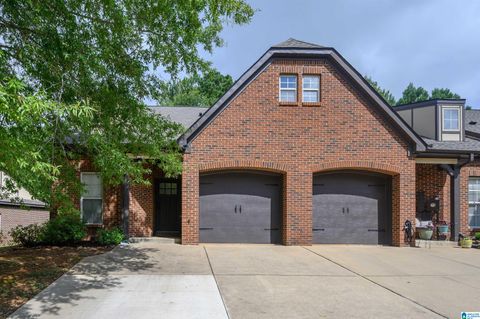
1930 Cyrus Cove Dr, Hoover, AL 35244
$-566
Cash flow
-4.8%
Cash-on-Cash Return
4.6%
Cap rate
0.6%
Rent to Value Ratio
Active
$550,000
2
bds
|
0
ba
|
0
sqft
|
built
1960
3608 Avenue F, Fairfield, AL 35064
$-1,844
Cash flow
-17.5%
Cash-on-Cash Return
1.7%
Cap rate
0.2%
Rent to Value Ratio
Active
$255,000
4
bds
|
2.5
ba
|
2,569
sqft
|
built
1978
1829 Creely Dr, Birmingham, AL 35235
$173
Cash flow
3.5%
Cash-on-Cash Return
6.5%
Cap rate
0.8%
Rent to Value Ratio
Active
$109,000
3
bds
|
1.5
ba
|
1,654
sqft
|
built
1961
909 60th St W, Birmingham, AL 35228
$450
Cash flow
21.5%
Cash-on-Cash Return
10.6%
Cap rate
1.3%
Rent to Value Ratio
Active
$265,000
3
bds
|
2
ba
|
1,863
sqft
|
built
1960
6327 Lou George Loop, Bessemer, AL 35022
$126
Cash flow
2.5%
Cash-on-Cash Return
6.2%
Cap rate
0.8%
Rent to Value Ratio
Active
$140,000
4
bds
|
2
ba
|
2,088
sqft
|
built
1978
2212 Gaylewood Dr, Bessemer, AL 35022
$441
Cash flow
16.4%
Cash-on-Cash Return
9.5%
Cap rate
1.1%
Rent to Value Ratio
Active
$350,000
3
bds
|
2.5
ba
|
1,604
sqft
|
built
1993
3173 Boxwood Dr, Hoover, AL 35216
$-293
Cash flow
-4.4%
Cash-on-Cash Return
4.7%
Cap rate
0.6%
Rent to Value Ratio
Active
$450,000
3
bds
|
2
ba
|
2,190
sqft
|
built
1920
3031 13th Ave S, Birmingham, AL 35205
$-129
Cash flow
-1.5%
Cash-on-Cash Return
5.3%
Cap rate
0.6%
Rent to Value Ratio
Active
$679,900
3
bds
|
2.5
ba
|
1,710
sqft
|
built
2009
2760 16th Pl S, Birmingham, AL 35209
$-1,216
Cash flow
-9.3%
Cash-on-Cash Return
3.5%
Cap rate
0.4%
Rent to Value Ratio
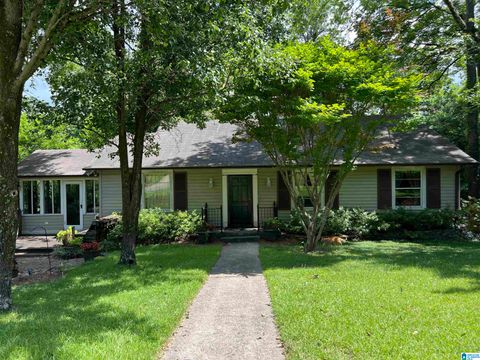
Active
$249,900
3
bds
|
2
ba
|
1,320
sqft
|
built
1954
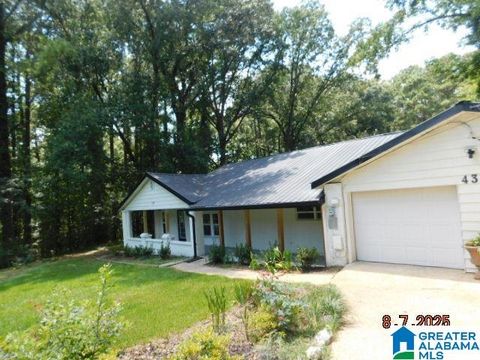
1237 Norman Dr, Leeds, AL 35094
$59
Cash flow
1.2%
Cash-on-Cash Return
6.0%
Cap rate
0.7%
Rent to Value Ratio
Active
$139,900
2
bds
|
1
ba
|
992
sqft
|
built
1960
115 June Ave, Bessemer, AL 35023
$97
Cash flow
3.6%
Cash-on-Cash Return
6.5%
Cap rate
0.8%
Rent to Value Ratio
Active
$599,000
3
bds
|
2
ba
|
1,804
sqft
|
built
1963
1329 Wales Ave, Birmingham, AL 35213
$-903
Cash flow
-7.9%
Cash-on-Cash Return
3.9%
Cap rate
0.5%
Rent to Value Ratio
Active
$175,000
3
bds
|
1
ba
|
2,418
sqft
|
built
1950
158 Woodward Rd, Midfield, AL 35228
$69
Cash flow
2.1%
Cash-on-Cash Return
6.2%
Cap rate
0.7%
Rent to Value Ratio
Active
$170,000
3
bds
|
2
ba
|
1,110
sqft
|
built
1935
8032 5th Ave S, Birmingham, AL 35206
$-114
Cash flow
-3.5%
Cash-on-Cash Return
4.9%
Cap rate
0.6%
Rent to Value Ratio
Active
$415,000
3
bds
|
2
ba
|
1,619
sqft
|
built
1959
412 Maiden Ln, Hoover, AL 35226
$-377
Cash flow
-4.7%
Cash-on-Cash Return
4.6%
Cap rate
0.6%
Rent to Value Ratio
Active
$399,900
4
bds
|
3
ba
|
2,315
sqft
|
built
2000
909 Castlemaine Dr, Birmingham, AL 35226
$27
Cash flow
0.4%
Cash-on-Cash Return
5.8%
Cap rate
0.7%
Rent to Value Ratio
Active
$465,000
4
bds
|
3
ba
|
2,547
sqft
|
built
1960
1436 Alford Ave, Hoover, AL 35226
$-683
Cash flow
-7.7%
Cash-on-Cash Return
3.9%
Cap rate
0.5%
Rent to Value Ratio
Active
$314,900
3
bds
|
2.5
ba
|
1,874
sqft
|
built
1995
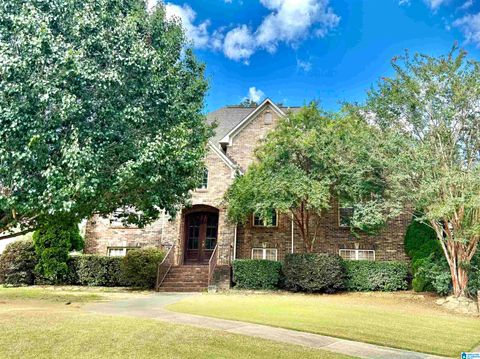
9005 Mosley Manor Cir, Morris, AL 35116
$-179
Cash flow
-3.0%
Cash-on-Cash Return
5.0%
Cap rate
0.6%
Rent to Value Ratio
Active
$600,000
4
bds
|
3
ba
|
3,358
sqft
|
built
1945
1735 Saulter Rd, Homewood, AL 35209
$-631
Cash flow
-5.5%
Cash-on-Cash Return
4.4%
Cap rate
0.5%
Rent to Value Ratio
Active
$154,900
3
bds
|
2
ba
|
1,368
sqft
|
built
1975
2528 Oak Leaf Ln, Adamsville, AL 35005
$26
Cash flow
0.9%
Cash-on-Cash Return
5.9%
Cap rate
0.7%
Rent to Value Ratio
Active
$205,000
3
bds
|
2
ba
|
1,715
sqft
|
built
1973
1457 4th Pl NW, Center Point, AL 35215
$-4
Cash flow
-0.1%
Cash-on-Cash Return
5.7%
Cap rate
0.7%
Rent to Value Ratio
Active
$130,000
2
bds
|
0
ba
|
0
sqft
|
built
1973
4725 13th Ave N, Birmingham, AL 35212
$351
Cash flow
14.1%
Cash-on-Cash Return
8.9%
Cap rate
1.1%
Rent to Value Ratio
Active
$189,900
3
bds
|
2
ba
|
1,561
sqft
|
built
1920
7305 Division Ave, Birmingham, AL 35206
$67
Cash flow
1.8%
Cash-on-Cash Return
6.1%
Cap rate
0.7%
Rent to Value Ratio
Active
$275,000
4
bds
|
2.5
ba
|
2,396
sqft
|
built
1984
2217 Pentland Dr, Birmingham, AL 35235
$-197
Cash flow
-3.7%
Cash-on-Cash Return
4.8%
Cap rate
0.6%
Rent to Value Ratio
Active
$130,000
3
bds
|
2
ba
|
1,246
sqft
|
built
1930
4263 Alexander Rd, Quinton, AL 35130
$351
Cash flow
14.1%
Cash-on-Cash Return
8.9%
Cap rate
1.1%
Rent to Value Ratio
Active
$85,000
3
bds
|
1
ba
|
1,066
sqft
|
built
1950
6144 Court M, Birmingham, AL 35228
$495
Cash flow
30.4%
Cash-on-Cash Return
12.7%
Cap rate
1.5%
Rent to Value Ratio
Active
$265,000
2
bds
|
2
ba
|
1,140
sqft
|
built
2008
140 Singapore Cir, Birmingham, AL 35211
$28
Cash flow
0.6%
Cash-on-Cash Return
5.8%
Cap rate
0.7%
Rent to Value Ratio
Active
$177,300
3
bds
|
1.5
ba
|
1,400
sqft
|
built
1940
430 Laird Ave, Hueytown, AL 35023
$403
Cash flow
11.9%
Cash-on-Cash Return
8.4%
Cap rate
1.0%
Rent to Value Ratio
Active
$439,900
5
bds
|
3
ba
|
2,743
sqft
|
built
2007
9439 Polo Trce, Kimberly, AL 35091
$-357
Cash flow
-4.2%
Cash-on-Cash Return
4.7%
Cap rate
0.6%
Rent to Value Ratio