Jefferson County Investment Properties for Sale
Browse homes for sale and investment properties in Jefferson County. Refine your search by price, property type, or more.
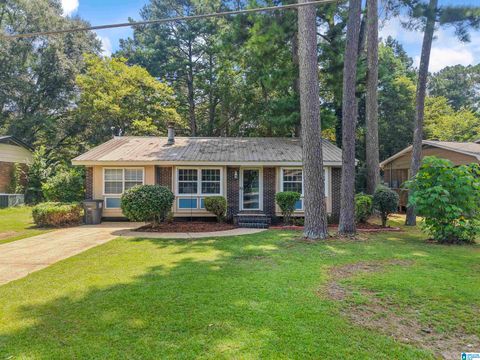
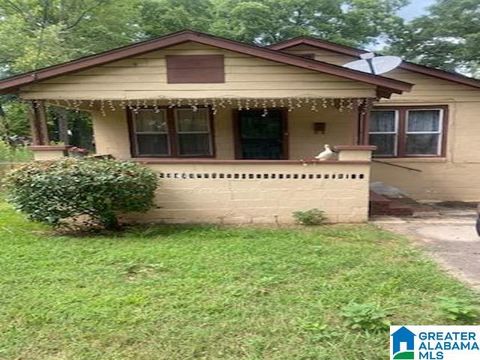
Best cash flowing properties in Jefferson County
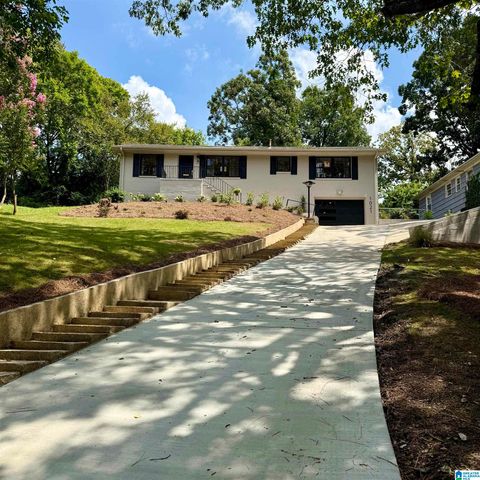
Active
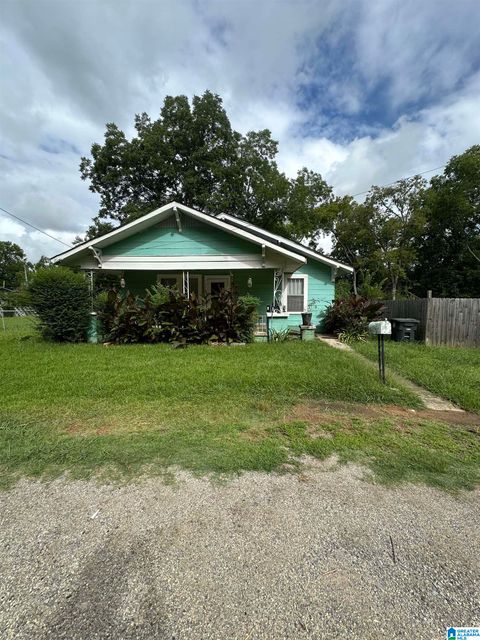
$57,000
3
bds
|
1
ba
|
1,638
sqft
|
built
1930
3420 Ellis Ave SW, Birmingham, AL 35221
$897
Cash flow
18.3%
Cash-on-Cash Return
18.9%
Cap rate
2.3%
Rent to Value Ratio
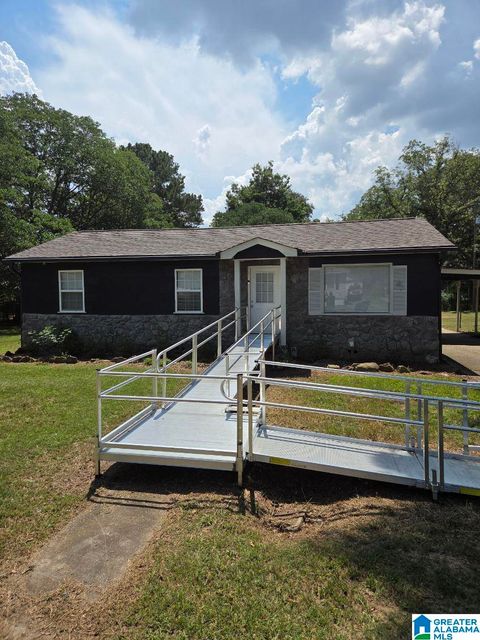
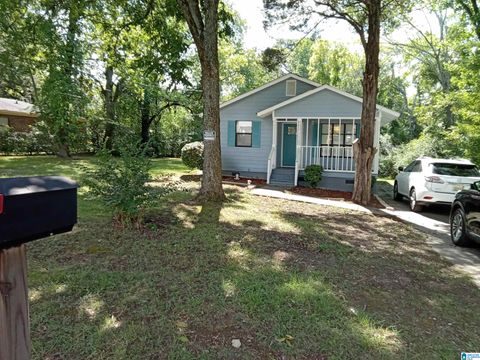
Active
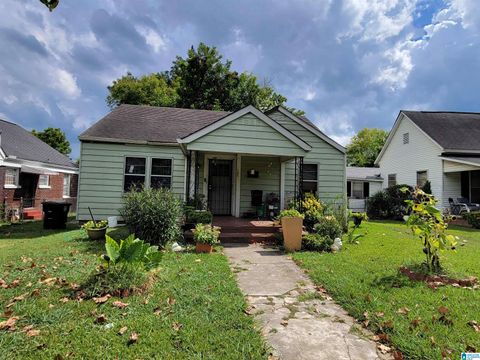
$49,900
3
bds
|
1.5
ba
|
1,146
sqft
|
built
1930
1205 4th Ct W, Birmingham, AL 35208
$759
Cash flow
17.7%
Cash-on-Cash Return
18.3%
Cap rate
2.2%
Rent to Value Ratio
1,557 out of 2,117 properties for sale in Jefferson County
Limited Results Shown
Create a free account, or log in to reveal all property listings and enjoy the complete experience.
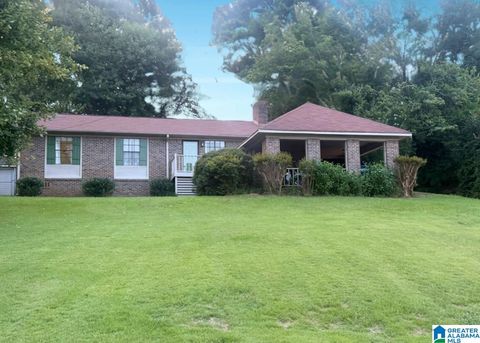
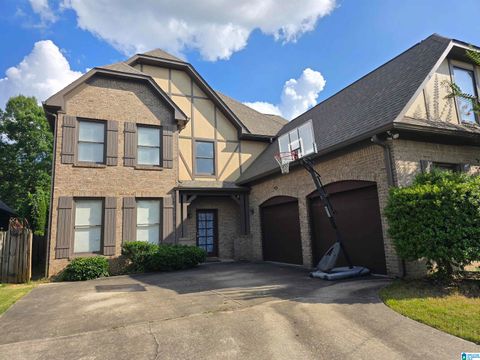
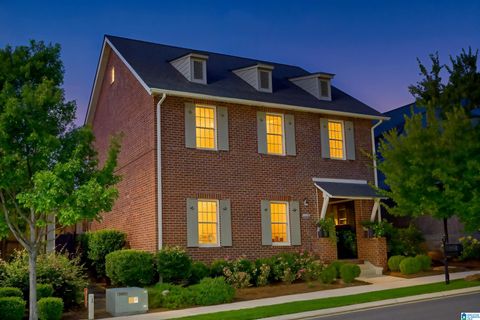
Active
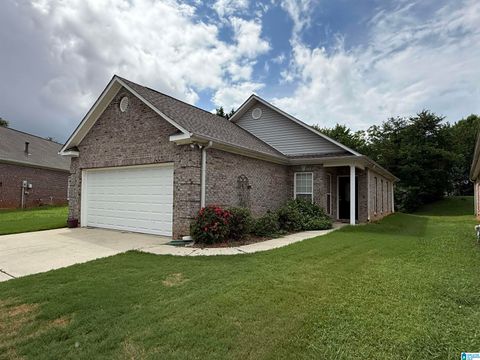
$262,500
3
bds
|
2
ba
|
1,455
sqft
|
built
2003
4865 Longmeadow Dr, Bessemer, AL 35022
$-40
Cash flow
-0.8%
Cash-on-Cash Return
5.5%
Cap rate
0.7%
Rent to Value Ratio
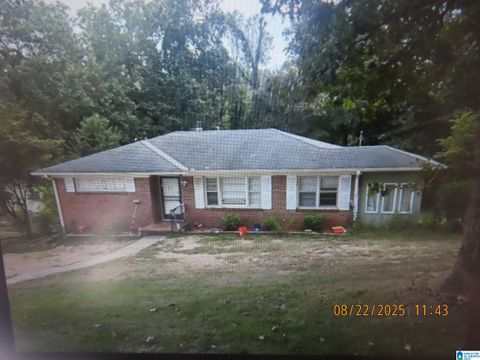
Active
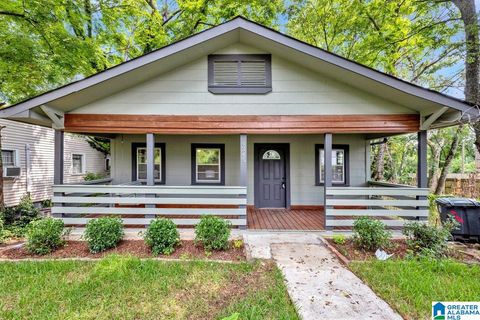
$320,000
3
bds
|
2
ba
|
988
sqft
|
built
1932
4345 2nd Ave S, Birmingham, AL 35222
$-410
Cash flow
-6.7%
Cash-on-Cash Return
4.1%
Cap rate
0.5%
Rent to Value Ratio
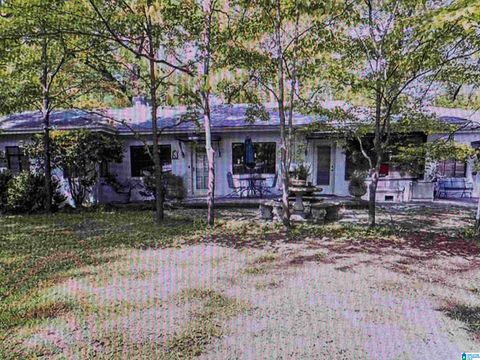
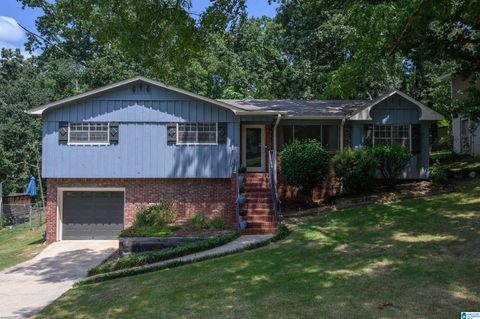
Active
$145,000
3
bds
|
2
ba
|
1,228
sqft
|
built
1957
136 Lake Dr NE, Birmingham, AL 35215
$211
Cash flow
7.6%
Cash-on-Cash Return
7.4%
Cap rate
0.9%
Rent to Value Ratio
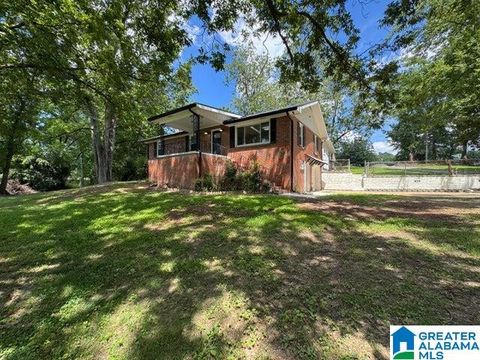
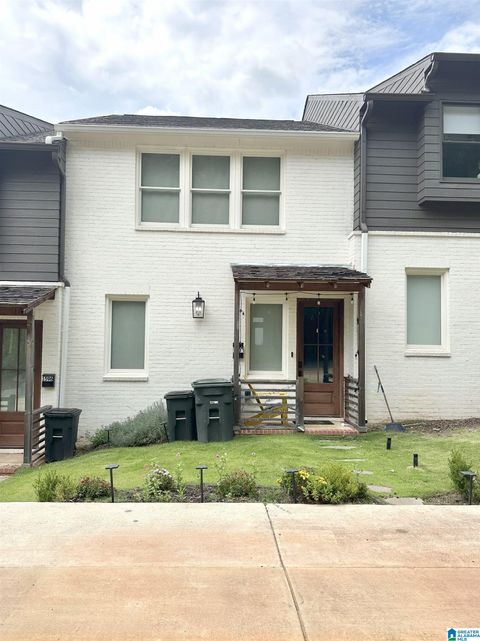
Active
$159,000
2
bds
|
1
ba
|
1,296
sqft
|
built
1954
790 Leslie Ln, Gardendale, AL 35071
$352
Cash flow
11.6%
Cash-on-Cash Return
8.3%
Cap rate
1.0%
Rent to Value Ratio
Active
$1,199,900
4
bds
|
4
ba
|
2,704
sqft
|
built
1929
1618 Wellington Rd, Homewood, AL 35209
$-2,642
Cash flow
-11.5%
Cash-on-Cash Return
3.0%
Cap rate
0.4%
Rent to Value Ratio
Active
$199,900
3
bds
|
3
ba
|
2,496
sqft
|
built
1968
1839 Mara Dr, Center Point, AL 35215
$158
Cash flow
4.1%
Cash-on-Cash Return
6.6%
Cap rate
0.8%
Rent to Value Ratio
Active
$344,900
2
bds
|
2
ba
|
1,340
sqft
|
built
1913
2024 2nd Ave N, Birmingham, AL 35203
$-604
Cash flow
-9.1%
Cash-on-Cash Return
3.6%
Cap rate
0.8%
Rent to Value Ratio
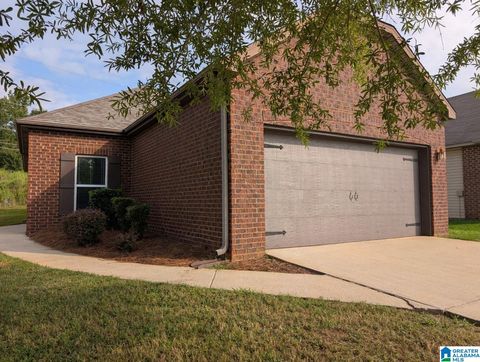
Active
$235,000
3
bds
|
2
ba
|
1,229
sqft
|
built
1979
3304 Saddlewood Cir, Helena, AL 35022
$130
Cash flow
2.9%
Cash-on-Cash Return
6.3%
Cap rate
0.8%
Rent to Value Ratio
Active
$225,000
3
bds
|
2.5
ba
|
2,330
sqft
|
built
1950
310 South Pkwy, Bessemer, AL 35023
$177
Cash flow
4.1%
Cash-on-Cash Return
6.6%
Cap rate
0.8%
Rent to Value Ratio
Active
$385,000
4
bds
|
3
ba
|
2,702
sqft
|
built
1957
8502 Old Bagley Rd, Dora, AL 35062
$-925
Cash flow
-12.5%
Cash-on-Cash Return
2.8%
Cap rate
0.3%
Rent to Value Ratio
Active
$199,000
3
bds
|
1.5
ba
|
2,000
sqft
|
built
1967
2731 Novel Dr, Bessemer, AL 35023
$162
Cash flow
4.2%
Cash-on-Cash Return
6.7%
Cap rate
0.8%
Rent to Value Ratio
Active
$494,900
4
bds
|
2.5
ba
|
2,692
sqft
|
built
2007
2376 Chalybe Trl, Hoover, AL 35226
$-301
Cash flow
-3.2%
Cash-on-Cash Return
4.9%
Cap rate
0.6%
Rent to Value Ratio
Active
$221,900
3
bds
|
2
ba
|
1,448
sqft
|
built
1968
1440 Hickory Ln, Birmingham, AL 35235
$330
Cash flow
7.8%
Cash-on-Cash Return
7.5%
Cap rate
0.9%
Rent to Value Ratio
Active
$500,000
2
bds
|
2.5
ba
|
2,800
sqft
|
built
2021
1600 16th Ave S, Birmingham, AL 35205
$-227
Cash flow
-2.4%
Cash-on-Cash Return
5.1%
Cap rate
0.6%
Rent to Value Ratio
Active
$529,900
3
bds
|
2.5
ba
|
3,213
sqft
|
built
1999
1010 Crest Rd, Leeds, AL 35094
$-1,266
Cash flow
-12.5%
Cash-on-Cash Return
2.8%
Cap rate
0.3%
Rent to Value Ratio
Active
$305,000
3
bds
|
2
ba
|
2,001
sqft
|
built
2008
4782 Rosser Loop Dr, Bessemer, AL 35022
$-63
Cash flow
-1.1%
Cash-on-Cash Return
5.4%
Cap rate
0.7%
Rent to Value Ratio
Active
$400,000
2
bds
|
1.5
ba
|
1,822
sqft
|
built
1924
1921 3rd Ave N, Birmingham, AL 35203
$-168
Cash flow
-2.2%
Cash-on-Cash Return
5.2%
Cap rate
0.6%
Rent to Value Ratio
Active
$483,000
4
bds
|
3
ba
|
2,551
sqft
|
built
2020
8947 Taunton Pl, Morris, AL 35116
$-561
Cash flow
-6.1%
Cash-on-Cash Return
4.3%
Cap rate
0.5%
Rent to Value Ratio
Active
$1,195,000
5
bds
|
5
ba
|
5,340
sqft
|
built
2019
5750 Deercrest Ct, Trussville, AL 35173
$-2,360
Cash flow
-10.3%
Cash-on-Cash Return
3.3%
Cap rate
0.4%
Rent to Value Ratio
Active
$549,900
3
bds
|
2.5
ba
|
1,691
sqft
|
built
1973
112 Crest Dr, Homewood, AL 35209
$-187
Cash flow
-1.8%
Cash-on-Cash Return
5.3%
Cap rate
0.6%
Rent to Value Ratio
Active
$149,900
3
bds
|
2
ba
|
1,100
sqft
|
built
1953
2906 19th St N, Hueytown, AL 35023
$119
Cash flow
4.1%
Cash-on-Cash Return
6.6%
Cap rate
0.8%
Rent to Value Ratio
Active
$219,900
3
bds
|
2
ba
|
1,218
sqft
|
built
1967
5457 Newfound Rd, Mount Olive, AL 35117
$-75
Cash flow
-1.8%
Cash-on-Cash Return
5.3%
Cap rate
0.6%
Rent to Value Ratio
Active
$224,900
5
bds
|
2
ba
|
2,245
sqft
|
built
1974
8341 N Valley Rd, Pinson, AL 35126
$316
Cash flow
7.3%
Cash-on-Cash Return
7.4%
Cap rate
0.9%
Rent to Value Ratio
Active
$639,900
5
bds
|
4
ba
|
2,912
sqft
|
built
2016
4494 Tuckahoe Ln, Hoover, AL 35226
$-435
Cash flow
-3.5%
Cash-on-Cash Return
4.9%
Cap rate
0.6%
Rent to Value Ratio
Active
$145,000
3
bds
|
2
ba
|
1,266
sqft
|
built
1920
5036 Godfrey Rd, Adamsville, AL 35005
$73
Cash flow
2.6%
Cash-on-Cash Return
6.3%
Cap rate
0.8%
Rent to Value Ratio
Active
$290,000
3
bds
|
3
ba
|
1,750
sqft
|
built
1954
1617 27th St N, Birmingham, AL 35234
$-61
Cash flow
-1.1%
Cash-on-Cash Return
5.4%
Cap rate
0.7%
Rent to Value Ratio
Active
$419,900
3
bds
|
2
ba
|
2,300
sqft
|
built
1960
1021 54th St S, Birmingham, AL 35222
$-469
Cash flow
-5.8%
Cash-on-Cash Return
4.3%
Cap rate
0.5%
Rent to Value Ratio
Active
$204,900
3
bds
|
2
ba
|
1,458
sqft
|
built
1950
136 Crystal Ave, Bessemer, AL 35023
$65
Cash flow
1.7%
Cash-on-Cash Return
6.1%
Cap rate
0.7%
Rent to Value Ratio
Active
$550,000
4
bds
|
3
ba
|
2,734
sqft
|
built
2013
4276 Abbotts Way, Hoover, AL 35226
$-286
Cash flow
-2.7%
Cash-on-Cash Return
5.1%
Cap rate
0.6%
Rent to Value Ratio
Active
$249,000
3
bds
|
1
ba
|
1,327
sqft
|
built
1960
1821 Oak St NW, Center Point, AL 35215
$-212
Cash flow
-4.4%
Cash-on-Cash Return
4.7%
Cap rate
0.6%
Rent to Value Ratio
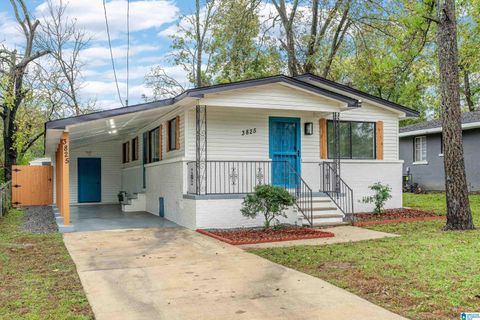
Active
$150,000
3
bds
|
1
ba
|
1,056
sqft
|
built
1960
3825 Ellis Ave SW, Birmingham, AL 35221
$256
Cash flow
8.9%
Cash-on-Cash Return
7.7%
Cap rate
0.9%
Rent to Value Ratio
Active
$259,900
3
bds
|
2
ba
|
1,469
sqft
|
built
2010
4712 Rosser Loop Dr, Bessemer, AL 35022
$-5
Cash flow
-0.1%
Cash-on-Cash Return
5.7%
Cap rate
0.7%
Rent to Value Ratio
Active
$30,000
2
bds
|
1
ba
|
750
sqft
|
built
1945
4228 42nd Ave N, Birmingham, AL 35217
$759
Cash flow
29.5%
Cash-on-Cash Return
30.4%
Cap rate
3.7%
Rent to Value Ratio
Active
$137,900
3
bds
|
2
ba
|
1,109
sqft
|
built
1955
1812 15th St SW, Birmingham, AL 35211
$313
Cash flow
11.8%
Cash-on-Cash Return
8.4%
Cap rate
1.0%
Rent to Value Ratio
Active
$510,000
4
bds
|
2
ba
|
2,428
sqft
|
built
1972
4217 Groover Dr, Birmingham, AL 35213
$-205
Cash flow
-2.1%
Cash-on-Cash Return
5.2%
Cap rate
0.6%
Rent to Value Ratio
Active
$89,900
3
bds
|
1
ba
|
1,144
sqft
|
built
1957
308 13th Ave NW, Birmingham, AL 35215
$403
Cash flow
23.4%
Cash-on-Cash Return
11.1%
Cap rate
1.3%
Rent to Value Ratio
Active
$479,900
4
bds
|
3
ba
|
3,300
sqft
|
built
1976
141 Caliente Dr, Hoover, AL 35226
$-270
Cash flow
-2.9%
Cash-on-Cash Return
5.0%
Cap rate
0.6%
Rent to Value Ratio
Active
$95,000
3
bds
|
1
ba
|
1,913
sqft
|
built
1924
1532 Graymont Ave W, Birmingham, AL 35208
$654
Cash flow
35.9%
Cash-on-Cash Return
13.9%
Cap rate
1.7%
Rent to Value Ratio