Andover, MA Investment Properties for Sale
Browse homes for sale and investment properties in Andover, MA. Refine your search by price, property type, or more.
Best cash flowing properties in Andover, MA
Active
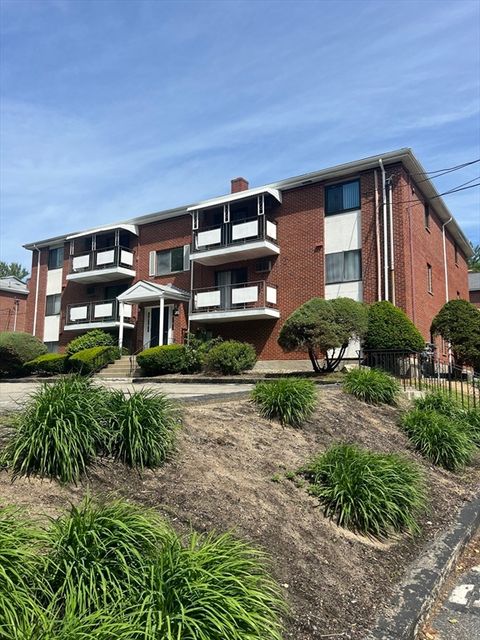
$269,000
1
bds
|
1
ba
|
735
sqft
|
built
1973
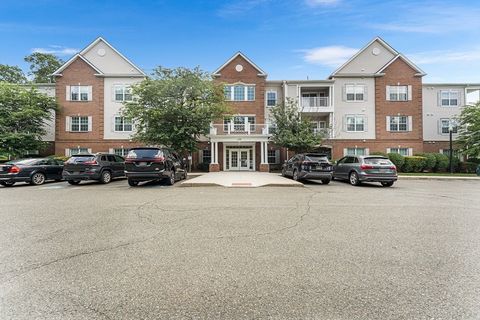
20 Colonial Dr, Andover, MA 01810
$-577
Cash flow
-11.2%
Cash-on-Cash Return
3.1%
Cap rate
0.8%
Rent to Value Ratio
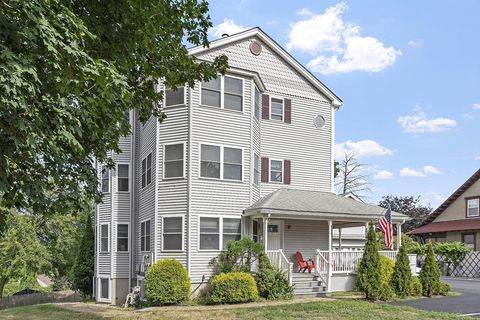
Active
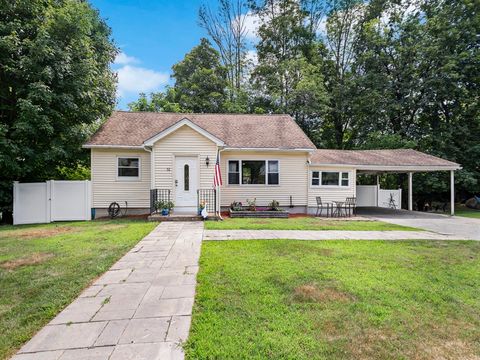
$565,444
3
bds
|
1
ba
|
1,296
sqft
|
built
1950
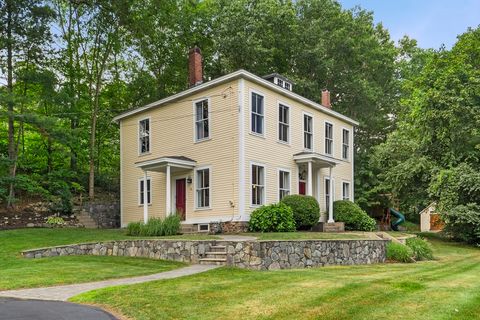
51 Dufton Rd, Andover, MA 01810
$-750
Cash flow
-6.9%
Cash-on-Cash Return
4.1%
Cap rate
0.6%
Rent to Value Ratio
29 out of 39 properties for sale in Andover, MA
Limited Results Shown
Create a free account, or log in to reveal all property listings and enjoy the complete experience.
Active
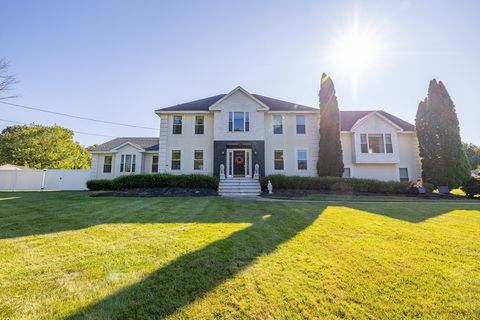
$1,849,900
6
bds
|
6
ba
|
4,060
sqft
|
built
1992
2 Nollet Dr, Andover, MA 01810
$-6,295
Cash flow
-17.8%
Cash-on-Cash Return
1.6%
Cap rate
0.3%
Rent to Value Ratio
Active
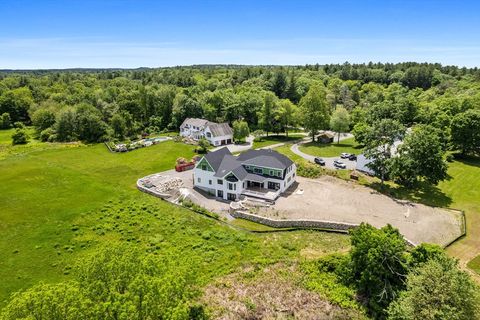
$1,750,000
4
bds
|
5
ba
|
4,973
sqft
|
built
2024
107 Reservation Rd, Andover, MA 01810
$-7,395
Cash flow
-22.0%
Cash-on-Cash Return
0.6%
Cap rate
0.2%
Rent to Value Ratio
Active
$549,900
2
bds
|
2
ba
|
1,084
sqft
|
built
2003
437 N Main St, Andover, MA 01810
$-1,137
Cash flow
-10.8%
Cash-on-Cash Return
3.2%
Cap rate
0.6%
Rent to Value Ratio
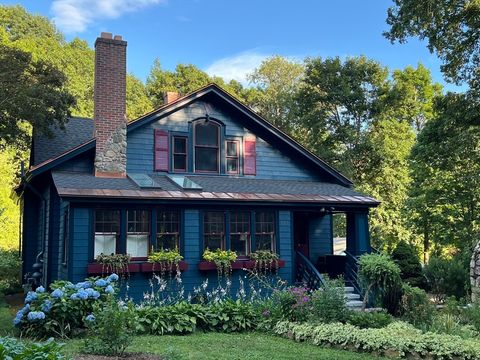
Active
$1,049,000
3
bds
|
2
ba
|
2,055
sqft
|
built
1922
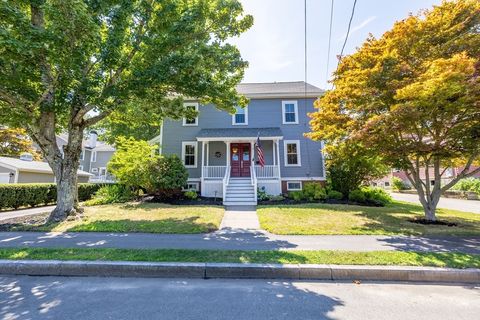
177 Highland Rd, Andover, MA 01810
$-2,792
Cash flow
-13.9%
Cash-on-Cash Return
2.5%
Cap rate
0.4%
Rent to Value Ratio
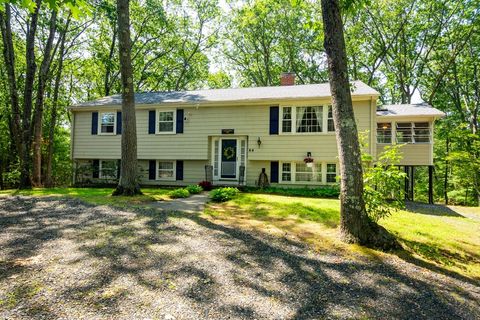
Active
$679,900
3
bds
|
3
ba
|
1,959
sqft
|
built
1965
50 County Rd, Andover, MA 01810
$-1,124
Cash flow
-8.6%
Cash-on-Cash Return
3.7%
Cap rate
0.6%
Rent to Value Ratio
Active
$995,000
4
bds
|
3
ba
|
2,265
sqft
|
built
1949
48 High Plain Rd, Andover, MA 01810
$-2,135
Cash flow
-11.2%
Cash-on-Cash Return
3.1%
Cap rate
0.5%
Rent to Value Ratio
Active
$1,680,000
7
bds
|
7
ba
|
3,983
sqft
|
built
1886
31 Bartlet St, Andover, MA 01810
$-3,716
Cash flow
-11.5%
Cash-on-Cash Return
3.0%
Cap rate
0.5%
Rent to Value Ratio
Active
$575,000
2
bds
|
2
ba
|
1,400
sqft
|
built
2003
170 Haverhill St, Andover, MA 01810
$-1,691
Cash flow
-15.3%
Cash-on-Cash Return
2.1%
Cap rate
0.5%
Rent to Value Ratio
Active
$1,989,000
4
bds
|
5
ba
|
4,135
sqft
|
built
1996
11 Scotland Dr, Andover, MA 01810
$-6,711
Cash flow
-17.6%
Cash-on-Cash Return
1.6%
Cap rate
0.3%
Rent to Value Ratio
Active
$1,035,000
4
bds
|
3
ba
|
2,232
sqft
|
built
1870
11 Clark Rd, Andover, MA 01810
$-2,667
Cash flow
-13.4%
Cash-on-Cash Return
2.6%
Cap rate
0.4%
Rent to Value Ratio
Active
$2,499,000
5
bds
|
4
ba
|
5,187
sqft
|
built
1920
15 Geneva Rd, Andover, MA 01810
$-8,903
Cash flow
-18.6%
Cash-on-Cash Return
1.4%
Cap rate
0.3%
Rent to Value Ratio
Active
$1,390,000
5
bds
|
4
ba
|
3,825
sqft
|
built
1974
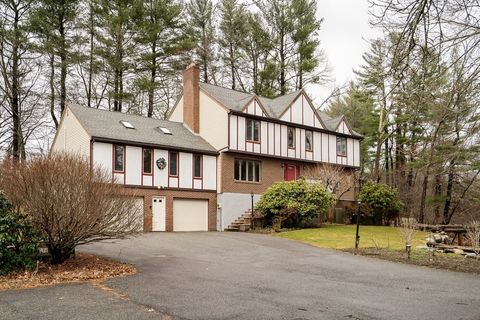
24 Enfield Dr, Andover, MA 01810
$-4,200
Cash flow
-15.8%
Cash-on-Cash Return
2.1%
Cap rate
0.4%
Rent to Value Ratio
Active
$2,495,000
5
bds
|
6
ba
|
9,459
sqft
|
built
2003
2 Regency Rdg, Andover, MA 01810
$-10,207
Cash flow
-21.3%
Cash-on-Cash Return
0.8%
Cap rate
0.3%
Rent to Value Ratio
Active
$1,149,900
5
bds
|
3
ba
|
2,861
sqft
|
built
1900
47 Abbot St, Andover, MA 01810
$-2,908
Cash flow
-13.2%
Cash-on-Cash Return
2.6%
Cap rate
0.5%
Rent to Value Ratio
Active
$1,375,000
5
bds
|
4
ba
|
3,897
sqft
|
built
2016
166 Greenwood Rd, Andover, MA 01810
$-5,549
Cash flow
-21.1%
Cash-on-Cash Return
0.8%
Cap rate
0.2%
Rent to Value Ratio
Active
$899,900
6
bds
|
4
ba
|
3,322
sqft
|
built
1908
497 S Main St, Andover, MA 01810
$-1,928
Cash flow
-11.2%
Cash-on-Cash Return
3.1%
Cap rate
0.5%
Rent to Value Ratio
Active
$1,500,000
5
bds
|
3
ba
|
3,460
sqft
|
built
1717
88 Central St, Andover, MA 01810
$-4,135
Cash flow
-14.4%
Cash-on-Cash Return
2.4%
Cap rate
0.4%
Rent to Value Ratio
Active
$995,000
3
bds
|
3
ba
|
2,464
sqft
|
built
1949
79 Cheever Cir, Andover, MA 01810
$-2,554
Cash flow
-13.4%
Cash-on-Cash Return
2.6%
Cap rate
0.5%
Rent to Value Ratio

Active
$2,895,000
5
bds
|
6
ba
|
7,919
sqft
|
built
1995
59 William St, Andover, MA 01810
$-8,935
Cash flow
-16.1%
Cash-on-Cash Return
2.0%
Cap rate
0.4%
Rent to Value Ratio
Active
$649,900
2
bds
|
2
ba
|
1,500
sqft
|
built
2018
4 Francis Dr, Andover, MA 01810
$-2,128
Cash flow
-17.1%
Cash-on-Cash Return
1.8%
Cap rate
0.5%
Rent to Value Ratio
Active
$2,599,900
5
bds
|
6
ba
|
6,176
sqft
|
built
2001
46 Porter Rd, Andover, MA 01810
$-7,645
Cash flow
-15.3%
Cash-on-Cash Return
2.2%
Cap rate
0.4%
Rent to Value Ratio
Active
$2,495,000
5
bds
|
7
ba
|
6,814
sqft
|
built
1998
3 West Holw, Andover, MA 01810
$-6,413
Cash flow
-13.4%
Cash-on-Cash Return
2.6%
Cap rate
0.4%
Rent to Value Ratio
Active
$2,799,000
4
bds
|
5
ba
|
5,407
sqft
|
built
1795
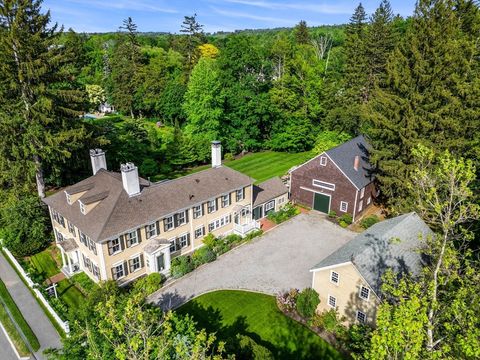
53 Salem St, Andover, MA 01810
$-8,799
Cash flow
-16.4%
Cash-on-Cash Return
1.9%
Cap rate
0.4%
Rent to Value Ratio
Active
$1,349,000
4
bds
|
3
ba
|
4,606
sqft
|
built
1985
21 Orchard Xing, Andover, MA 01810
$-2,197
Cash flow
-8.5%
Cash-on-Cash Return
3.7%
Cap rate
0.6%
Rent to Value Ratio
Active
$2,895,000
5
bds
|
6
ba
|
5,150
sqft
|
built
1796
56 Central St, Andover, MA 01810
$-8,252
Cash flow
-14.9%
Cash-on-Cash Return
2.3%
Cap rate
0.4%
Rent to Value Ratio
Active
$1,899,000
4
bds
|
3
ba
|
3,042
sqft
|
built
2024
14 Geneva Rd, Andover, MA 01810
$-5,329
Cash flow
-14.6%
Cash-on-Cash Return
2.3%
Cap rate
0.3%
Rent to Value Ratio

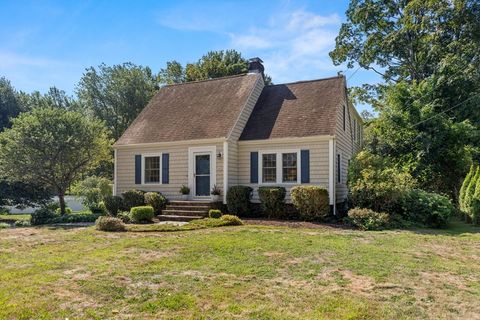
Active
$609,999
3
bds
|
2
ba
|
1,682
sqft
|
built
1956
347 Lowell St, Andover, MA 01810
$-946
Cash flow
-8.1%
Cash-on-Cash Return
3.8%
Cap rate
0.6%
Rent to Value Ratio