Ann Arbor, MI Investment Properties for Sale
Browse homes for sale and investment properties in Ann Arbor, MI. Refine your search by price, property type, or more.
Best cash flowing properties in Ann Arbor, MI
Active
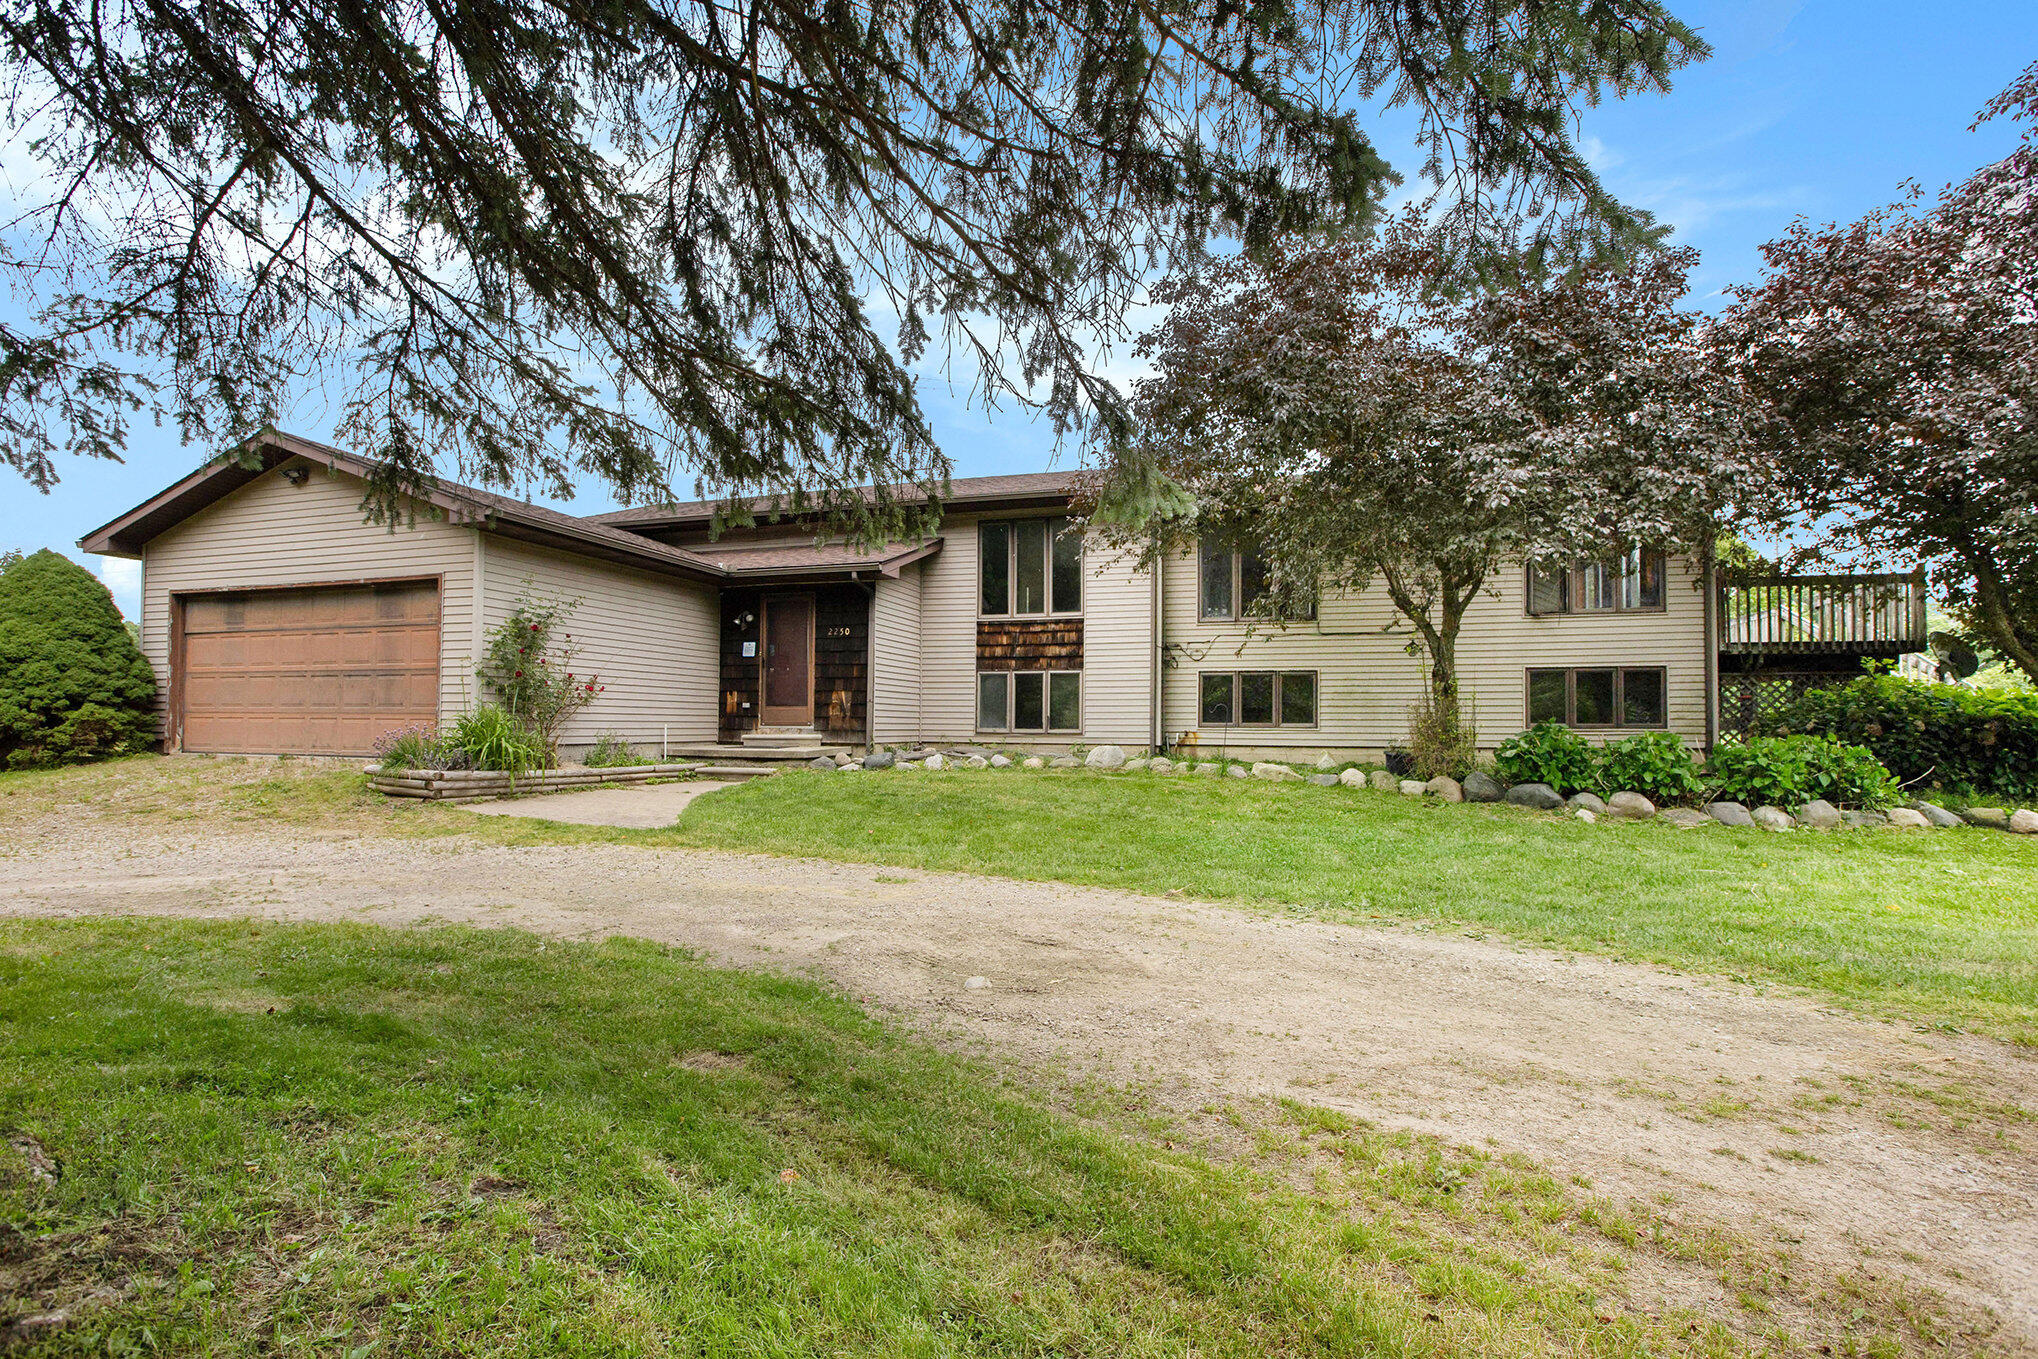
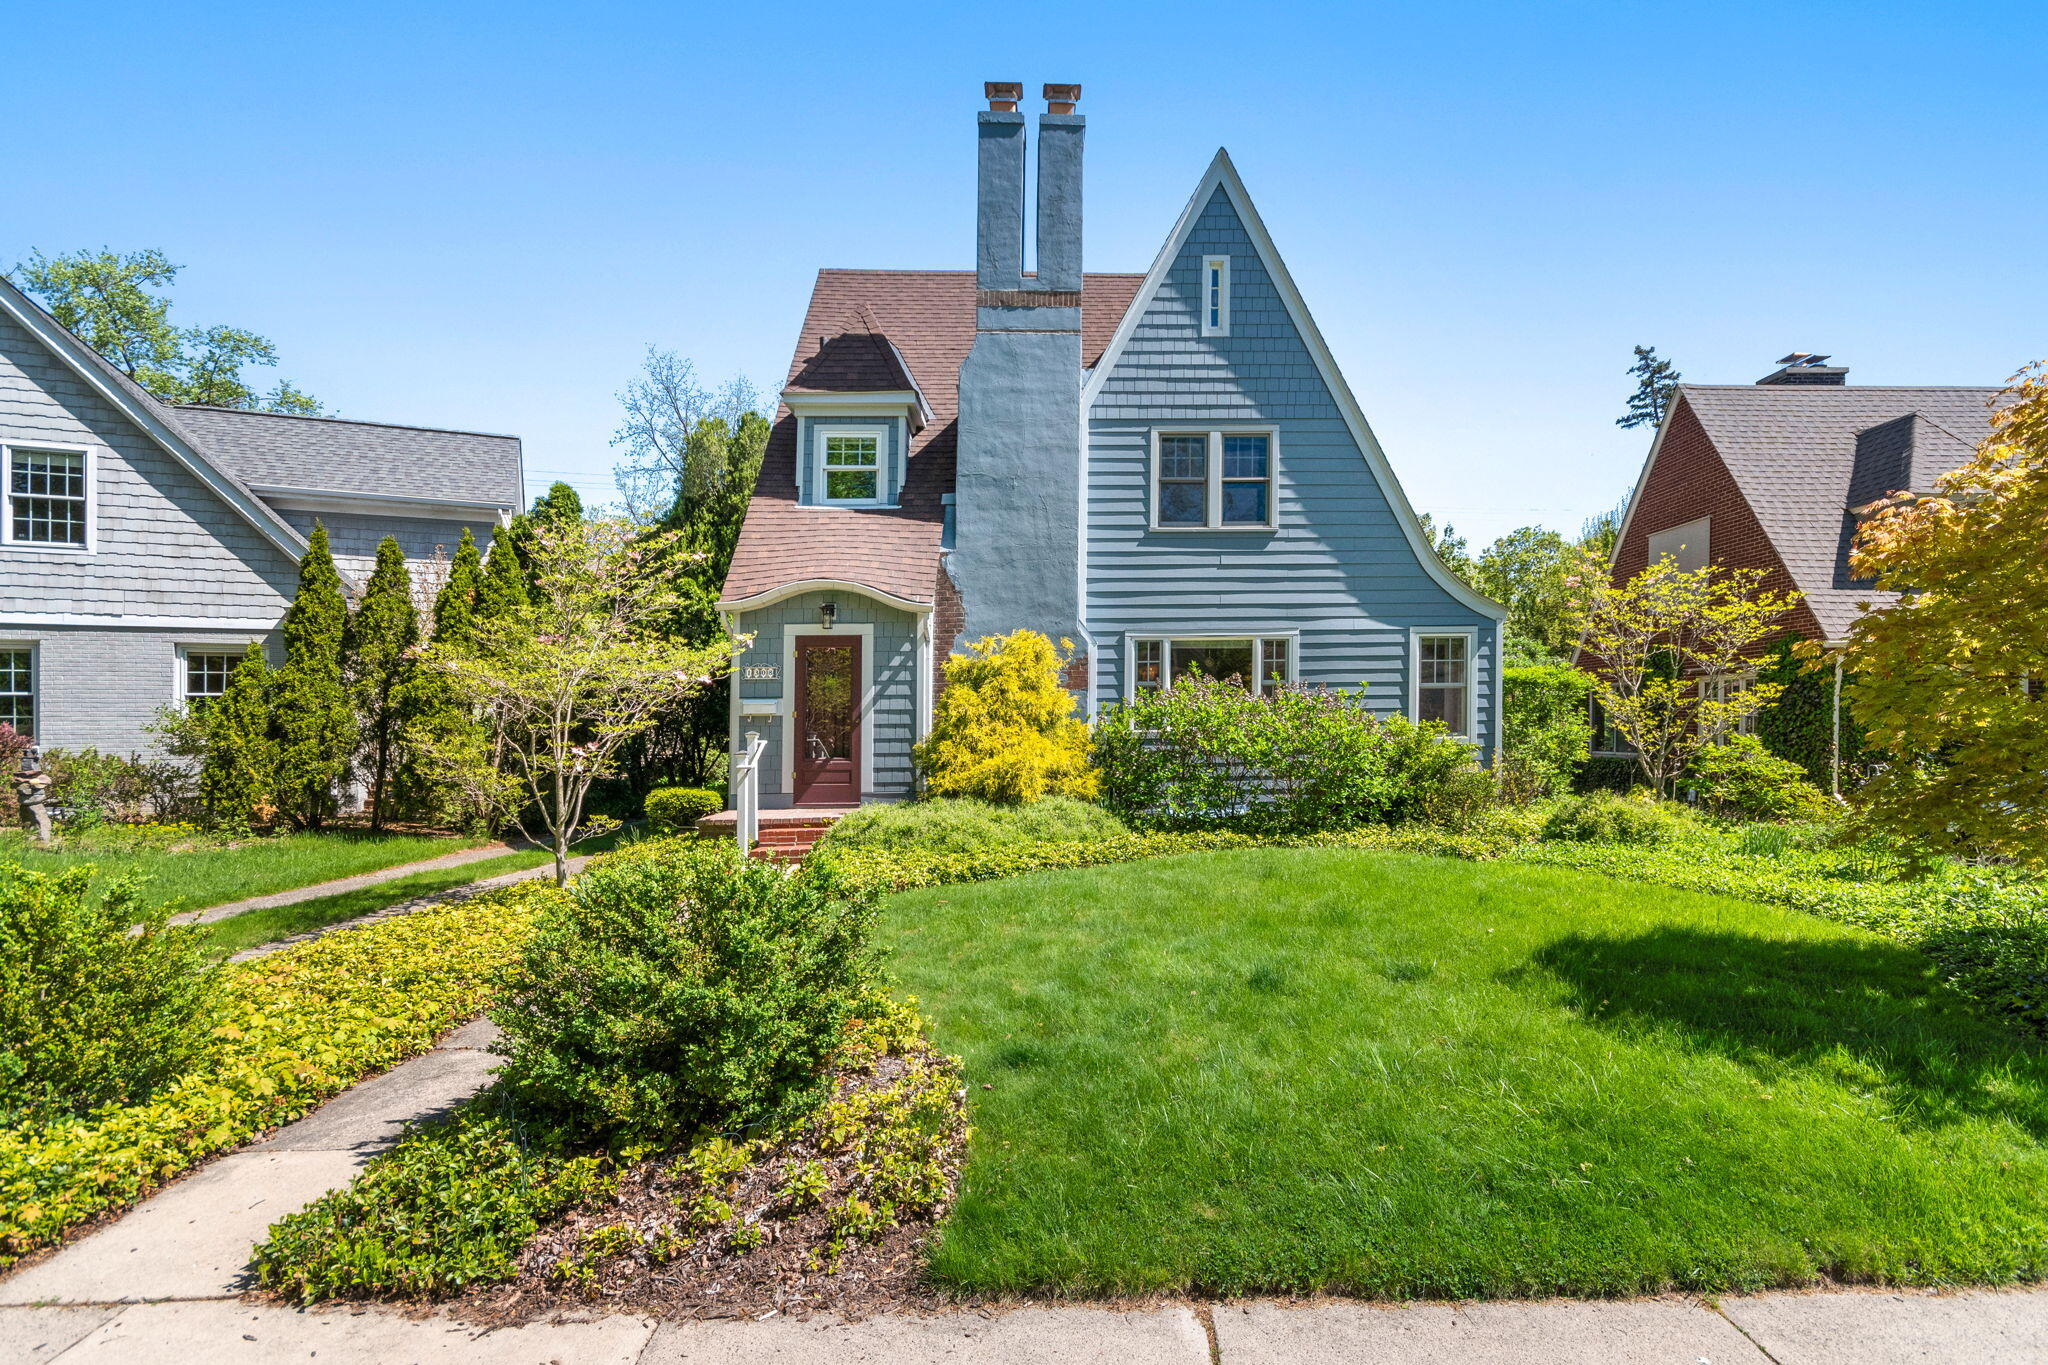
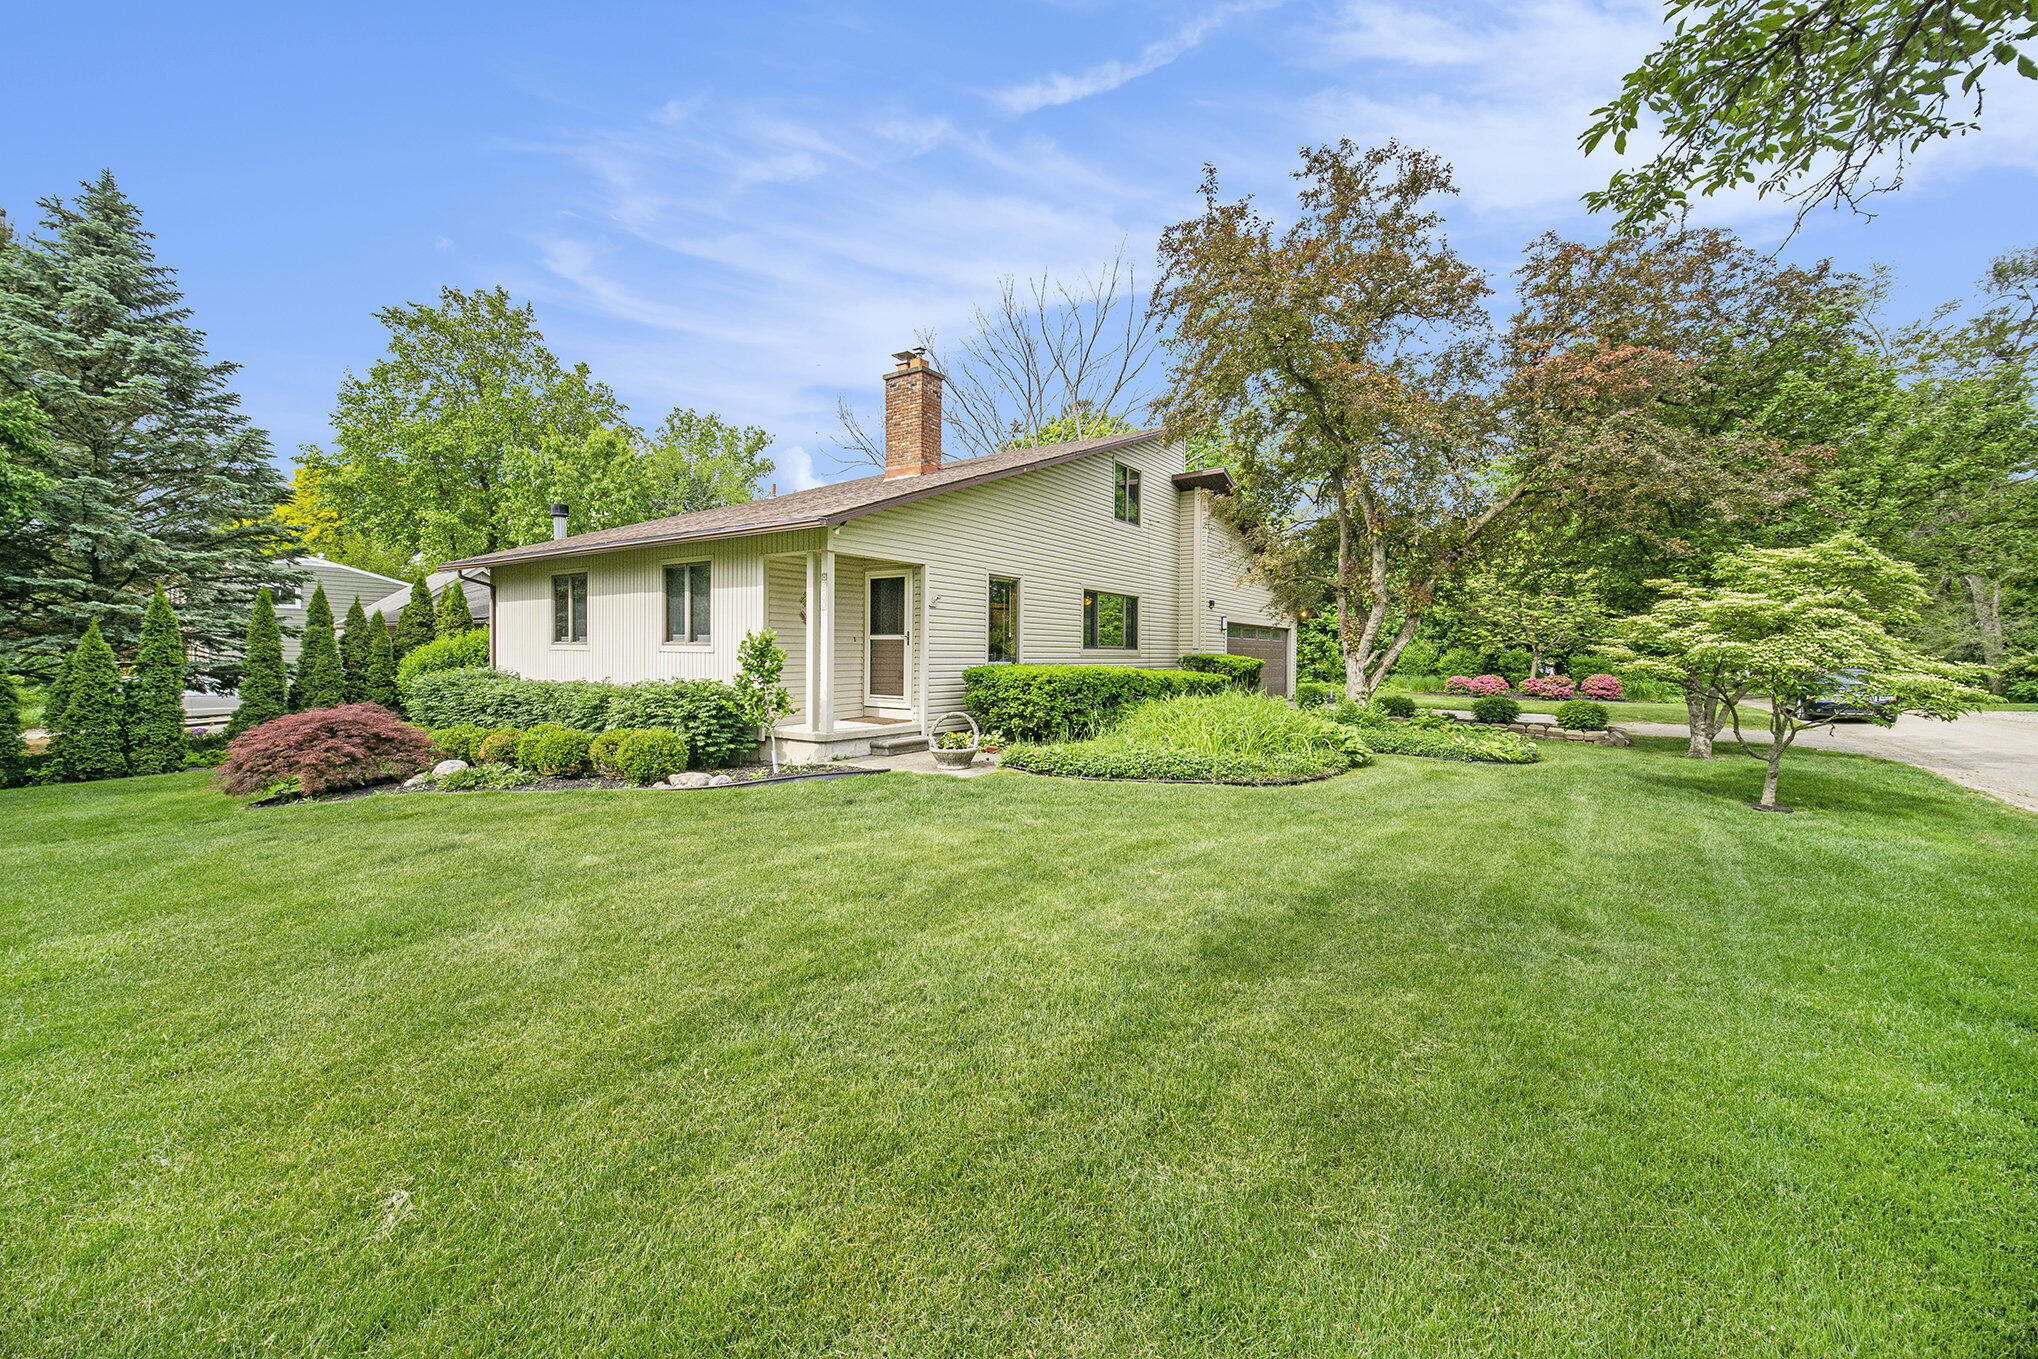
$650,000
4
bds
|
2
ba
|
2,612
sqft
|
built
1988
2250 Peters Rd, Ann Arbor, MI 48103
$-333
Cash flow
-2.7%
Cash-on-Cash Return
5.7%
Cap rate
0.9%
Rent to Value Ratio

Active under contract
$335,000
3
bds
|
2
ba
|
1,604
sqft
|
built
1966
3168 Lorraine St, Ann Arbor, MI 48108
$-522
Cash flow
-8.1%
Cash-on-Cash Return
4.4%
Cap rate
0.7%
Rent to Value Ratio
171 out of 188 properties for sale in Ann Arbor, MI
Limited Results Shown
Create a free account, or log in to reveal all property listings and enjoy the complete experience.
Active
$775,000
3
bds
|
2
ba
|
2,336
sqft
|
built
1975
2277 W Huron River Dr, Ann Arbor, MI 48103
$-2,323
Cash flow
-15.6%
Cash-on-Cash Return
2.7%
Cap rate
0.5%
Rent to Value Ratio

Active
$1,899,900
5
bds
|
7
ba
|
8,234
sqft
|
built
1994
1303 Towsley Ln, Ann Arbor, MI 48105
$-10,117
Cash flow
-27.8%
Cash-on-Cash Return
-0.1%
Cap rate
0.2%
Rent to Value Ratio
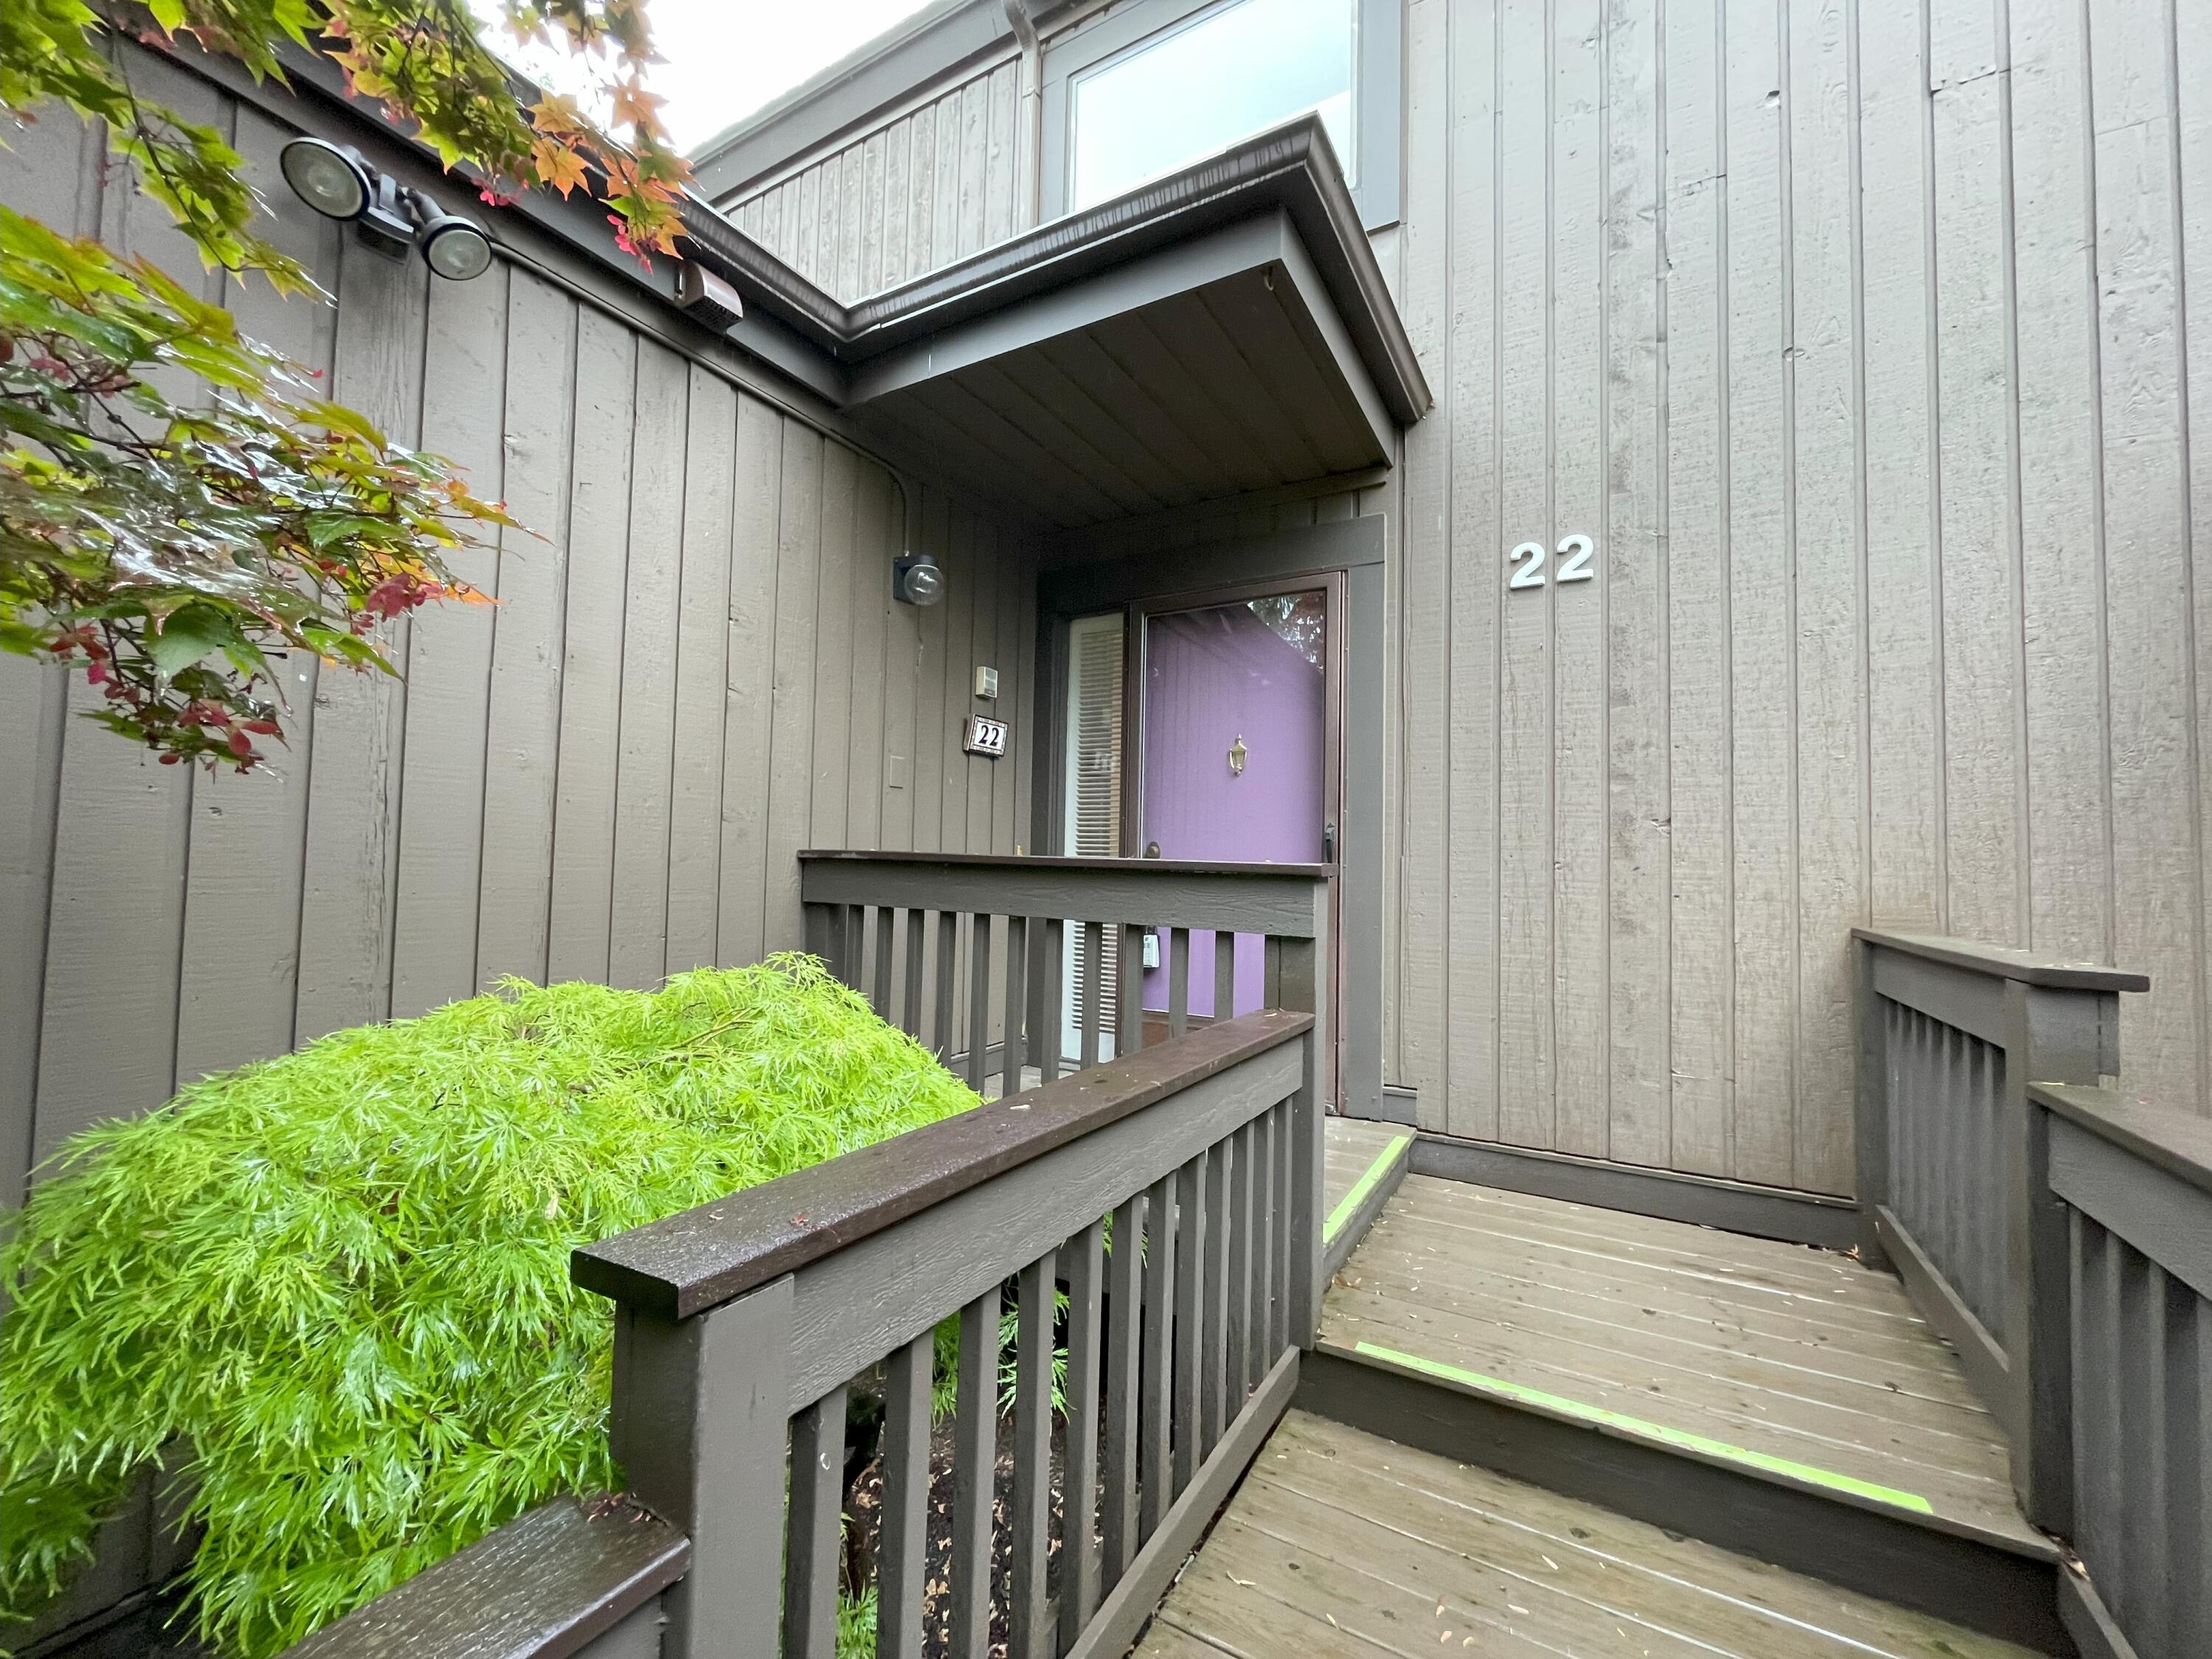
Active
$535,000
3
bds
|
3
ba
|
2,675
sqft
|
built
1976
22 Haverhill Ct, Ann Arbor, MI 48105
$-1,532
Cash flow
-14.9%
Cash-on-Cash Return
2.8%
Cap rate
0.6%
Rent to Value Ratio
Active
$239,900
2
bds
|
1
ba
|
871
sqft
|
built
1964
1233 Island Dr, Ann Arbor, MI 48105
$-604
Cash flow
-13.1%
Cash-on-Cash Return
3.3%
Cap rate
0.8%
Rent to Value Ratio
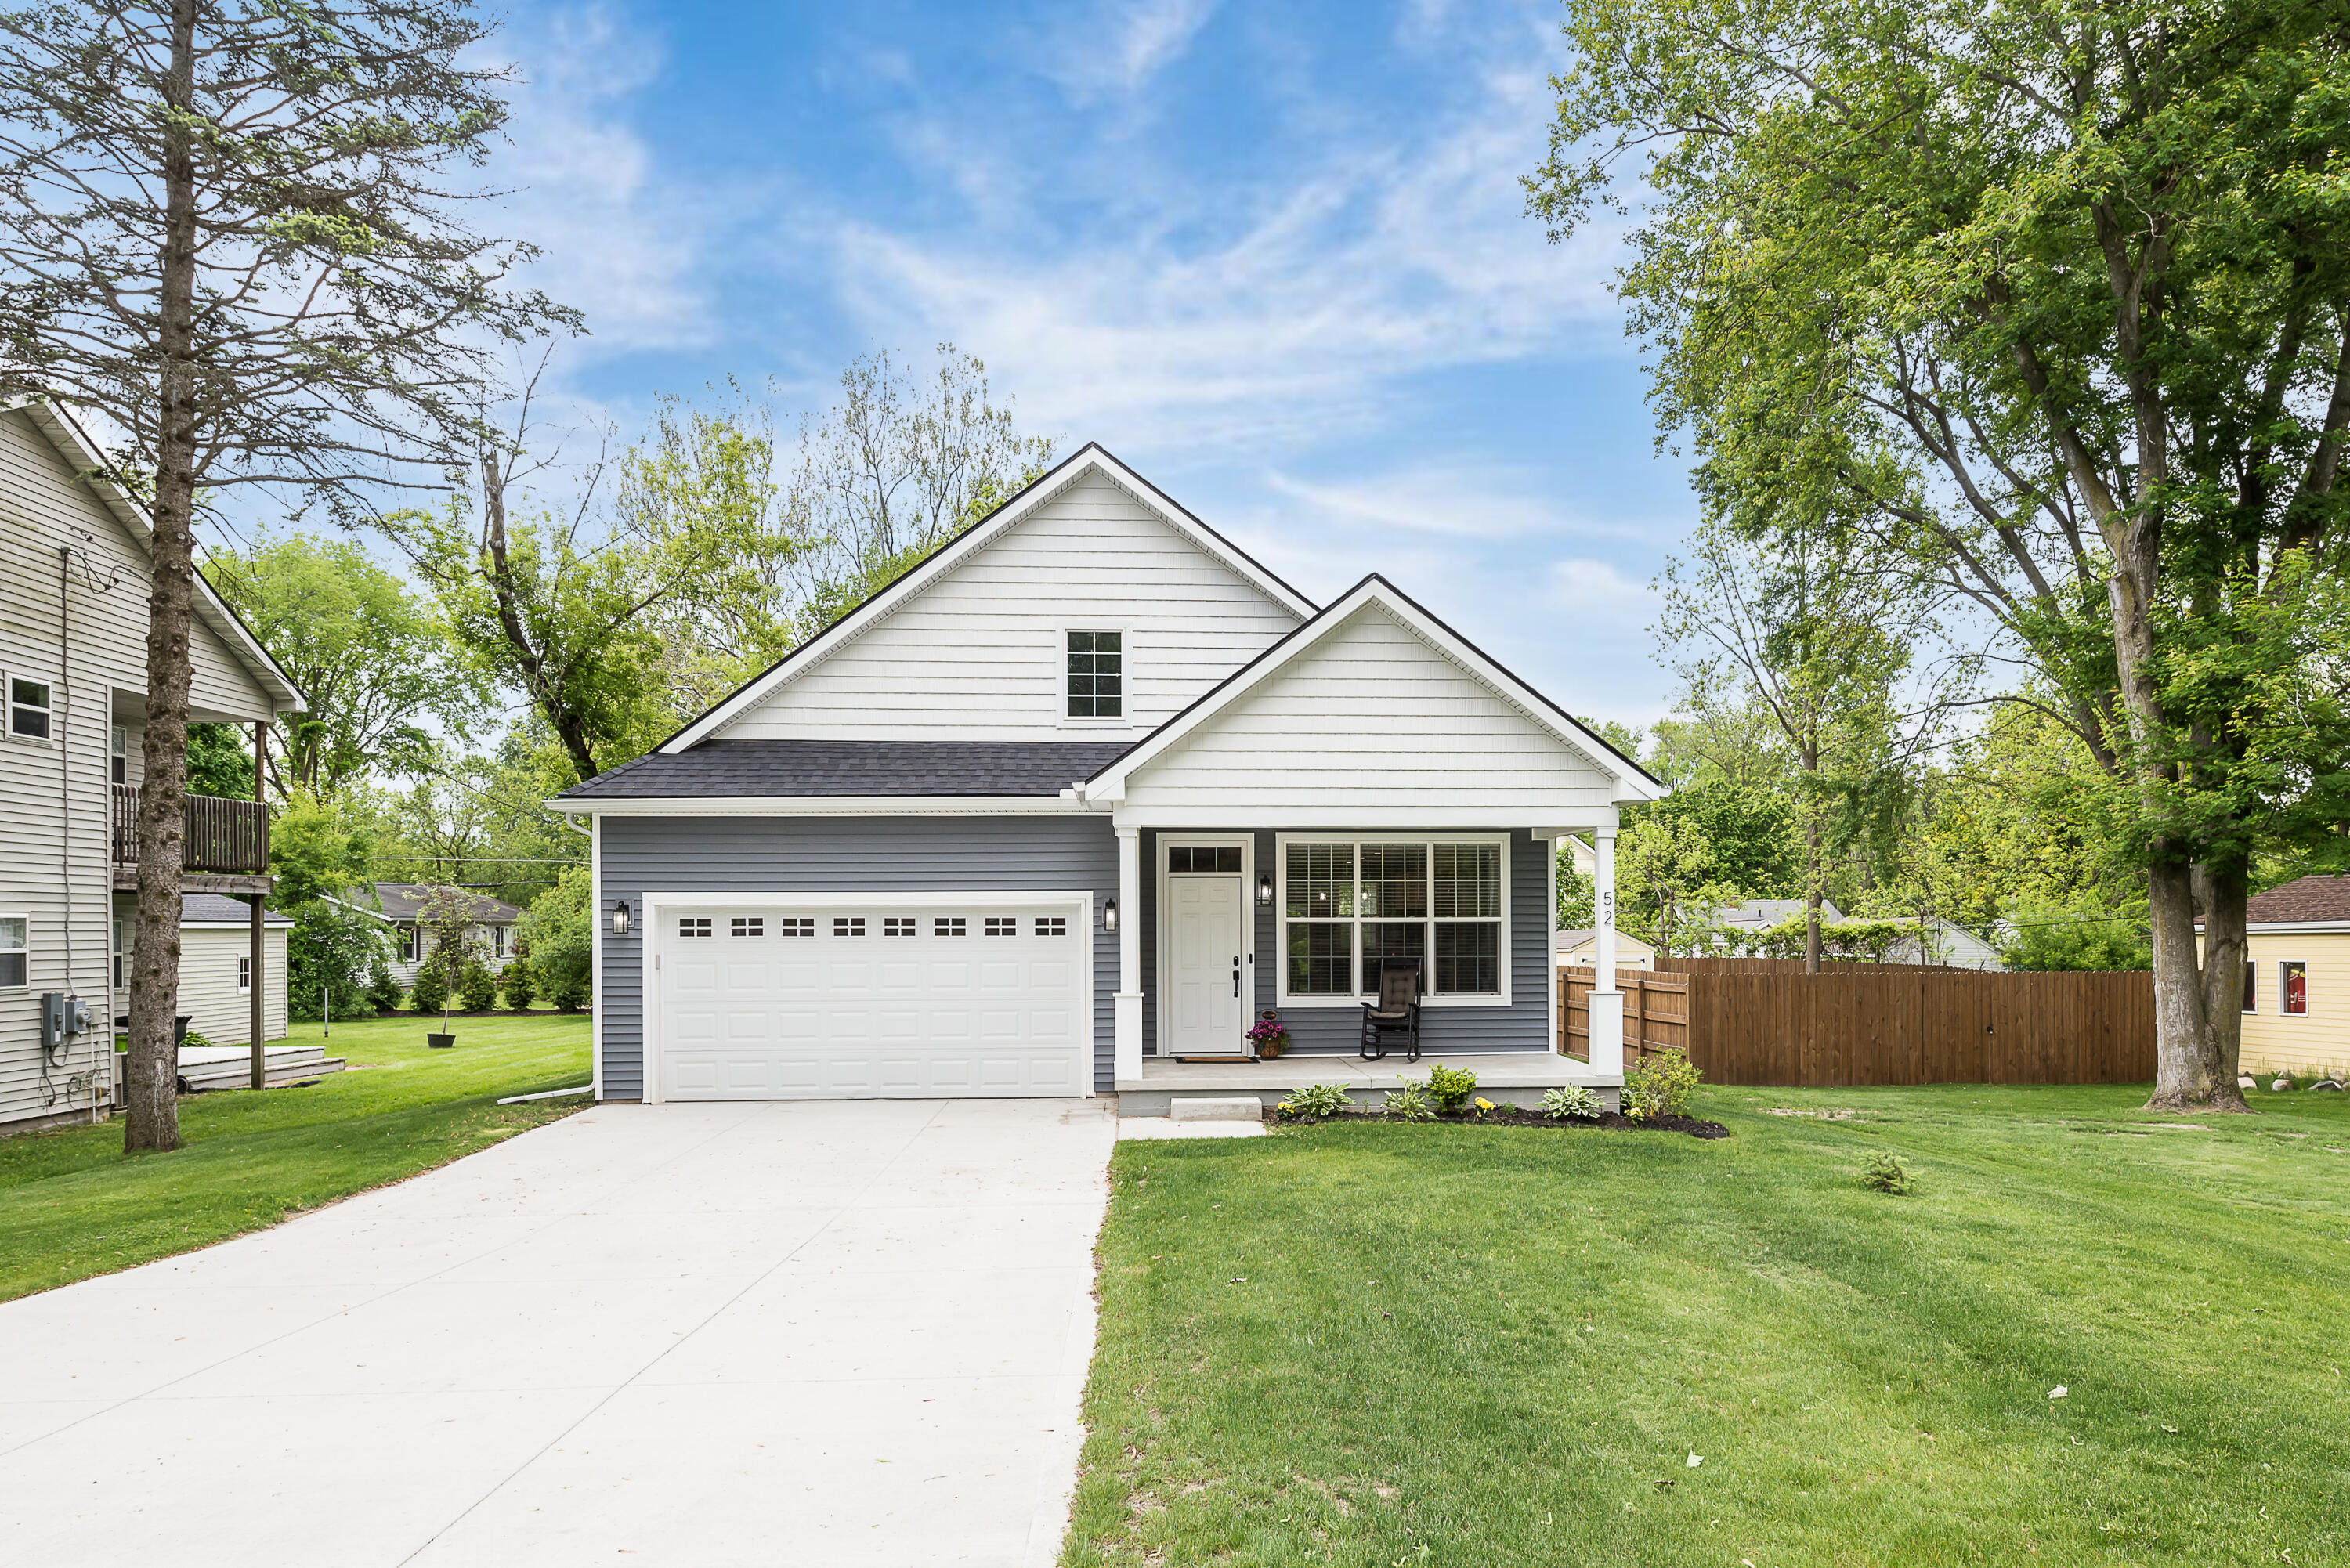
Active
$474,900
3
bds
|
2
ba
|
1,672
sqft
|
built
2022
52 Myrtle Ave, Ann Arbor, MI 48103
$-1,221
Cash flow
-13.4%
Cash-on-Cash Return
3.2%
Cap rate
0.6%
Rent to Value Ratio
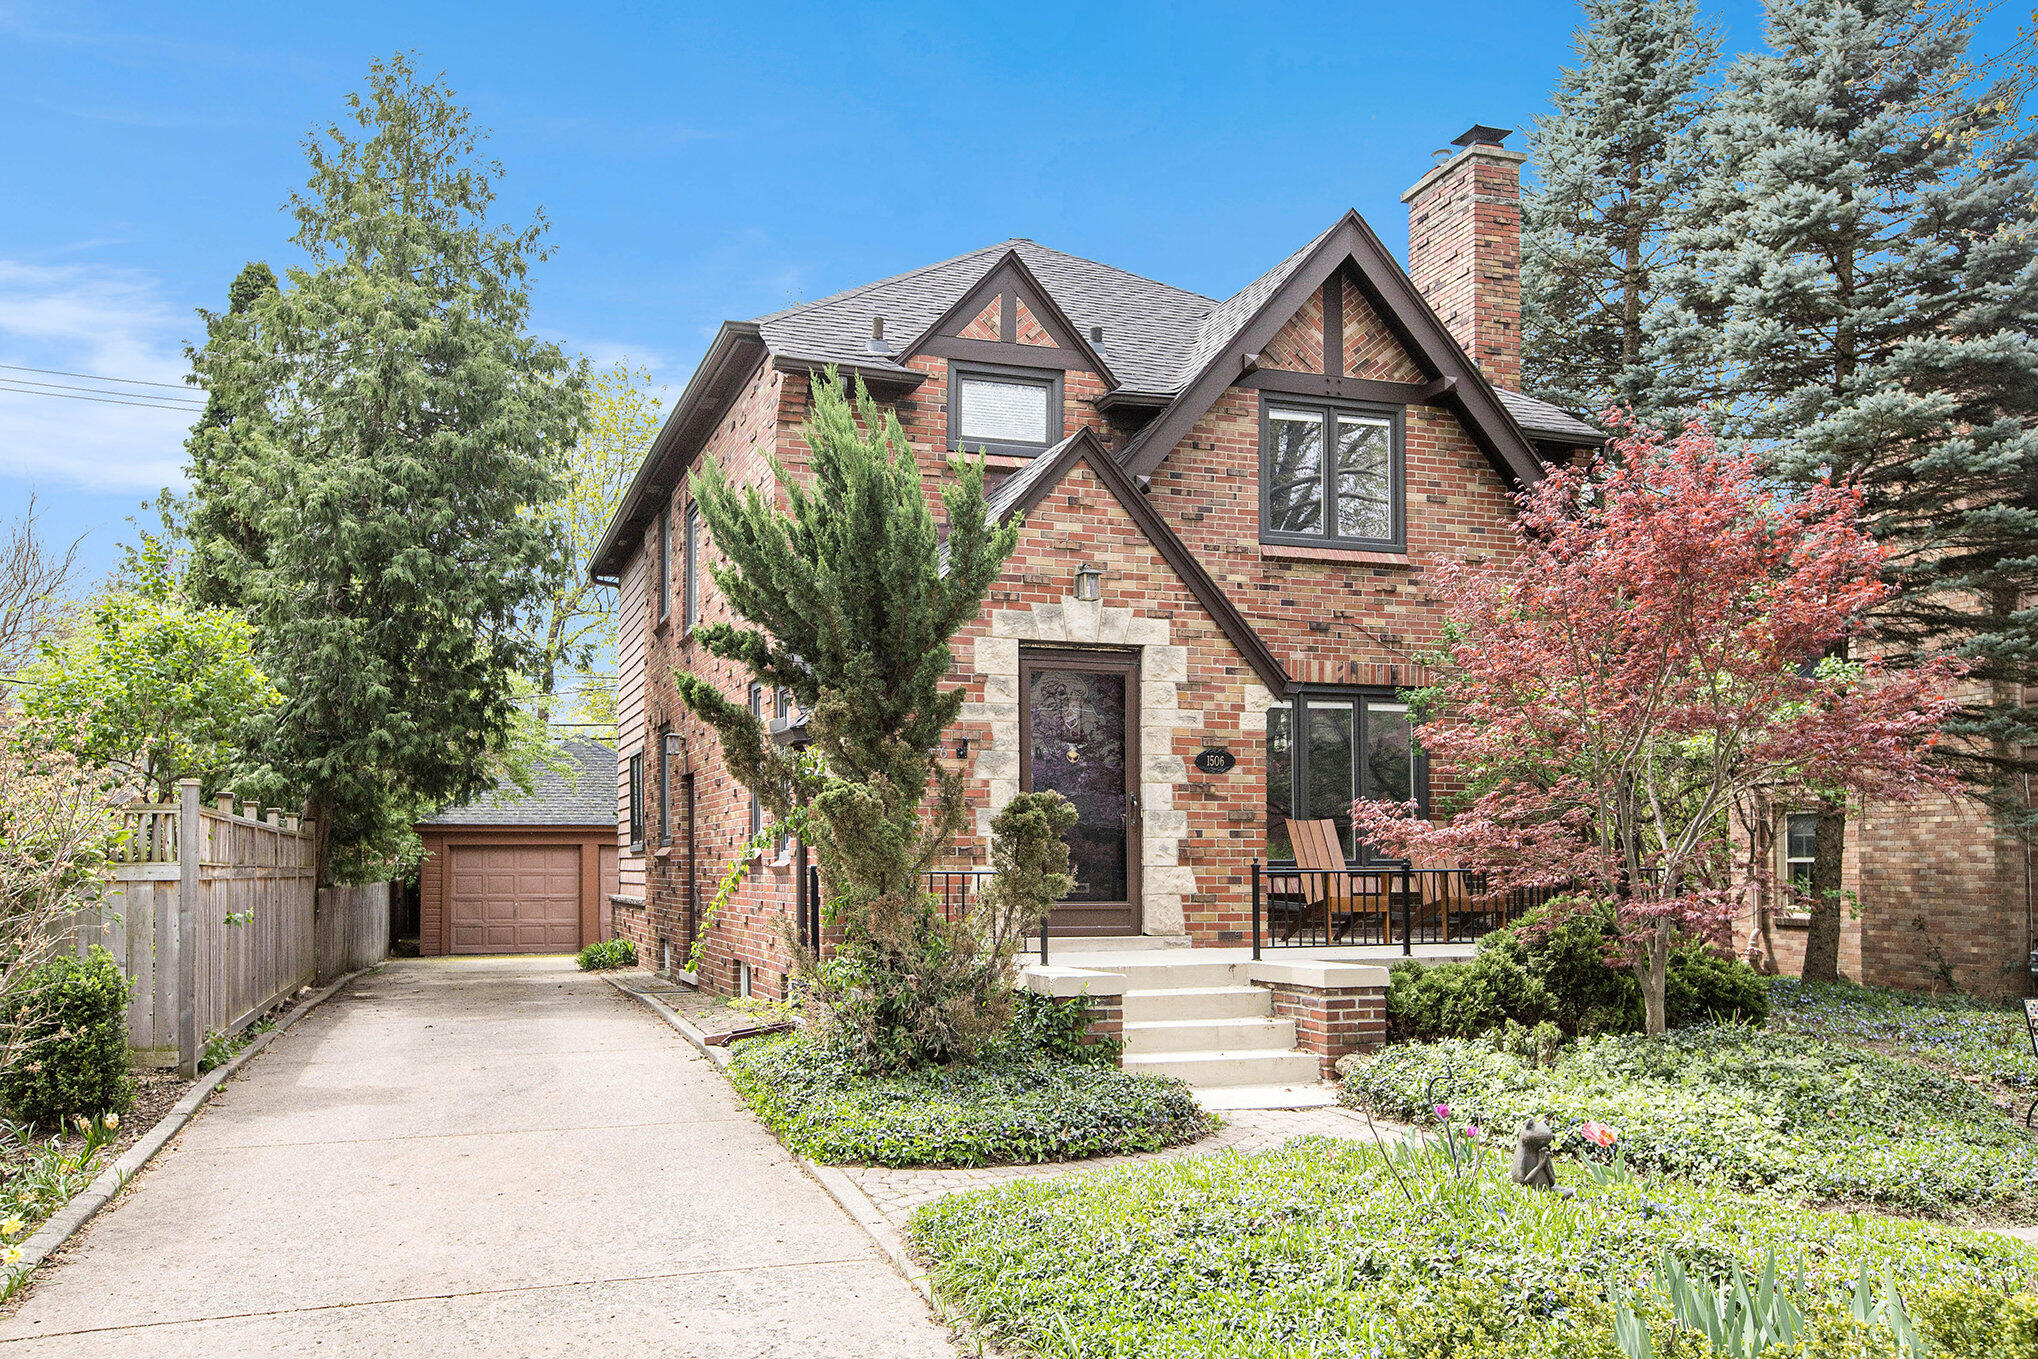
Active
$1,300,000
4
bds
|
3
ba
|
2,533
sqft
|
built
1936
1506 Shadford Rd, Ann Arbor, MI 48104
$-5,983
Cash flow
-24.0%
Cash-on-Cash Return
0.8%
Cap rate
0.3%
Rent to Value Ratio

Active
$649,000
4
bds
|
4
ba
|
3,783
sqft
|
built
1996
2853 Chaseway Dr, Ann Arbor, MI 48105
$-1,352
Cash flow
-10.9%
Cash-on-Cash Return
3.8%
Cap rate
0.5%
Rent to Value Ratio
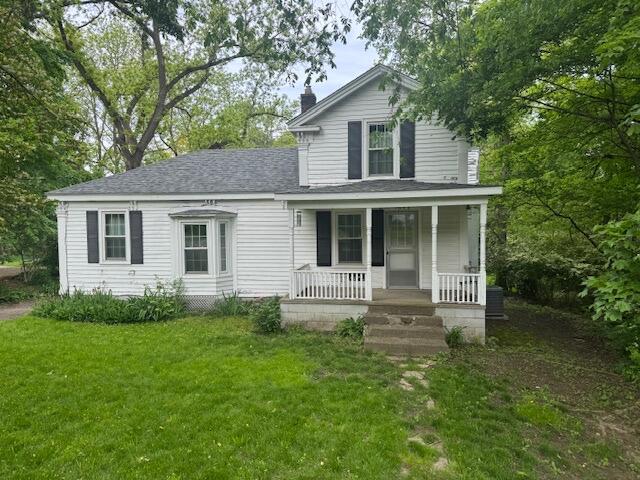
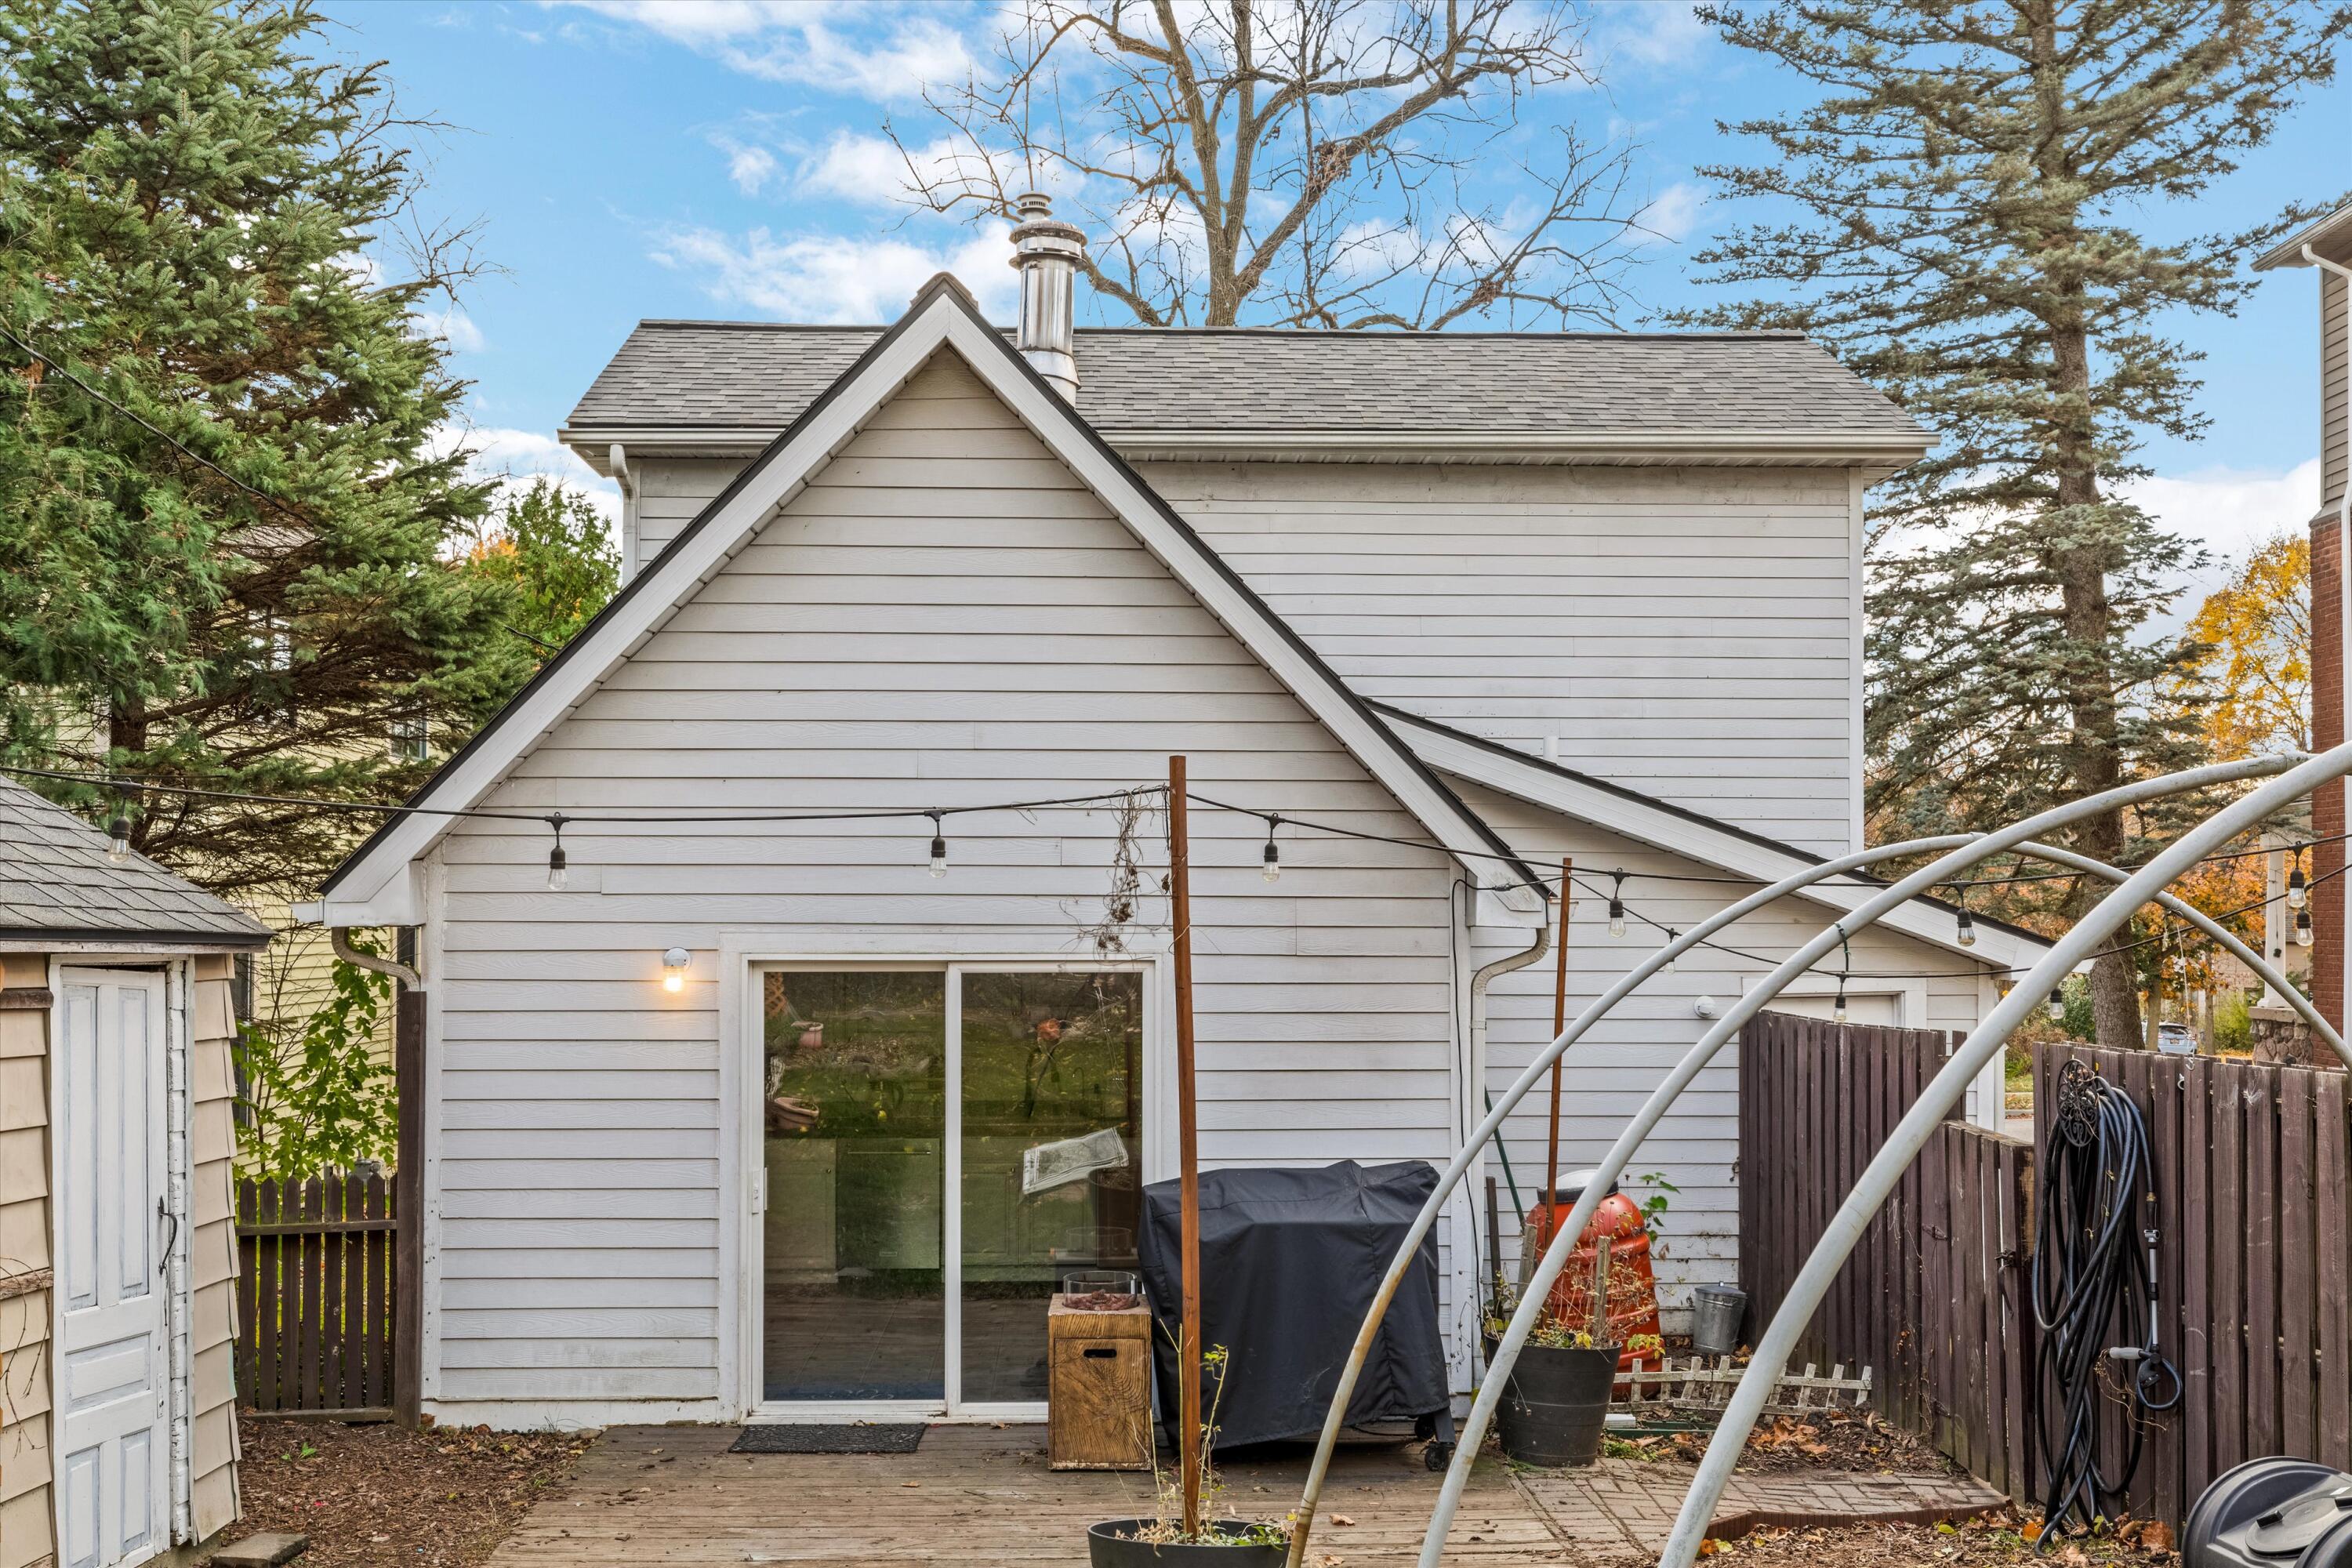
Active
$550,000
2
bds
|
1
ba
|
1,530
sqft
|
built
1901
1673 Broadway St, Ann Arbor, MI 48105
$-1,566
Cash flow
-14.9%
Cash-on-Cash Return
2.9%
Cap rate
0.5%
Rent to Value Ratio

Active
$2,750,000
5
bds
|
7
ba
|
5,237
sqft
|
built
1926
809 Berkshire Rd, Ann Arbor, MI 48104
$-12,901
Cash flow
-24.5%
Cash-on-Cash Return
0.7%
Cap rate
0.3%
Rent to Value Ratio
Active
$435,000
3
bds
|
2
ba
|
1,265
sqft
|
built
1901
626 Hiscock St, Ann Arbor, MI 48103
$-953
Cash flow
-11.4%
Cash-on-Cash Return
3.7%
Cap rate
0.7%
Rent to Value Ratio
Active
$699,500
4
bds
|
4
ba
|
3,631
sqft
|
built
1994
1860 Chicory Rdg, Ann Arbor, MI 48103
$-2,171
Cash flow
-16.2%
Cash-on-Cash Return
2.6%
Cap rate
0.5%
Rent to Value Ratio
Active under contract
$625,000
3
bds
|
2
ba
|
1,953
sqft
|
built
1950
2104 Winchell Dr, Ann Arbor, MI 48104
$-1,726
Cash flow
-14.4%
Cash-on-Cash Return
3.0%
Cap rate
0.5%
Rent to Value Ratio
Active under contract
$679,000
5
bds
|
4
ba
|
4,883
sqft
|
built
1996
5448 Waterfield Ct, Ann Arbor, MI 48108
$-2,121
Cash flow
-16.3%
Cash-on-Cash Return
2.5%
Cap rate
0.5%
Rent to Value Ratio
Active
$770,000
4
bds
|
3
ba
|
2,576
sqft
|
built
1997
712 Dornoch Dr, Ann Arbor, MI 48103
$-2,492
Cash flow
-16.9%
Cash-on-Cash Return
2.4%
Cap rate
0.5%
Rent to Value Ratio

Active
$499,900
3
bds
|
2
ba
|
2,125
sqft
|
built
1954
1066 Knight Rd, Ann Arbor, MI 48103
$-1,389
Cash flow
-14.5%
Cash-on-Cash Return
3.0%
Cap rate
0.6%
Rent to Value Ratio
Active
$465,000
3
bds
|
2
ba
|
1,950
sqft
|
built
1960
2534 Pamela Ave, Ann Arbor, MI 48103
$-1,130
Cash flow
-12.7%
Cash-on-Cash Return
3.4%
Cap rate
0.6%
Rent to Value Ratio
Active
$498,000
3
bds
|
2
ba
|
1,892
sqft
|
built
1956
1706 Dunmore Rd, Ann Arbor, MI 48103
$-1,240
Cash flow
-13.0%
Cash-on-Cash Return
3.3%
Cap rate
0.6%
Rent to Value Ratio
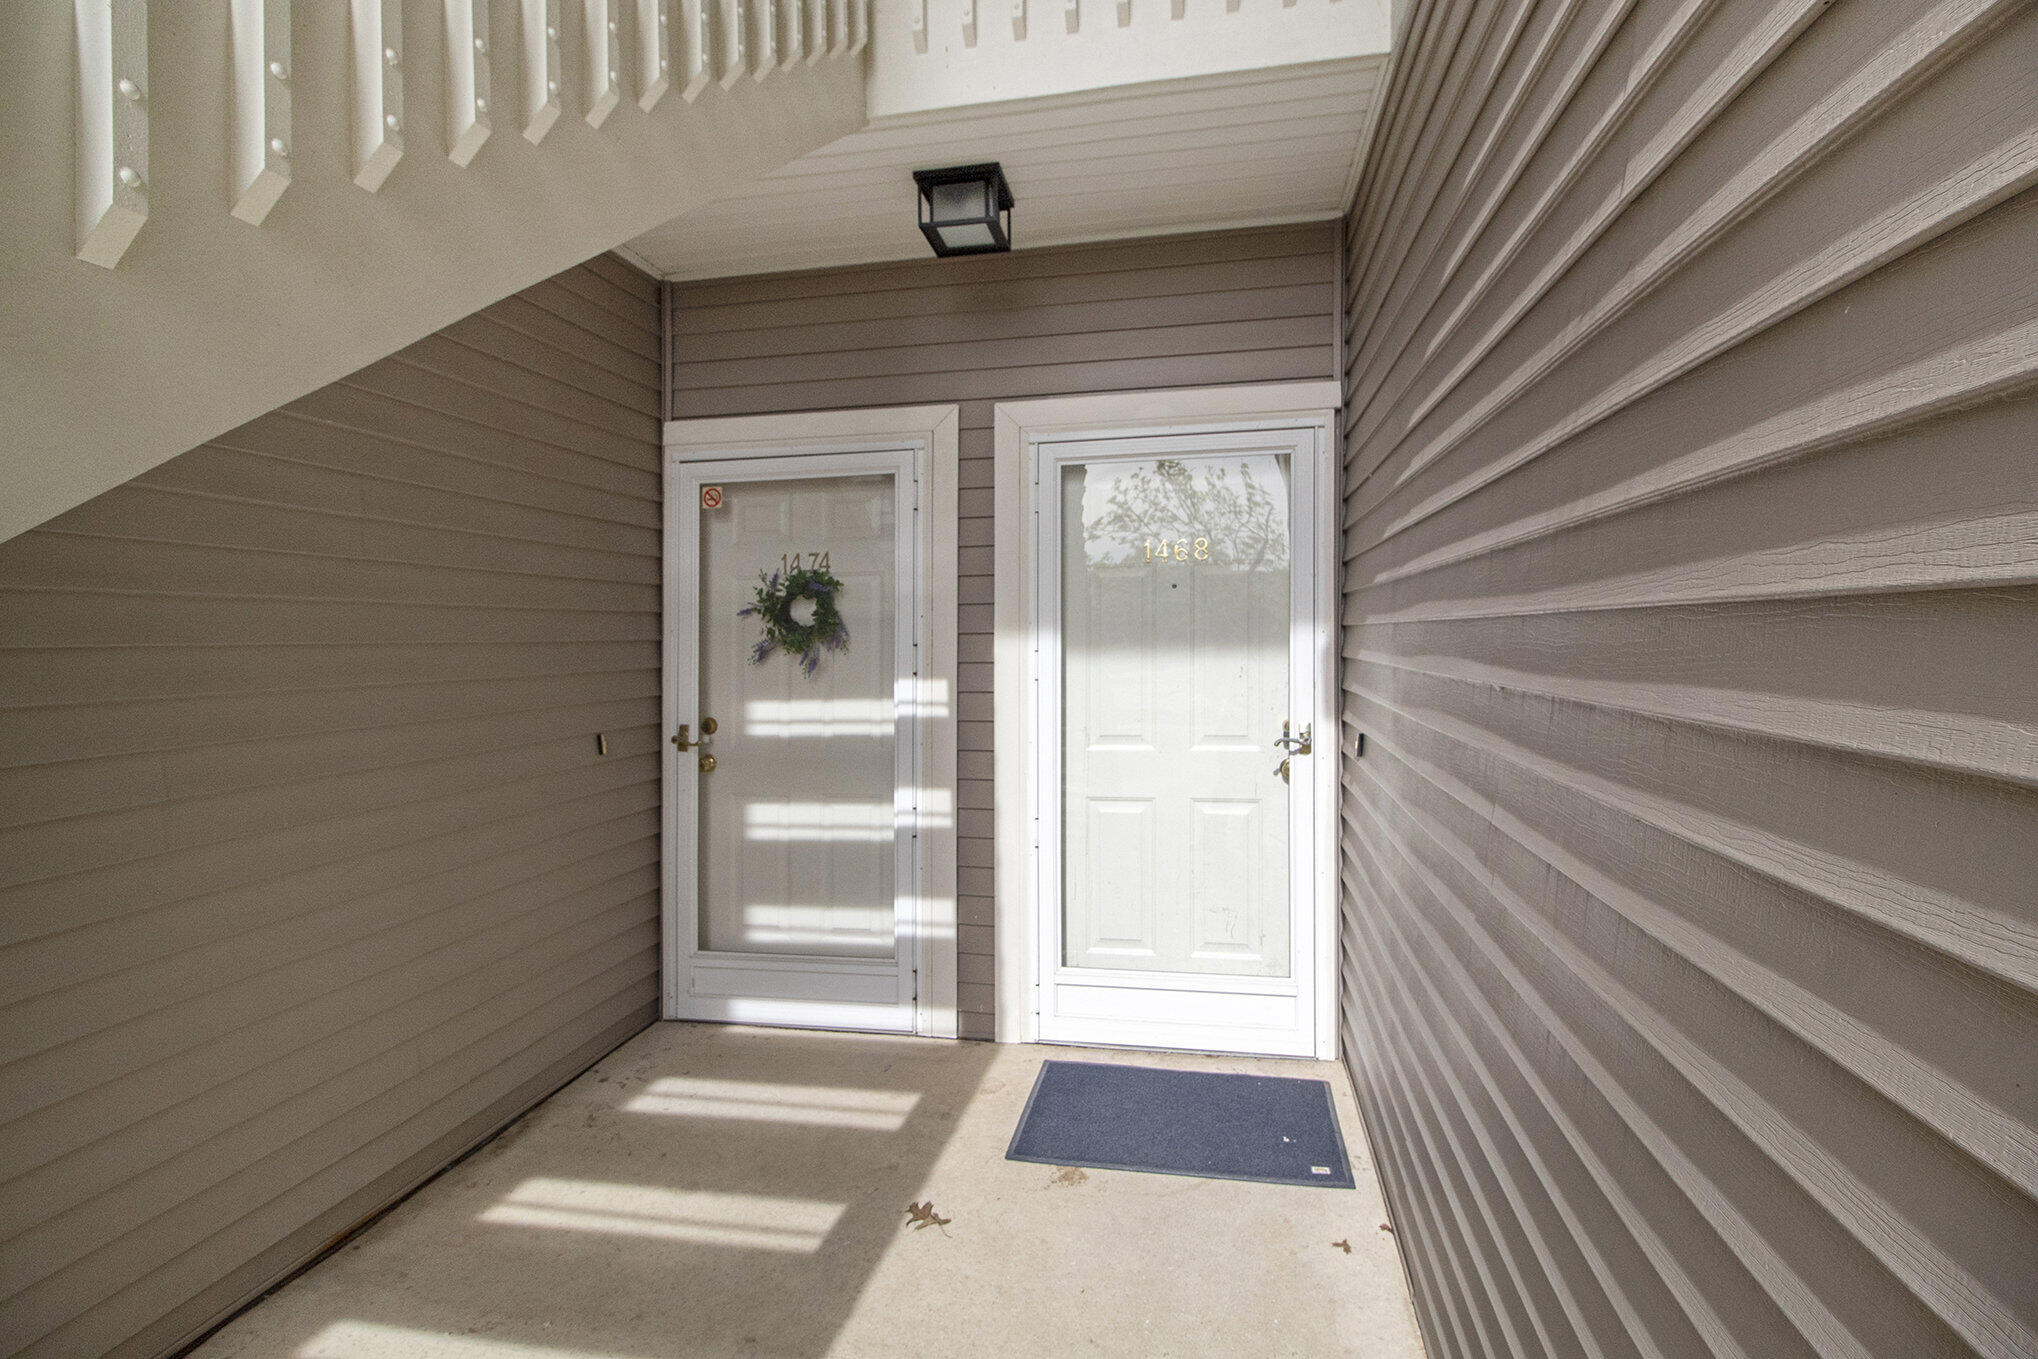
Active
$295,900
2
bds
|
2
ba
|
1,382
sqft
|
built
1999
1468 Fox Pointe Cir, Ann Arbor, MI 48108
$-874
Cash flow
-15.4%
Cash-on-Cash Return
2.7%
Cap rate
0.7%
Rent to Value Ratio
Active under contract
$335,000
3
bds
|
2
ba
|
1,604
sqft
|
built
1966
3168 Lorraine St, Ann Arbor, MI 48108
$-522
Cash flow
-8.1%
Cash-on-Cash Return
4.4%
Cap rate
0.7%
Rent to Value Ratio

Active under contract
$537,000
3
bds
|
2
ba
|
2,115
sqft
|
built
1927
1471 Kensington Dr, Ann Arbor, MI 48104
$-1,195
Cash flow
-11.6%
Cash-on-Cash Return
3.6%
Cap rate
0.6%
Rent to Value Ratio

Active under contract
$895,000
3
bds
|
3
ba
|
2,300
sqft
|
built
1951
3377 Timberwood Ln, Ann Arbor, MI 48103
$-3,247
Cash flow
-18.9%
Cash-on-Cash Return
1.9%
Cap rate
0.3%
Rent to Value Ratio
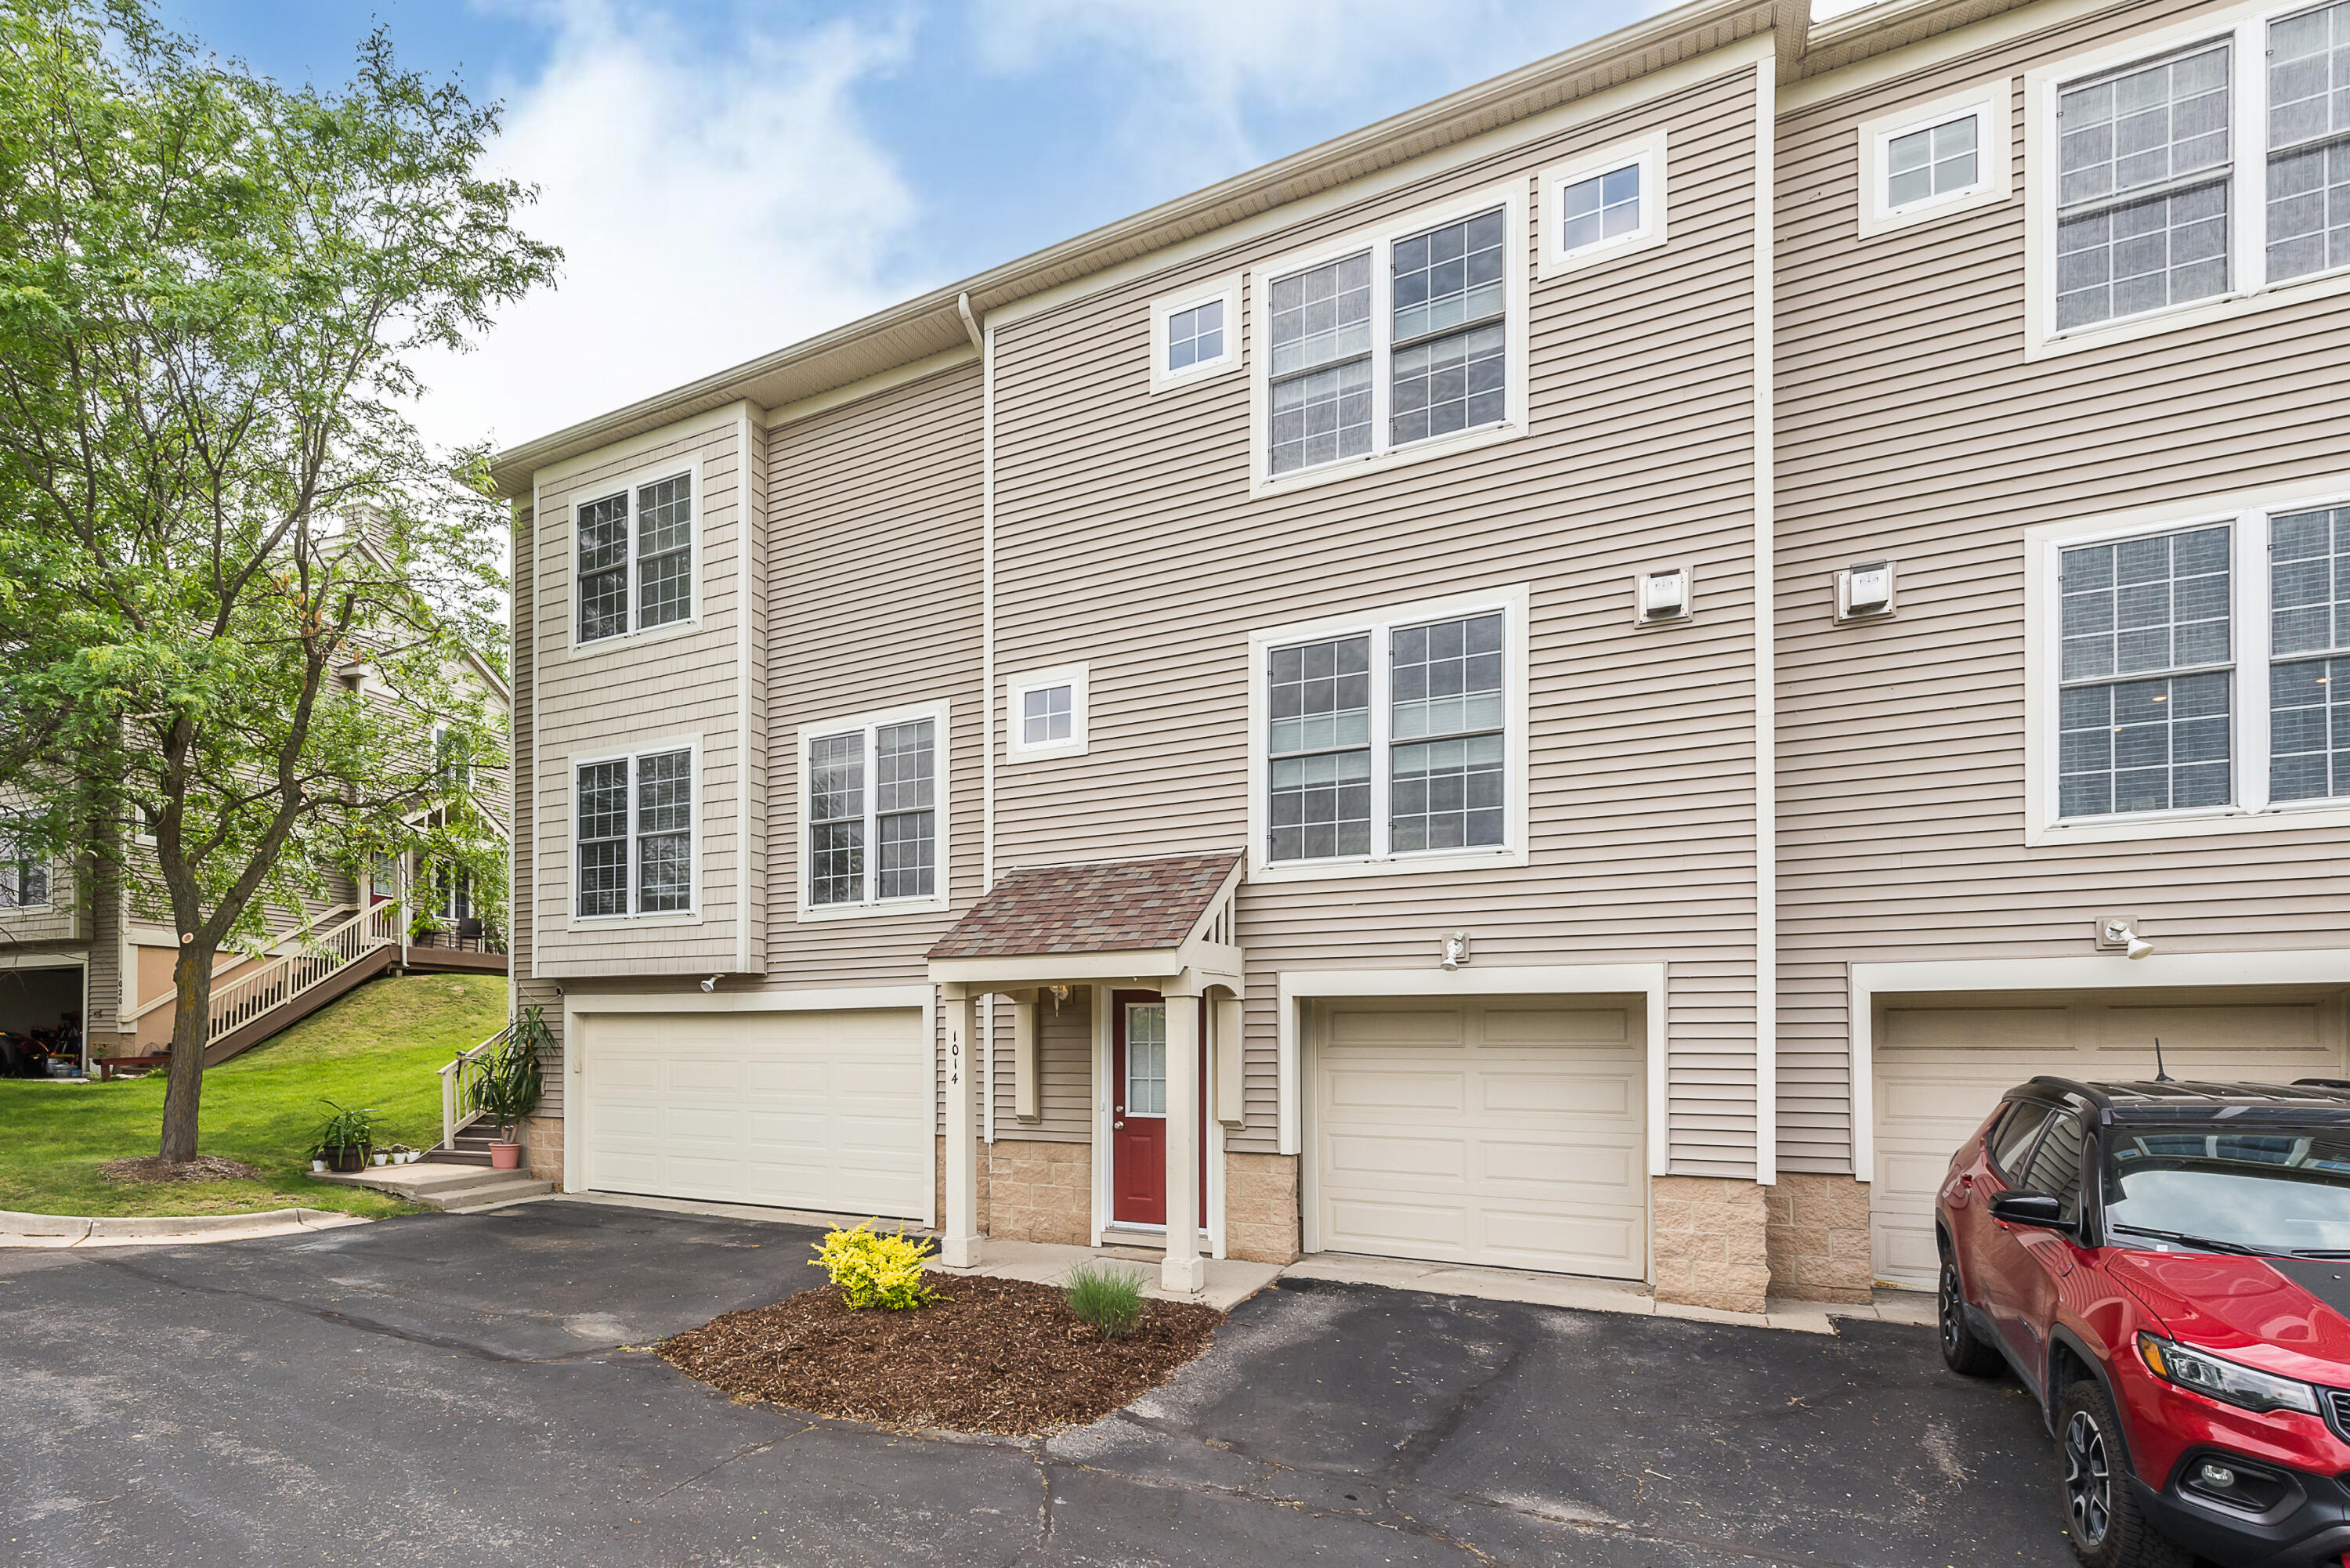
Active
$294,900
2
bds
|
3
ba
|
1,158
sqft
|
built
2001
1014 Bluestem Ln, Ann Arbor, MI 48103
$-971
Cash flow
-17.2%
Cash-on-Cash Return
2.3%
Cap rate
0.8%
Rent to Value Ratio

Pending
$310,000
2
bds
|
2
ba
|
1,152
sqft
|
built
1976
757 Peninsula Ct, Ann Arbor, MI 48105
$-1,444
Cash flow
-24.3%
Cash-on-Cash Return
0.7%
Cap rate
0.6%
Rent to Value Ratio
Active
$749,900
3
bds
|
3
ba
|
2,024
sqft
|
built
1932
1308 Linwood Ave, Ann Arbor, MI 48103
$-1,635
Cash flow
-11.4%
Cash-on-Cash Return
3.7%
Cap rate
0.5%
Rent to Value Ratio
Active
$1,595,000
5
bds
|
5
ba
|
5,838
sqft
|
built
1990
2002 Valleyview Dr, Ann Arbor, MI 48105
$-7,397
Cash flow
-24.2%
Cash-on-Cash Return
0.7%
Cap rate
0.3%
Rent to Value Ratio

Active under contract
$719,000
5
bds
|
4
ba
|
3,452
sqft
|
built
1993
4223 Spring Lake Blvd, Ann Arbor, MI 48108
$-2,025
Cash flow
-14.7%
Cash-on-Cash Return
2.9%
Cap rate
0.5%
Rent to Value Ratio
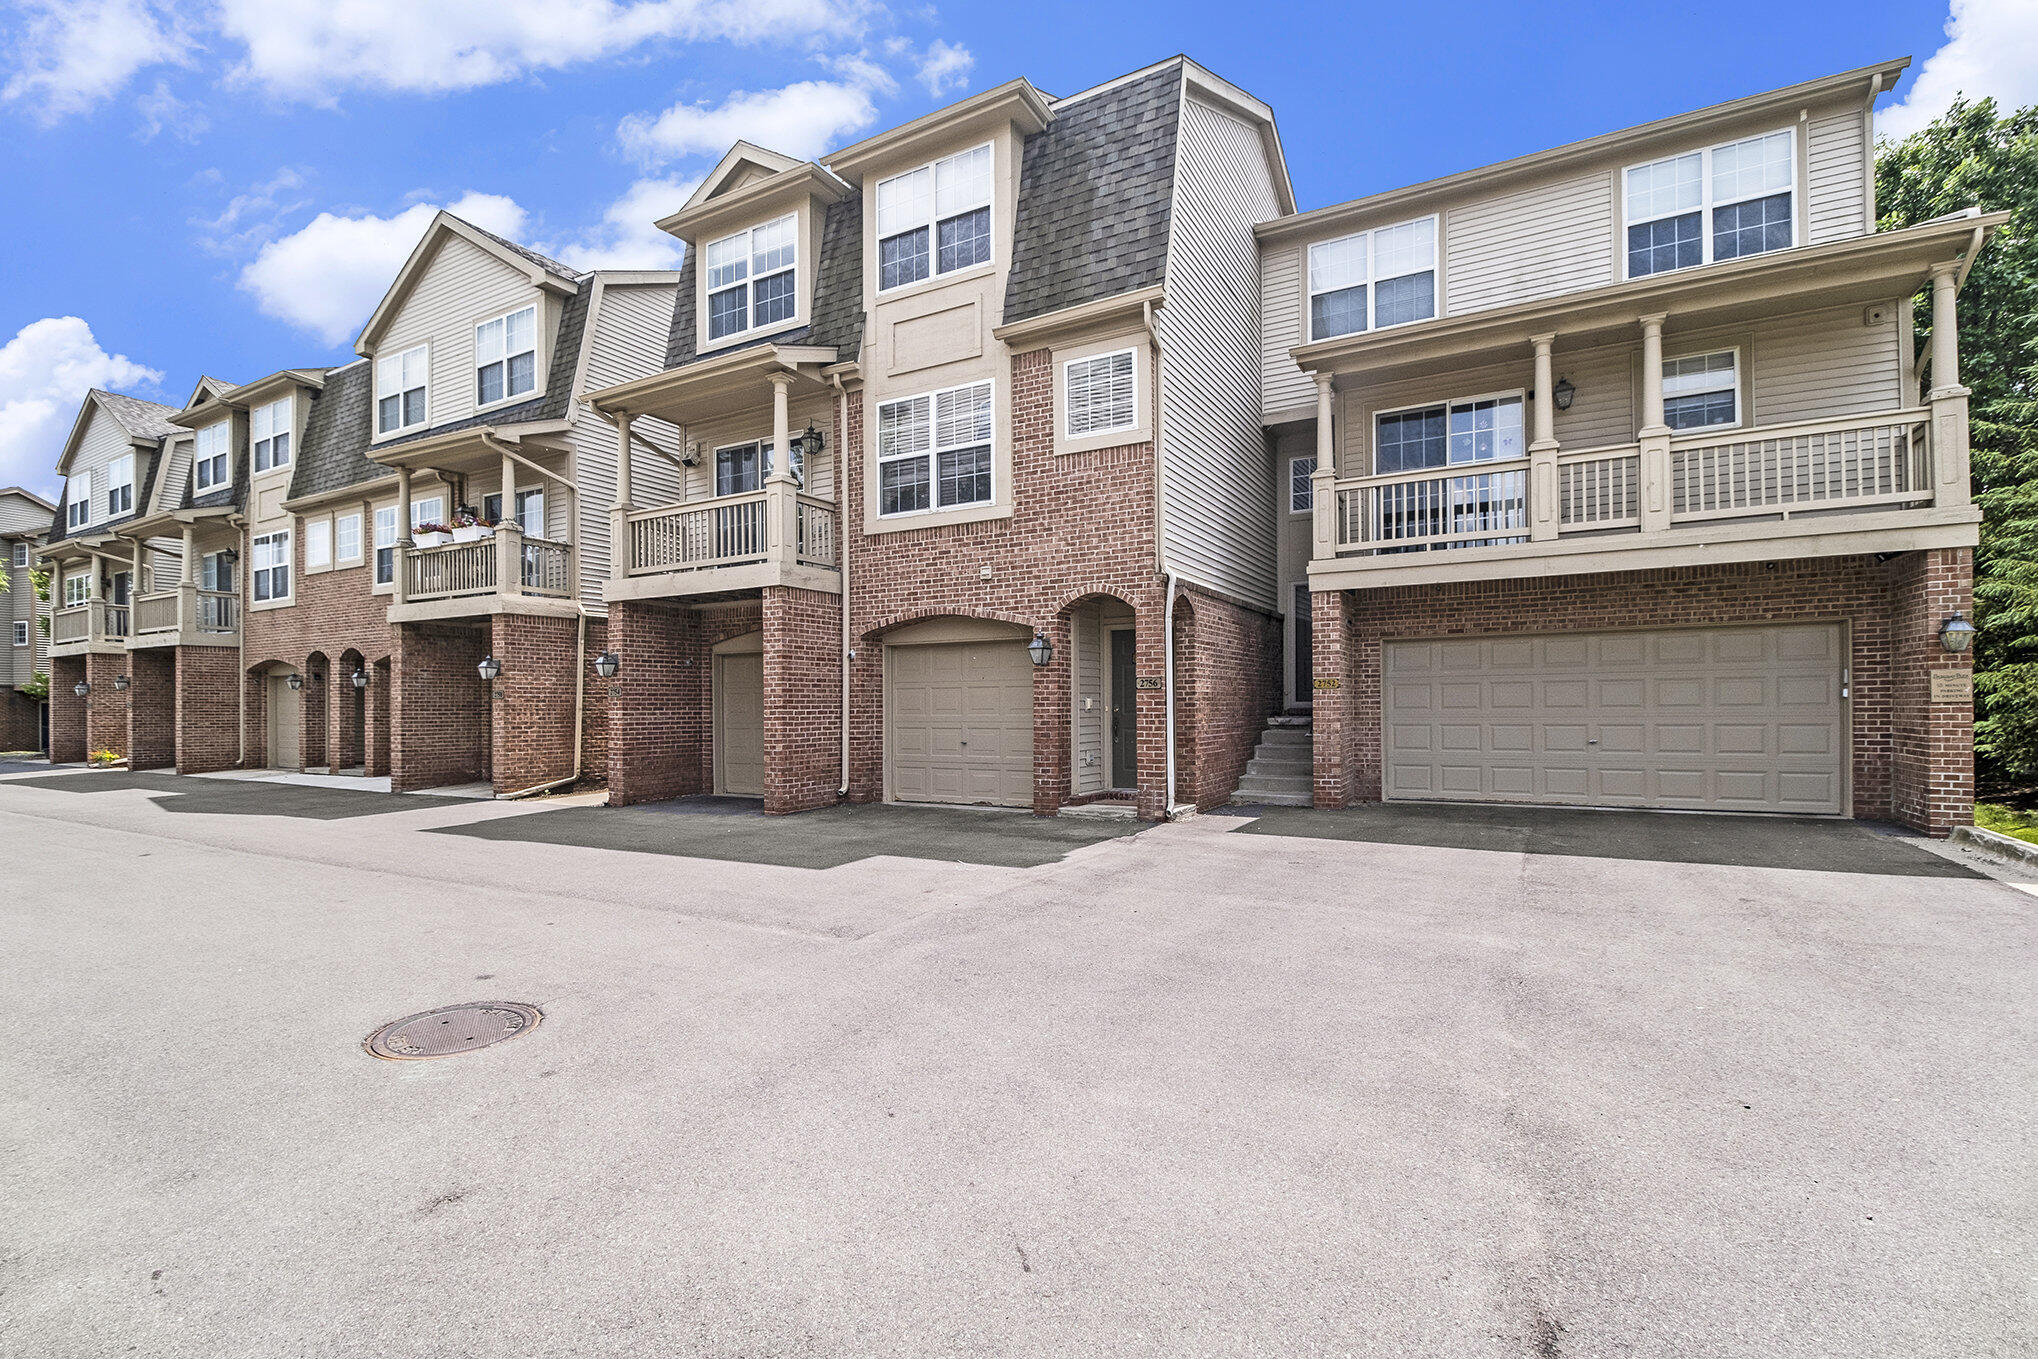
Active
$320,000
2
bds
|
3
ba
|
1,148
sqft
|
built
1999
2756 Barclay Way, Ann Arbor, MI 48105
$-1,188
Cash flow
-19.4%
Cash-on-Cash Return
1.8%
Cap rate
0.6%
Rent to Value Ratio
Active
$650,000
4
bds
|
2
ba
|
2,612
sqft
|
built
1988
2250 Peters Rd, Ann Arbor, MI 48103
$-333
Cash flow
-2.7%
Cash-on-Cash Return
5.7%
Cap rate
0.9%
Rent to Value Ratio
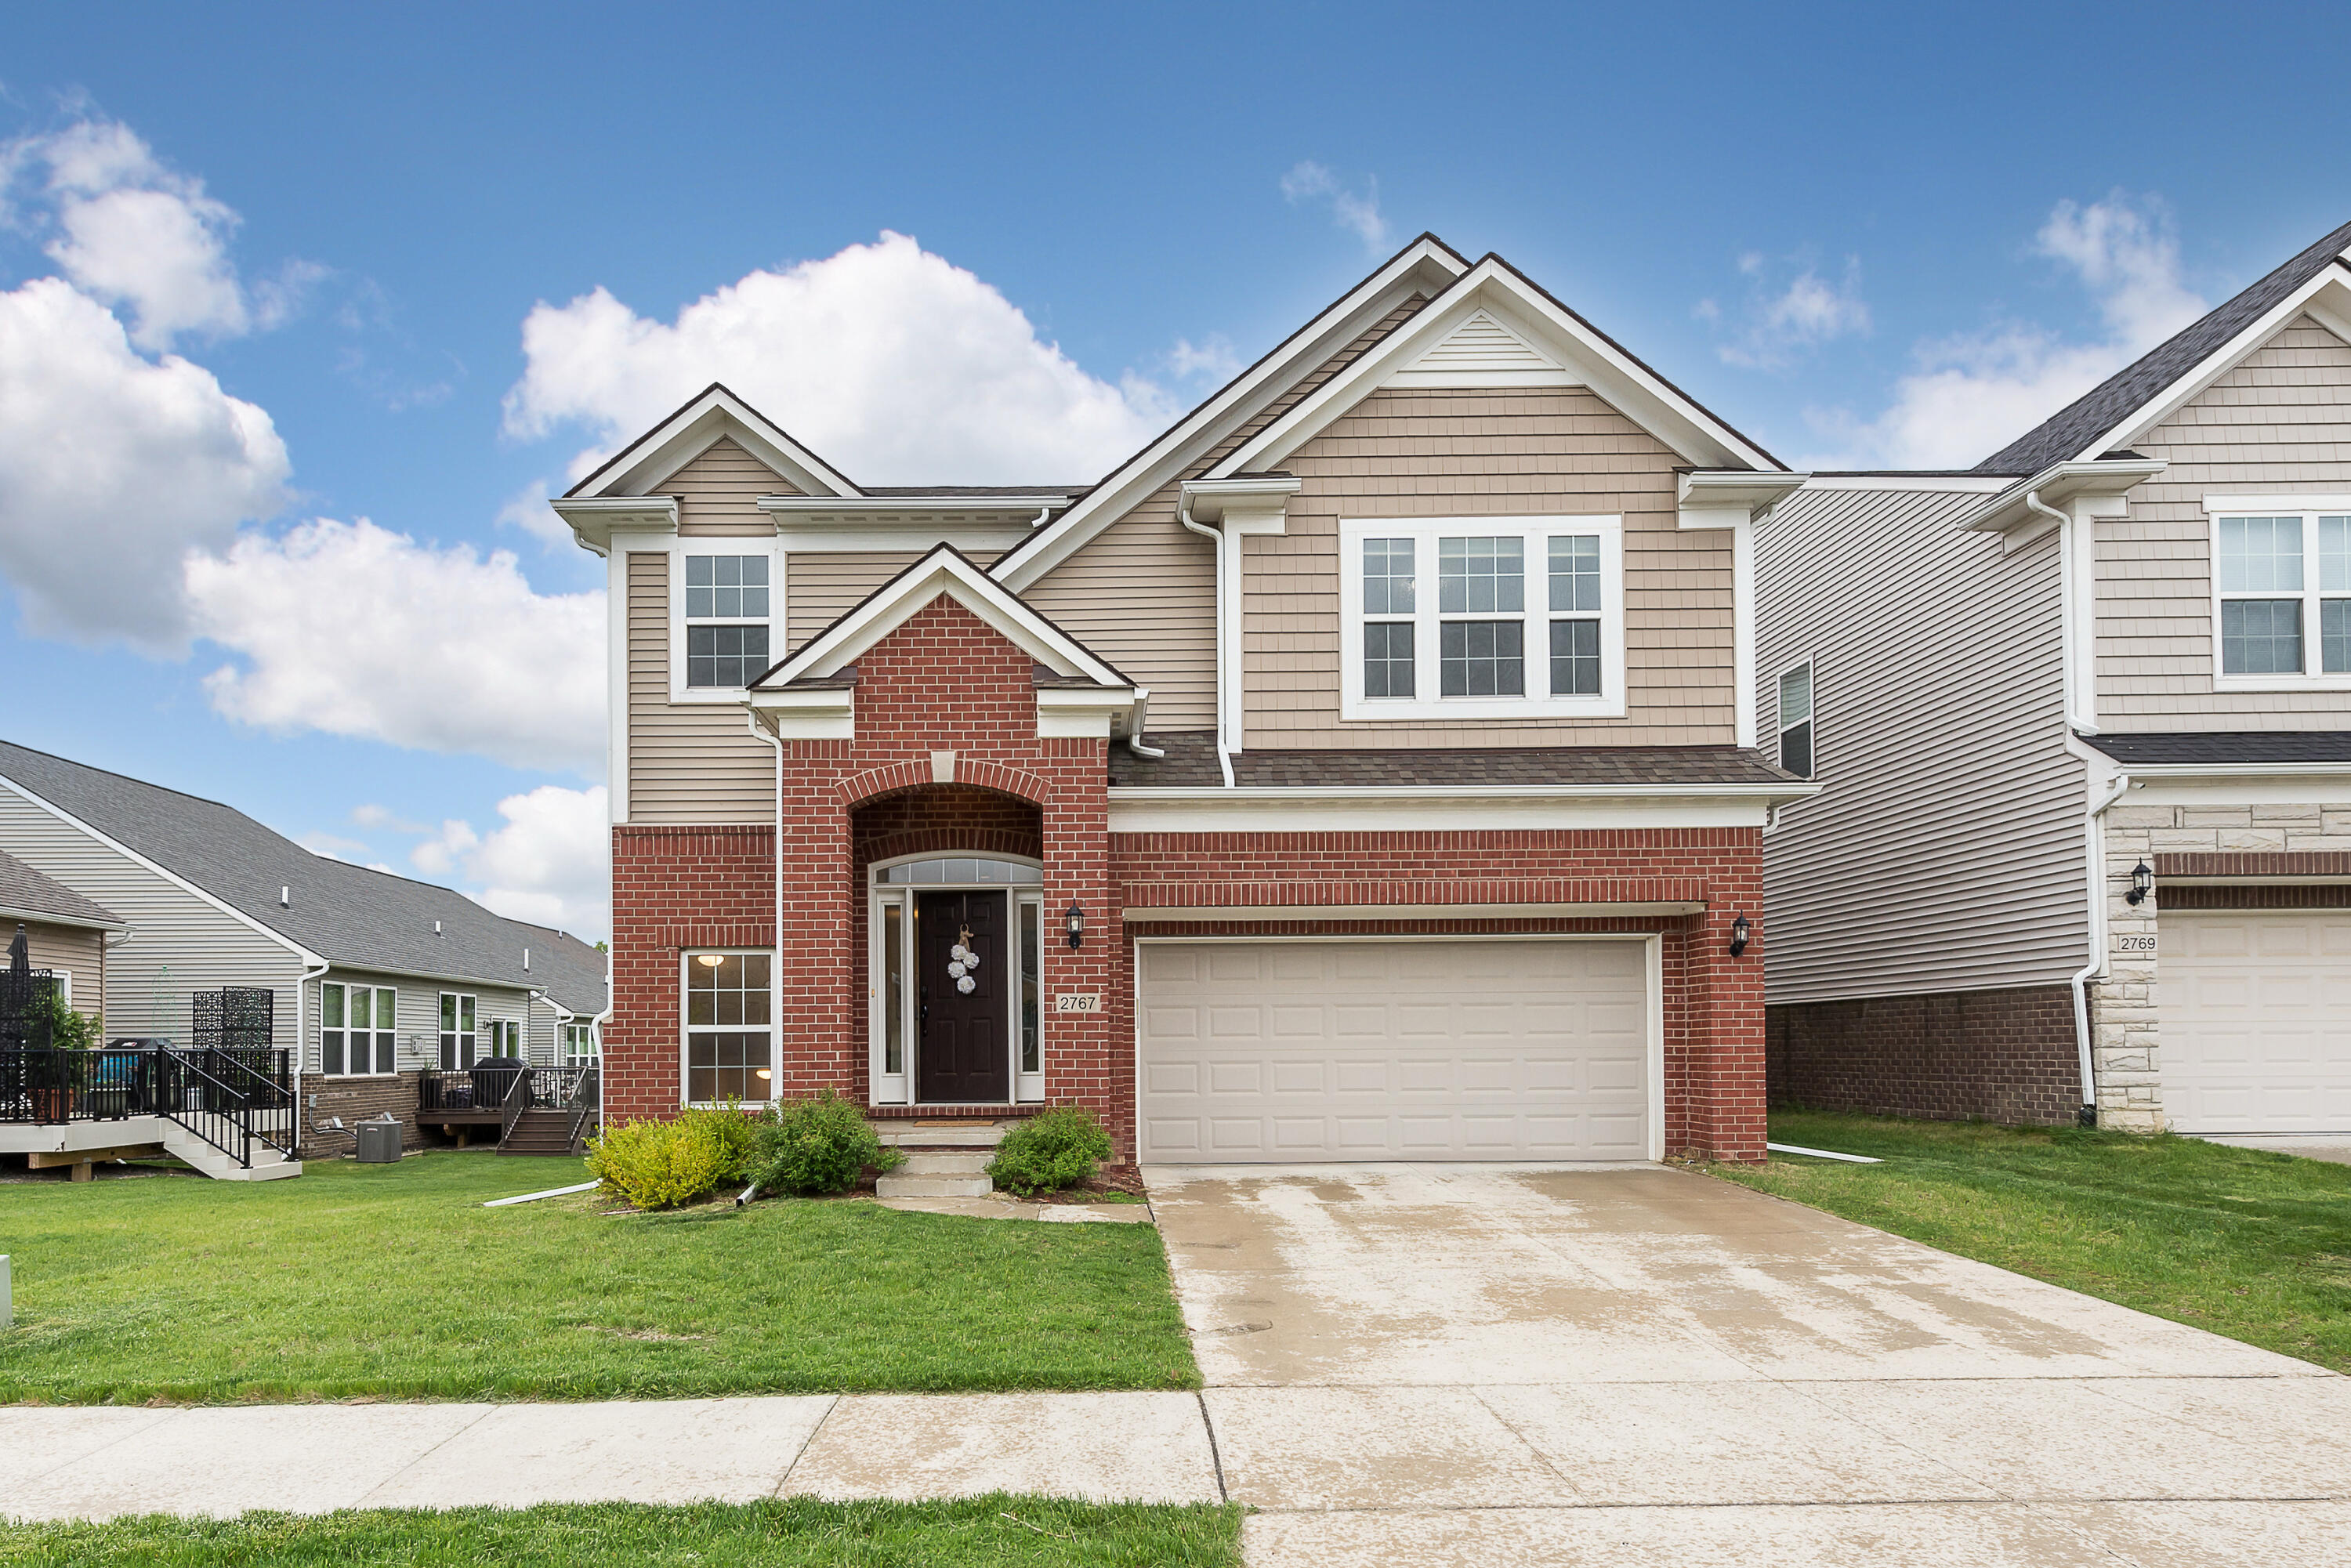
Active
$799,900
4
bds
|
3
ba
|
3,267
sqft
|
built
2019
2767 St. Regis Way, Ann Arbor, MI 48105
$-2,937
Cash flow
-19.2%
Cash-on-Cash Return
1.9%
Cap rate
0.5%
Rent to Value Ratio
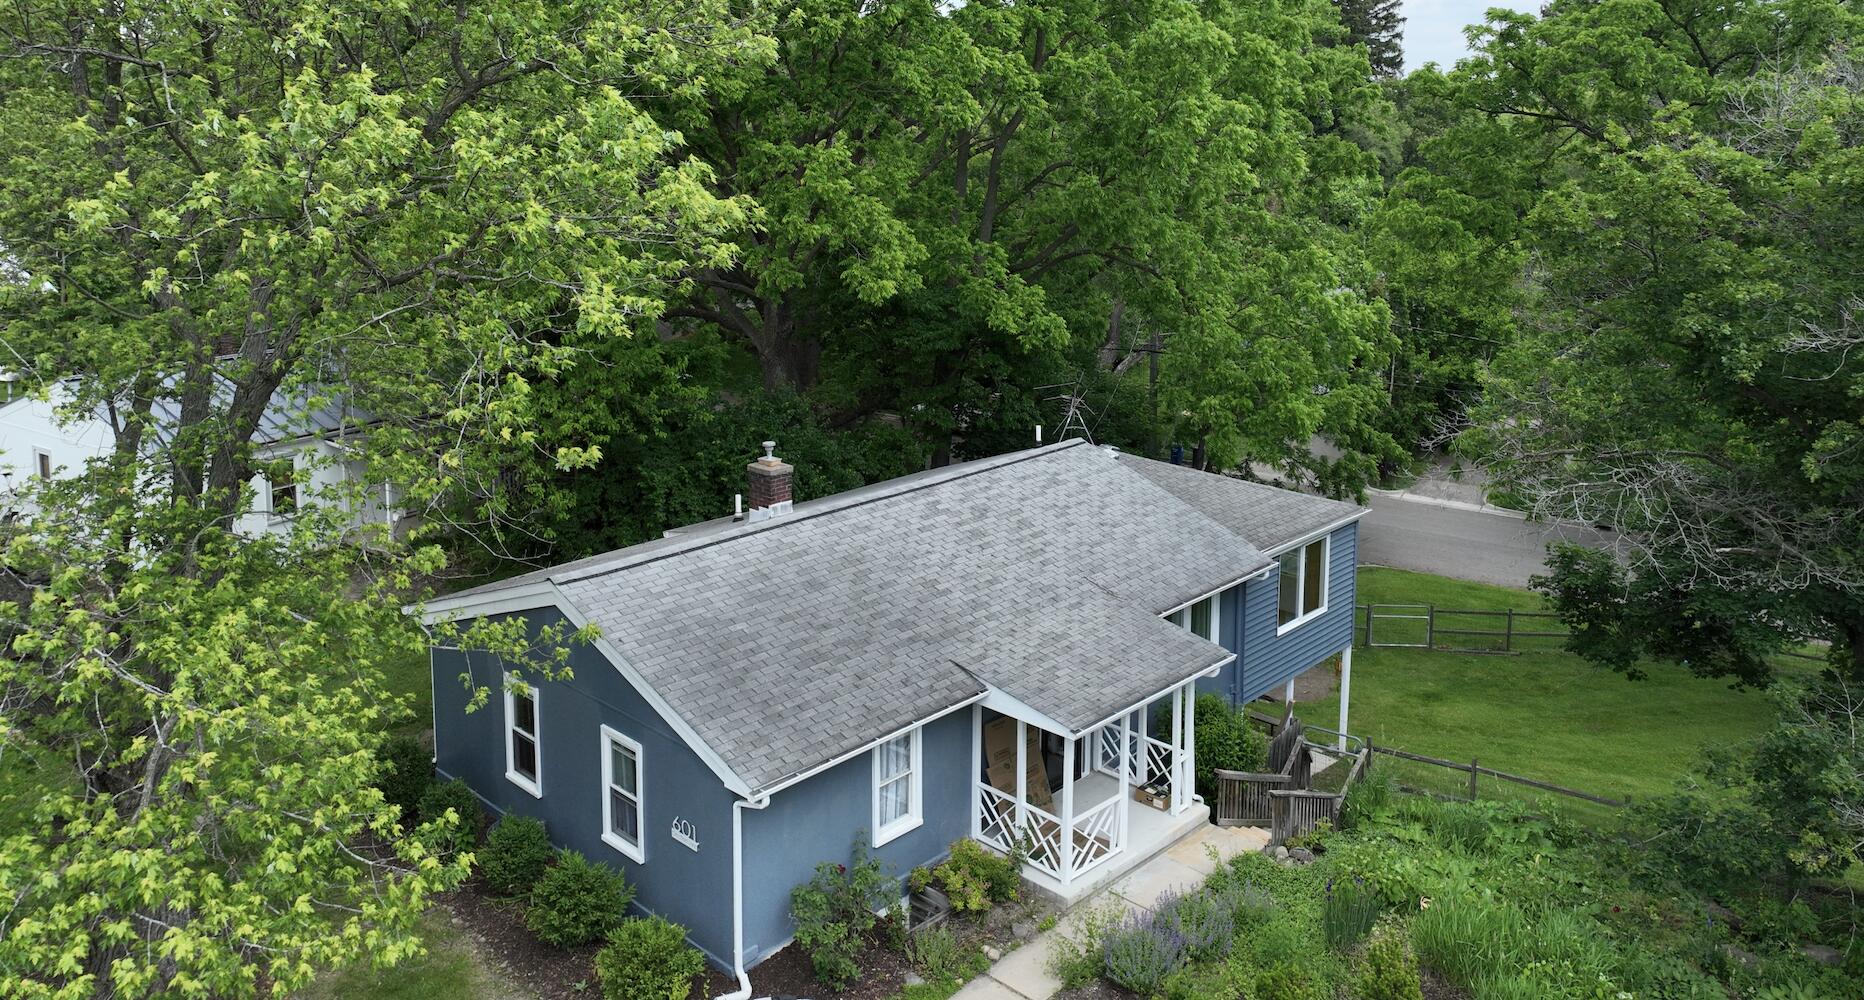
Active
$549,000
4
bds
|
1
ba
|
2,040
sqft
|
built
1948
601 Cressfield Ln, Ann Arbor, MI 48103
$-1,549
Cash flow
-14.7%
Cash-on-Cash Return
2.9%
Cap rate
0.5%
Rent to Value Ratio
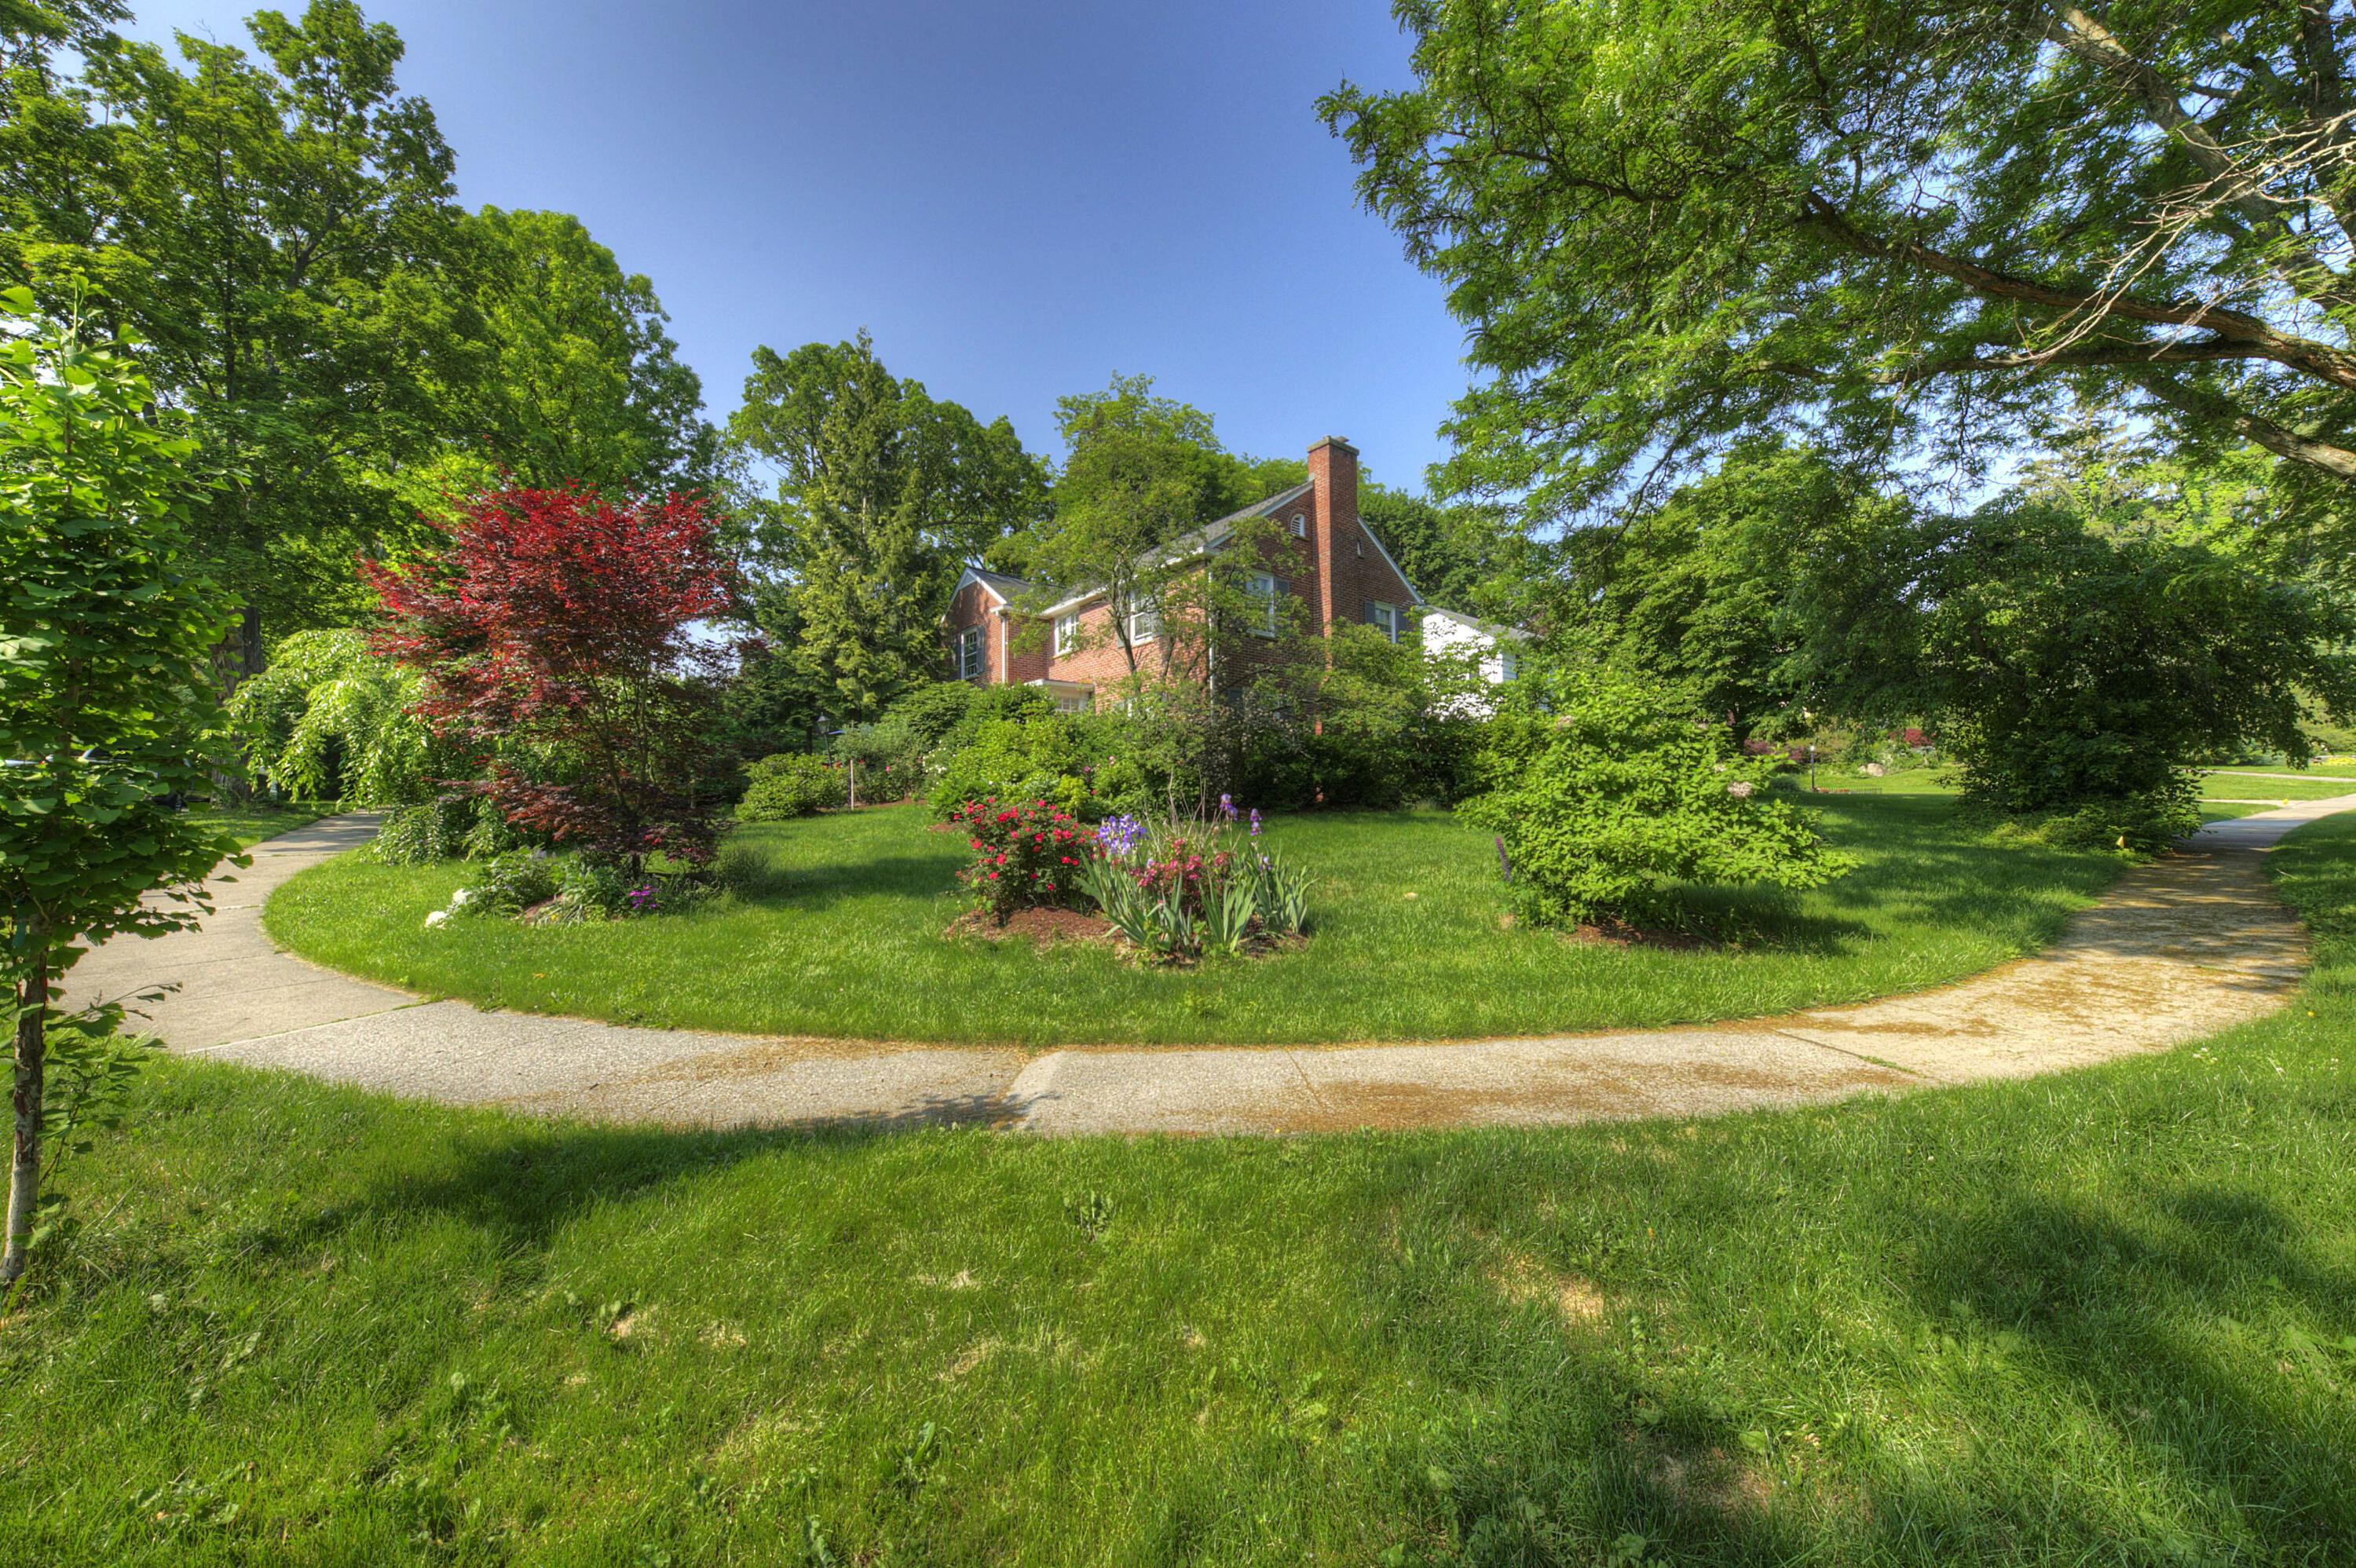
Active
$1,399,000
4
bds
|
4
ba
|
3,572
sqft
|
built
1948
700 Avon Rd, Ann Arbor, MI 48104
$-6,158
Cash flow
-23.0%
Cash-on-Cash Return
1.0%
Cap rate
0.4%
Rent to Value Ratio

Active
$659,000
4
bds
|
3
ba
|
2,230
sqft
|
built
1972
3673 Pheasant Dr, Ann Arbor, MI 48103
$-1,859
Cash flow
-14.7%
Cash-on-Cash Return
2.9%
Cap rate
0.5%
Rent to Value Ratio
Active
$1,649,000
4
bds
|
6
ba
|
6,454
sqft
|
built
1992
2925 Exmoor Rd, Ann Arbor, MI 48104
$-8,092
Cash flow
-25.6%
Cash-on-Cash Return
0.4%
Cap rate
0.2%
Rent to Value Ratio
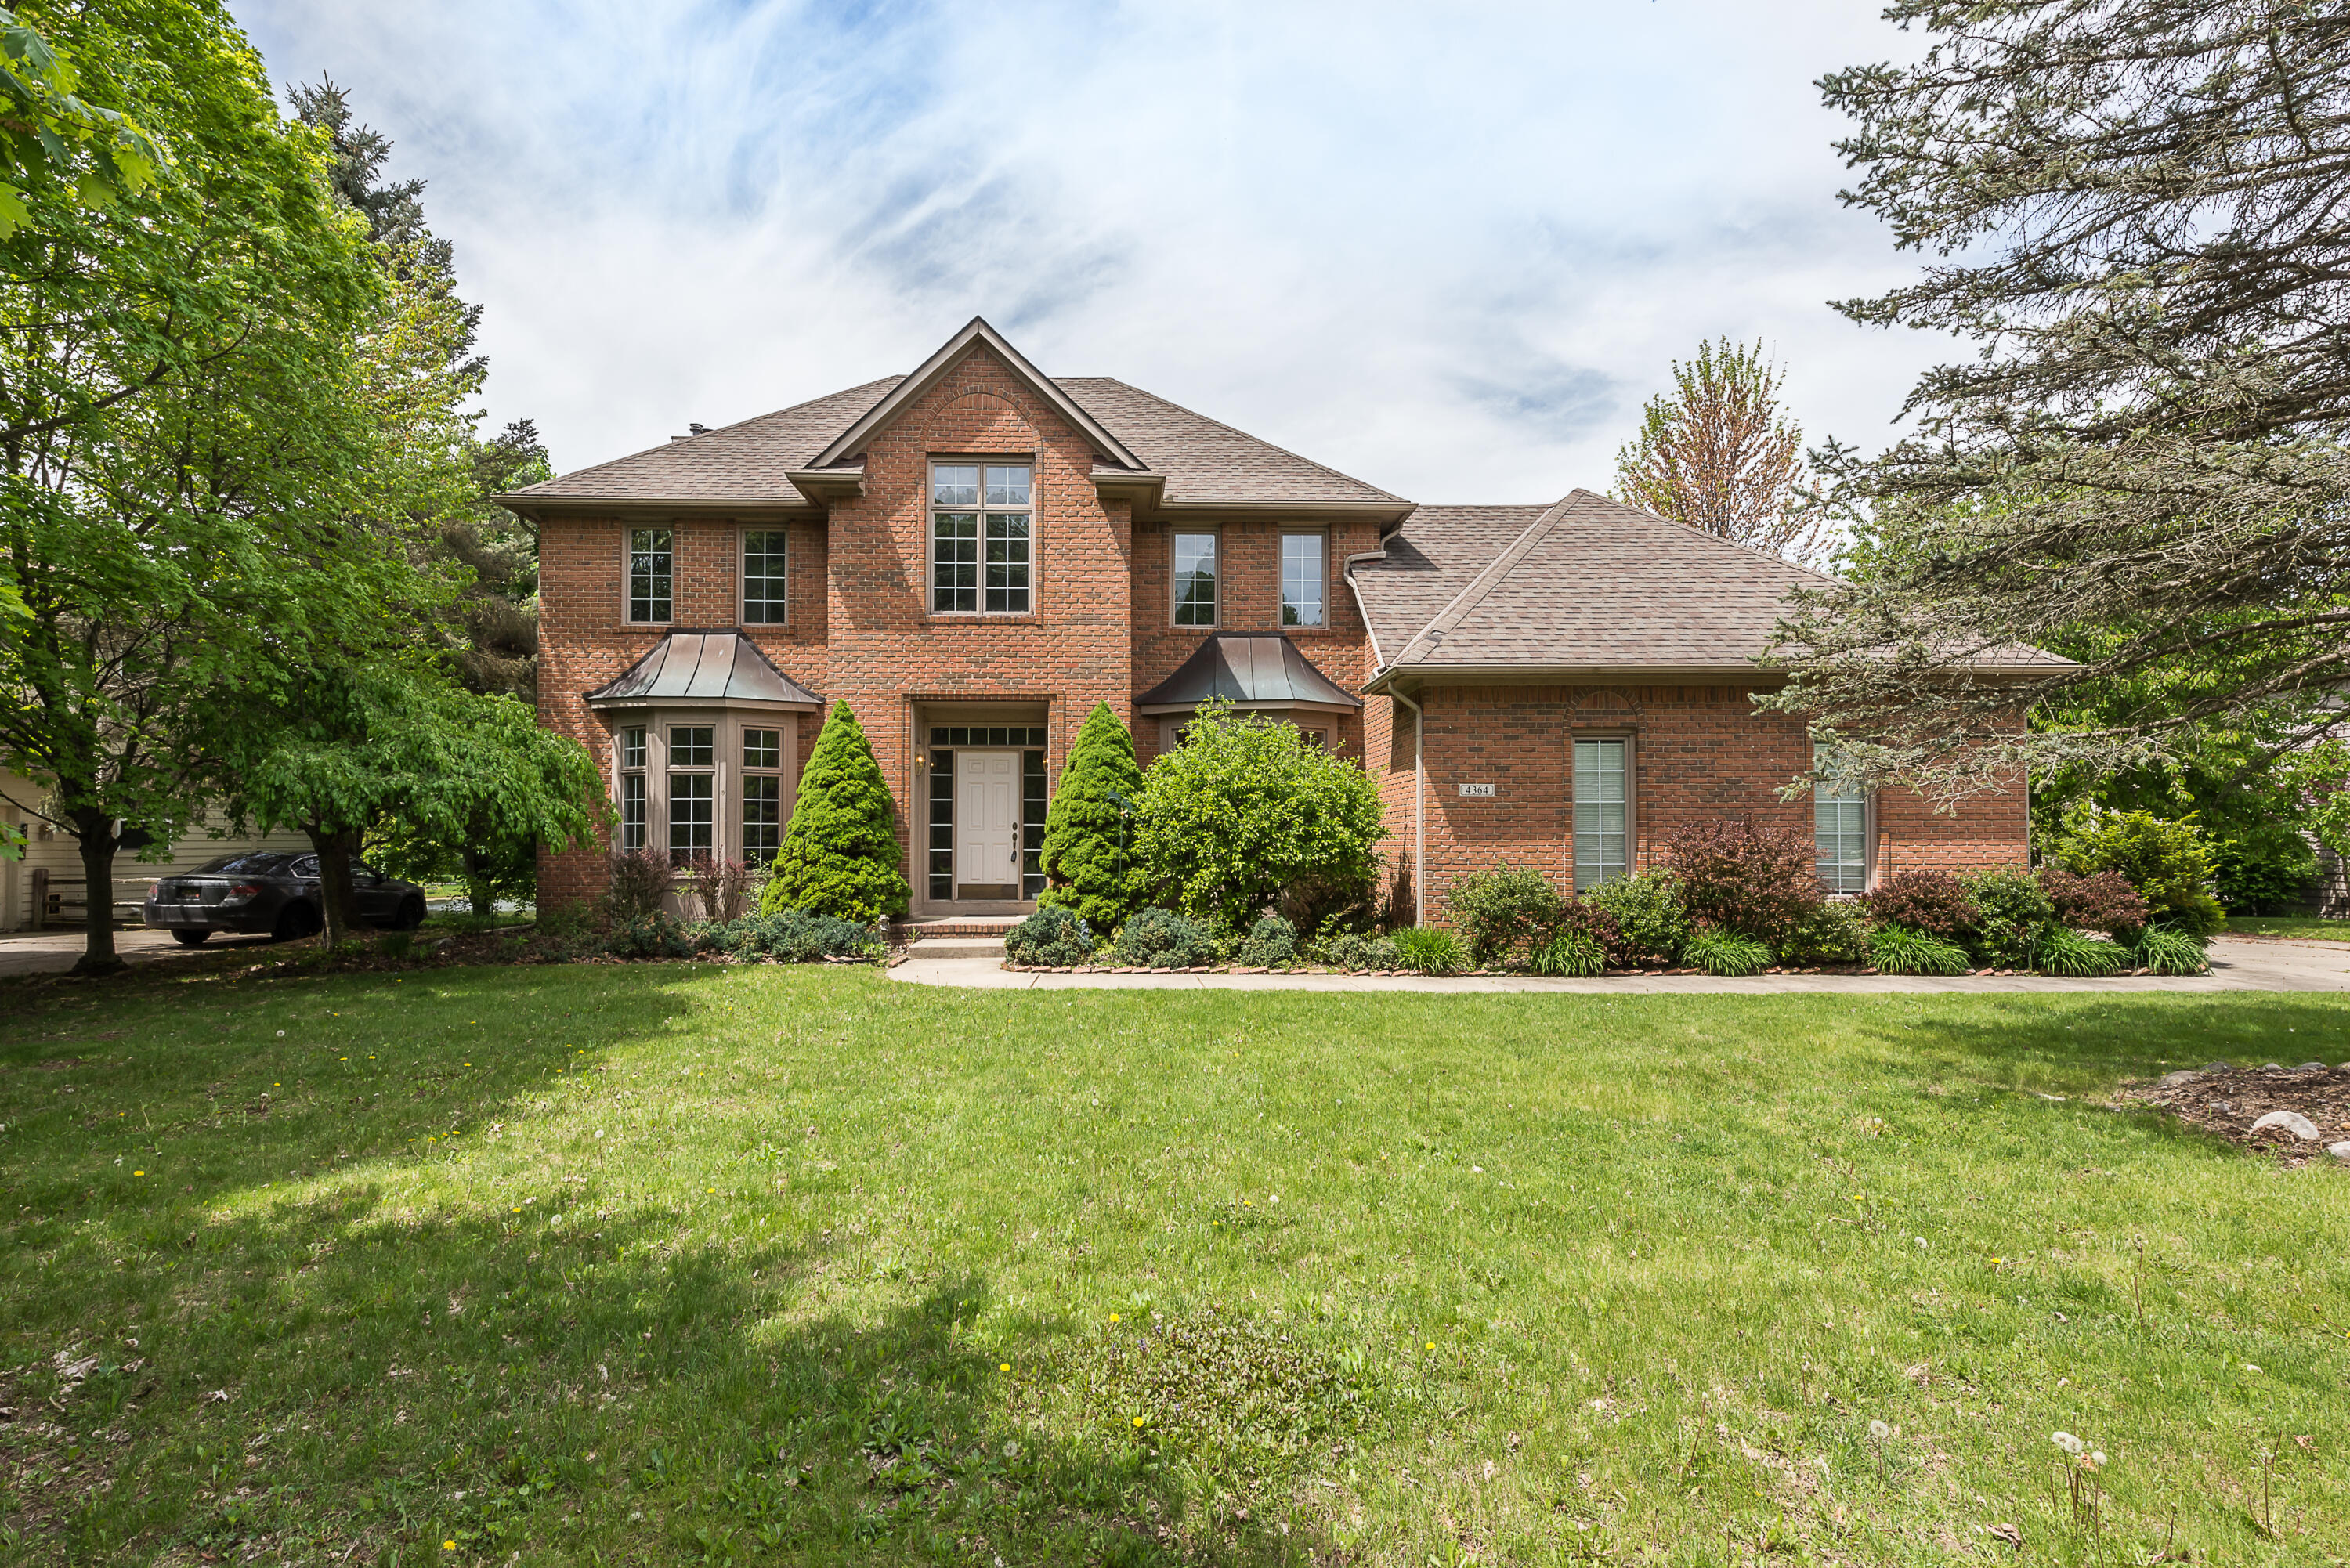
Active
$750,000
5
bds
|
4
ba
|
3,771
sqft
|
built
1994
4364 Lake Forest Dr E, Ann Arbor, MI 48108
$-2,095
Cash flow
-14.6%
Cash-on-Cash Return
2.9%
Cap rate
0.5%
Rent to Value Ratio
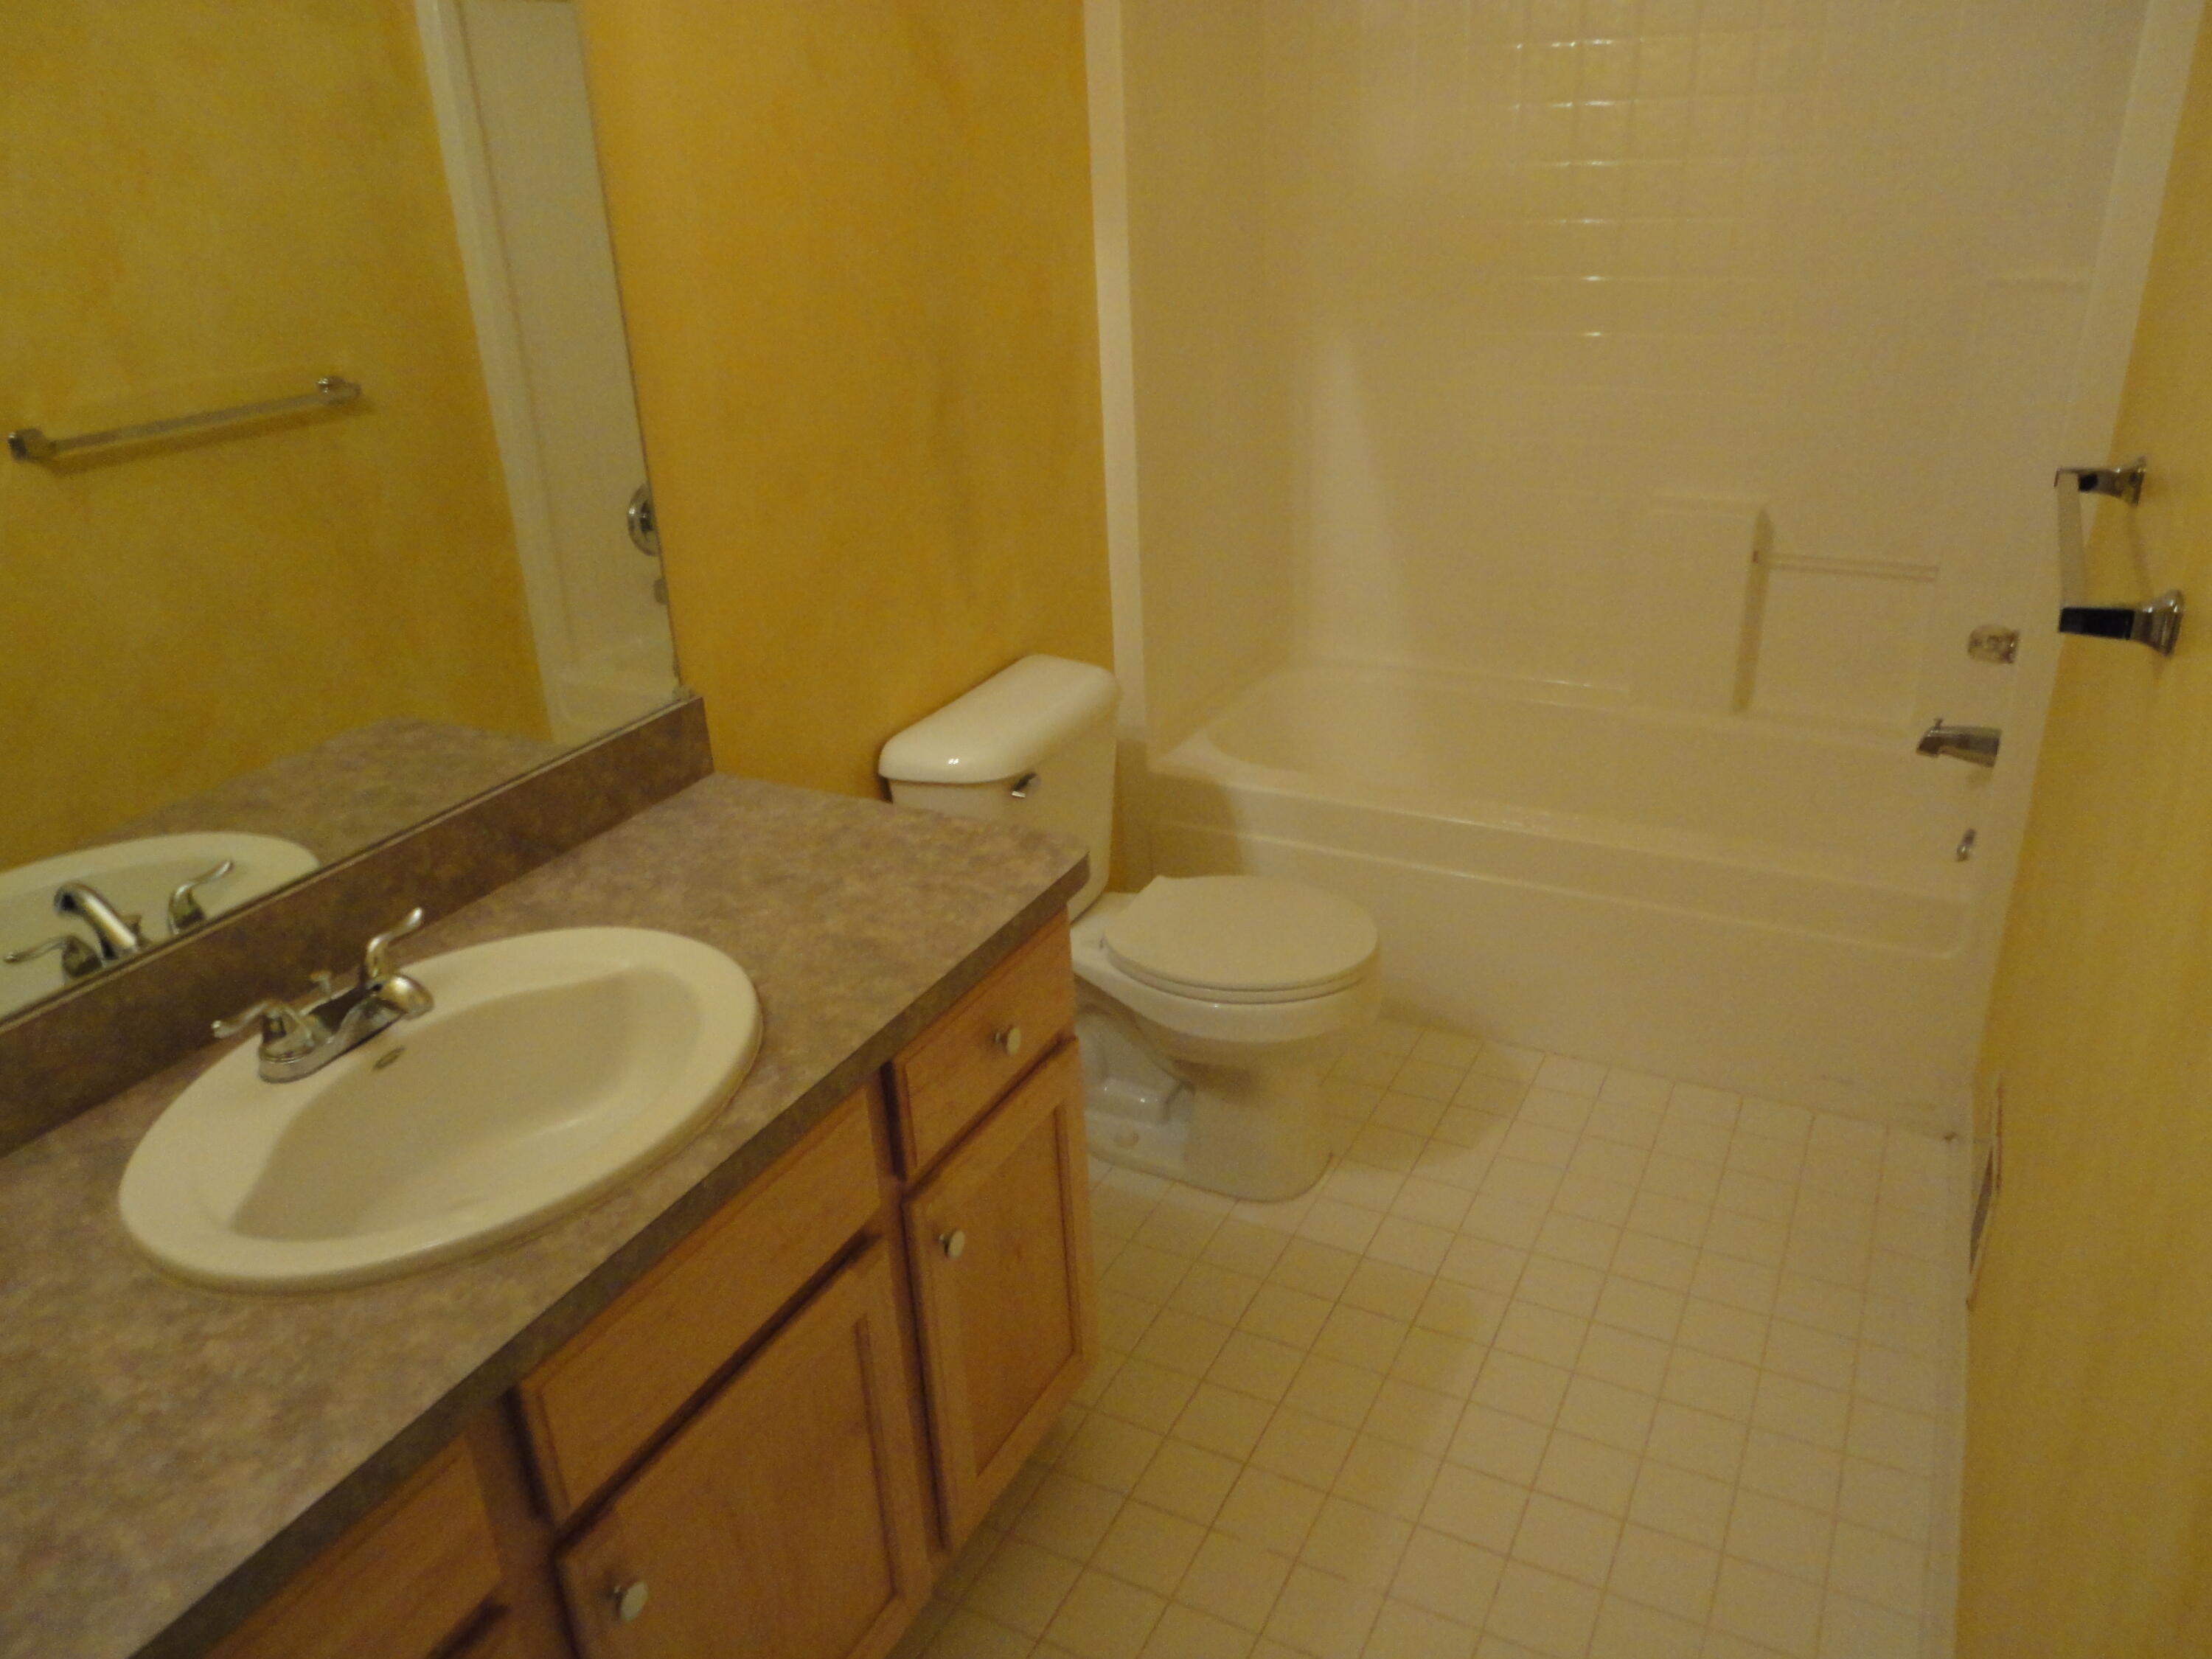
Active
$399,000
2
bds
|
3
ba
|
1,623
sqft
|
built
2000
2856 Barclay Way, Ann Arbor, MI 48105
$-1,545
Cash flow
-20.2%
Cash-on-Cash Return
1.6%
Cap rate
0.6%
Rent to Value Ratio
Active
$499,900
3
bds
|
2
ba
|
1,651
sqft
|
built
1980
2800 Kimberley Rd, Ann Arbor, MI 48104
$-1,350
Cash flow
-14.1%
Cash-on-Cash Return
3.0%
Cap rate
0.6%
Rent to Value Ratio
Active under contract
$1,320,000
6
bds
|
3
ba
|
3,083
sqft
|
built
1910
1706 S University Ave, Ann Arbor, MI 48104
$-4,943
Cash flow
-19.5%
Cash-on-Cash Return
1.8%
Cap rate
0.3%
Rent to Value Ratio
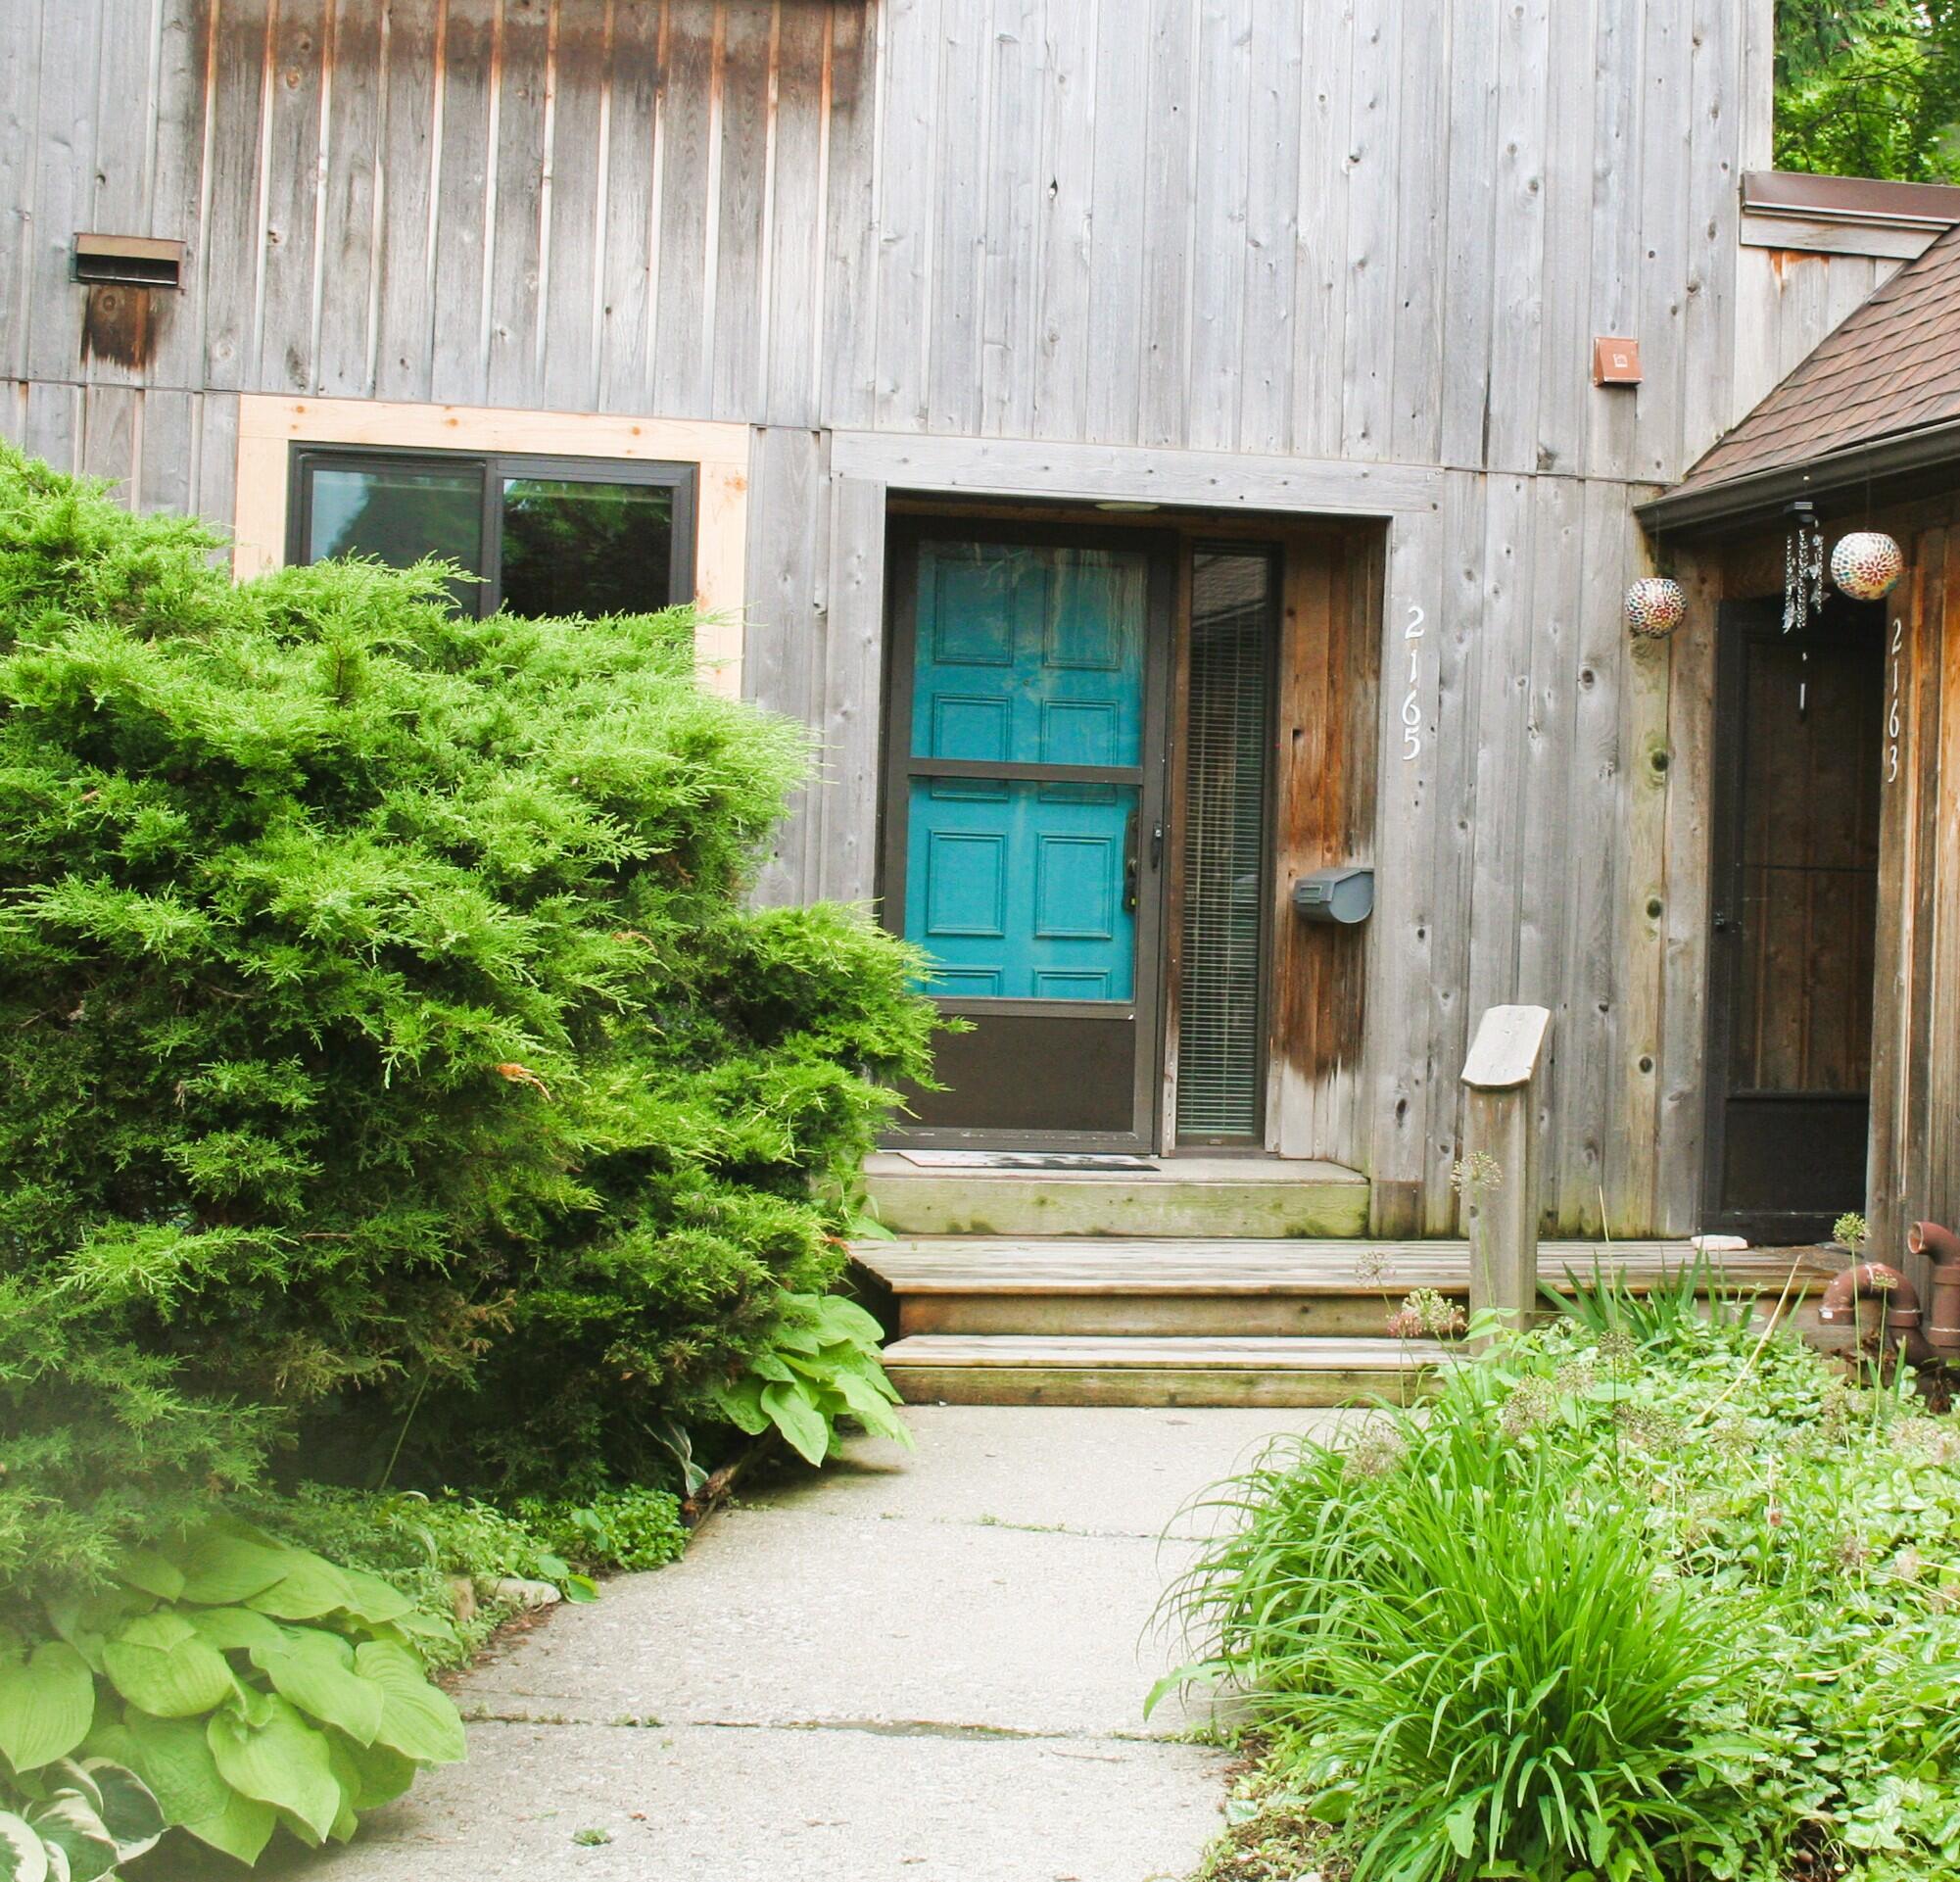
Active
$315,000
2
bds
|
2
ba
|
1,560
sqft
|
built
1975
2165 Pauline Ct, Ann Arbor, MI 48103
$-857
Cash flow
-14.2%
Cash-on-Cash Return
3.0%
Cap rate
0.7%
Rent to Value Ratio

Active
$839,999
3
bds
|
2
ba
|
1,901
sqft
|
built
1927
1512 Shadford Rd, Ann Arbor, MI 48104
$-3,466
Cash flow
-21.5%
Cash-on-Cash Return
1.3%
Cap rate
0.4%
Rent to Value Ratio
Active
$1,497,000
4
bds
|
4
ba
|
3,458
sqft
|
built
2007
4297 Upper Glade Ct, Ann Arbor, MI 48103
$-7,159
Cash flow
-25.0%
Cash-on-Cash Return
0.5%
Cap rate
0.3%
Rent to Value Ratio