Ann Arbor, MI Investment Properties for Sale
Browse homes for sale and investment properties in Ann Arbor, MI. Refine your search by price, property type, or more.
Best cash flowing properties in Ann Arbor, MI
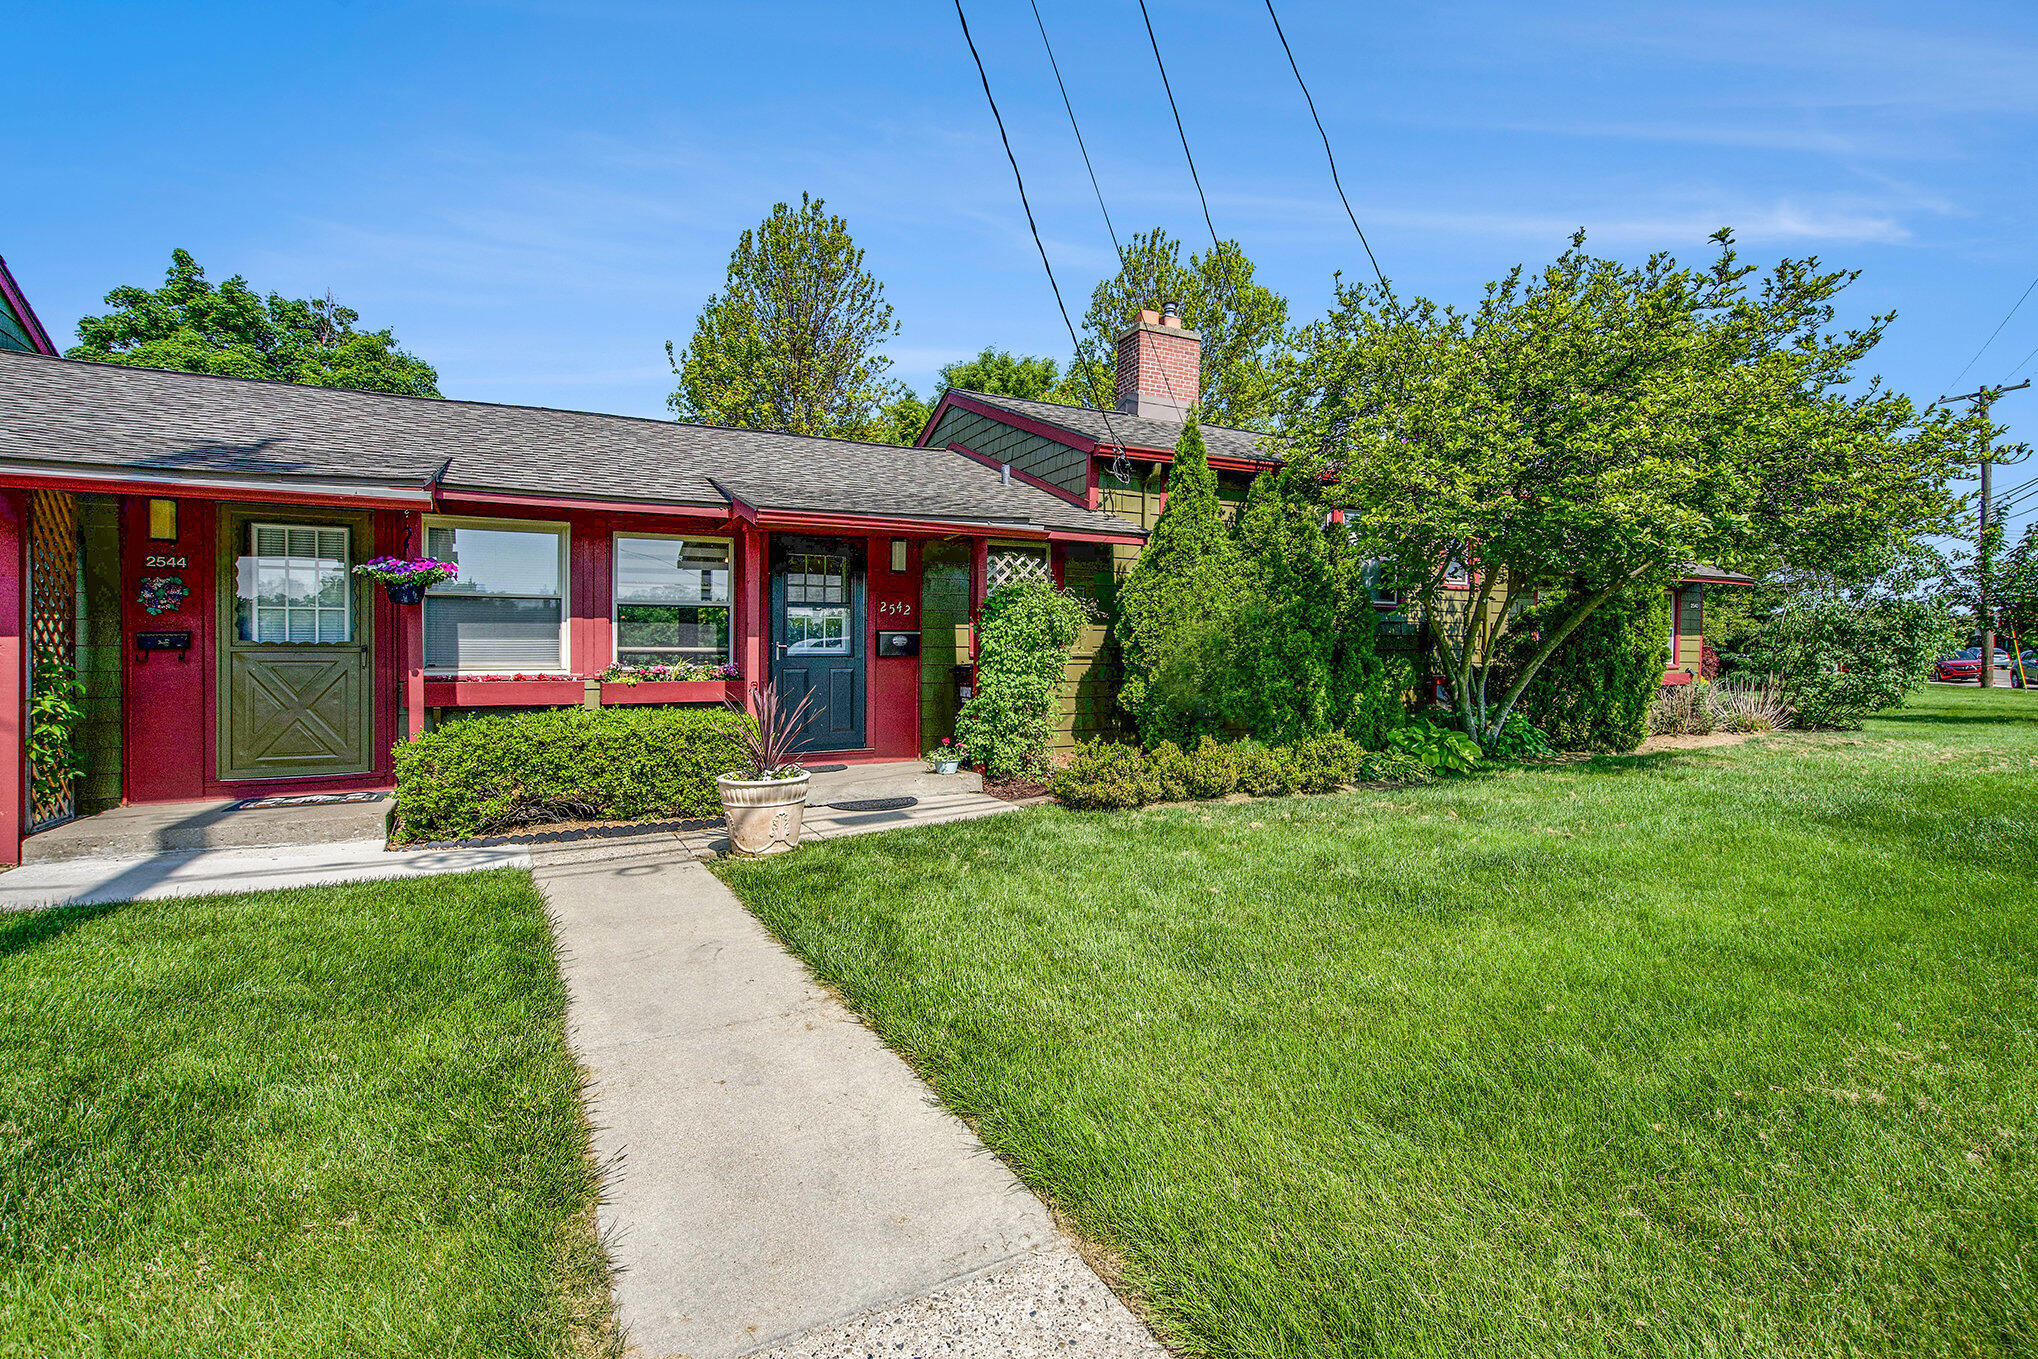
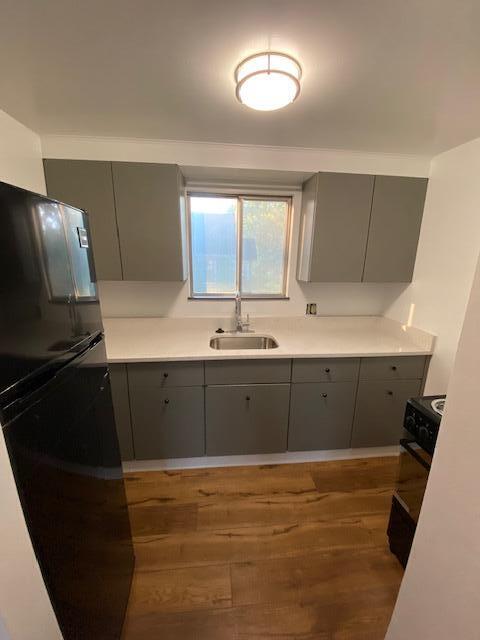
Active under contract
$185,000
1
bds
|
1
ba
|
614
sqft
|
built
1945
2542 Pittsfield Blvd, Ann Arbor, MI 48104
$-518
Cash flow
-14.6%
Cash-on-Cash Return
2.9%
Cap rate
0.9%
Rent to Value Ratio
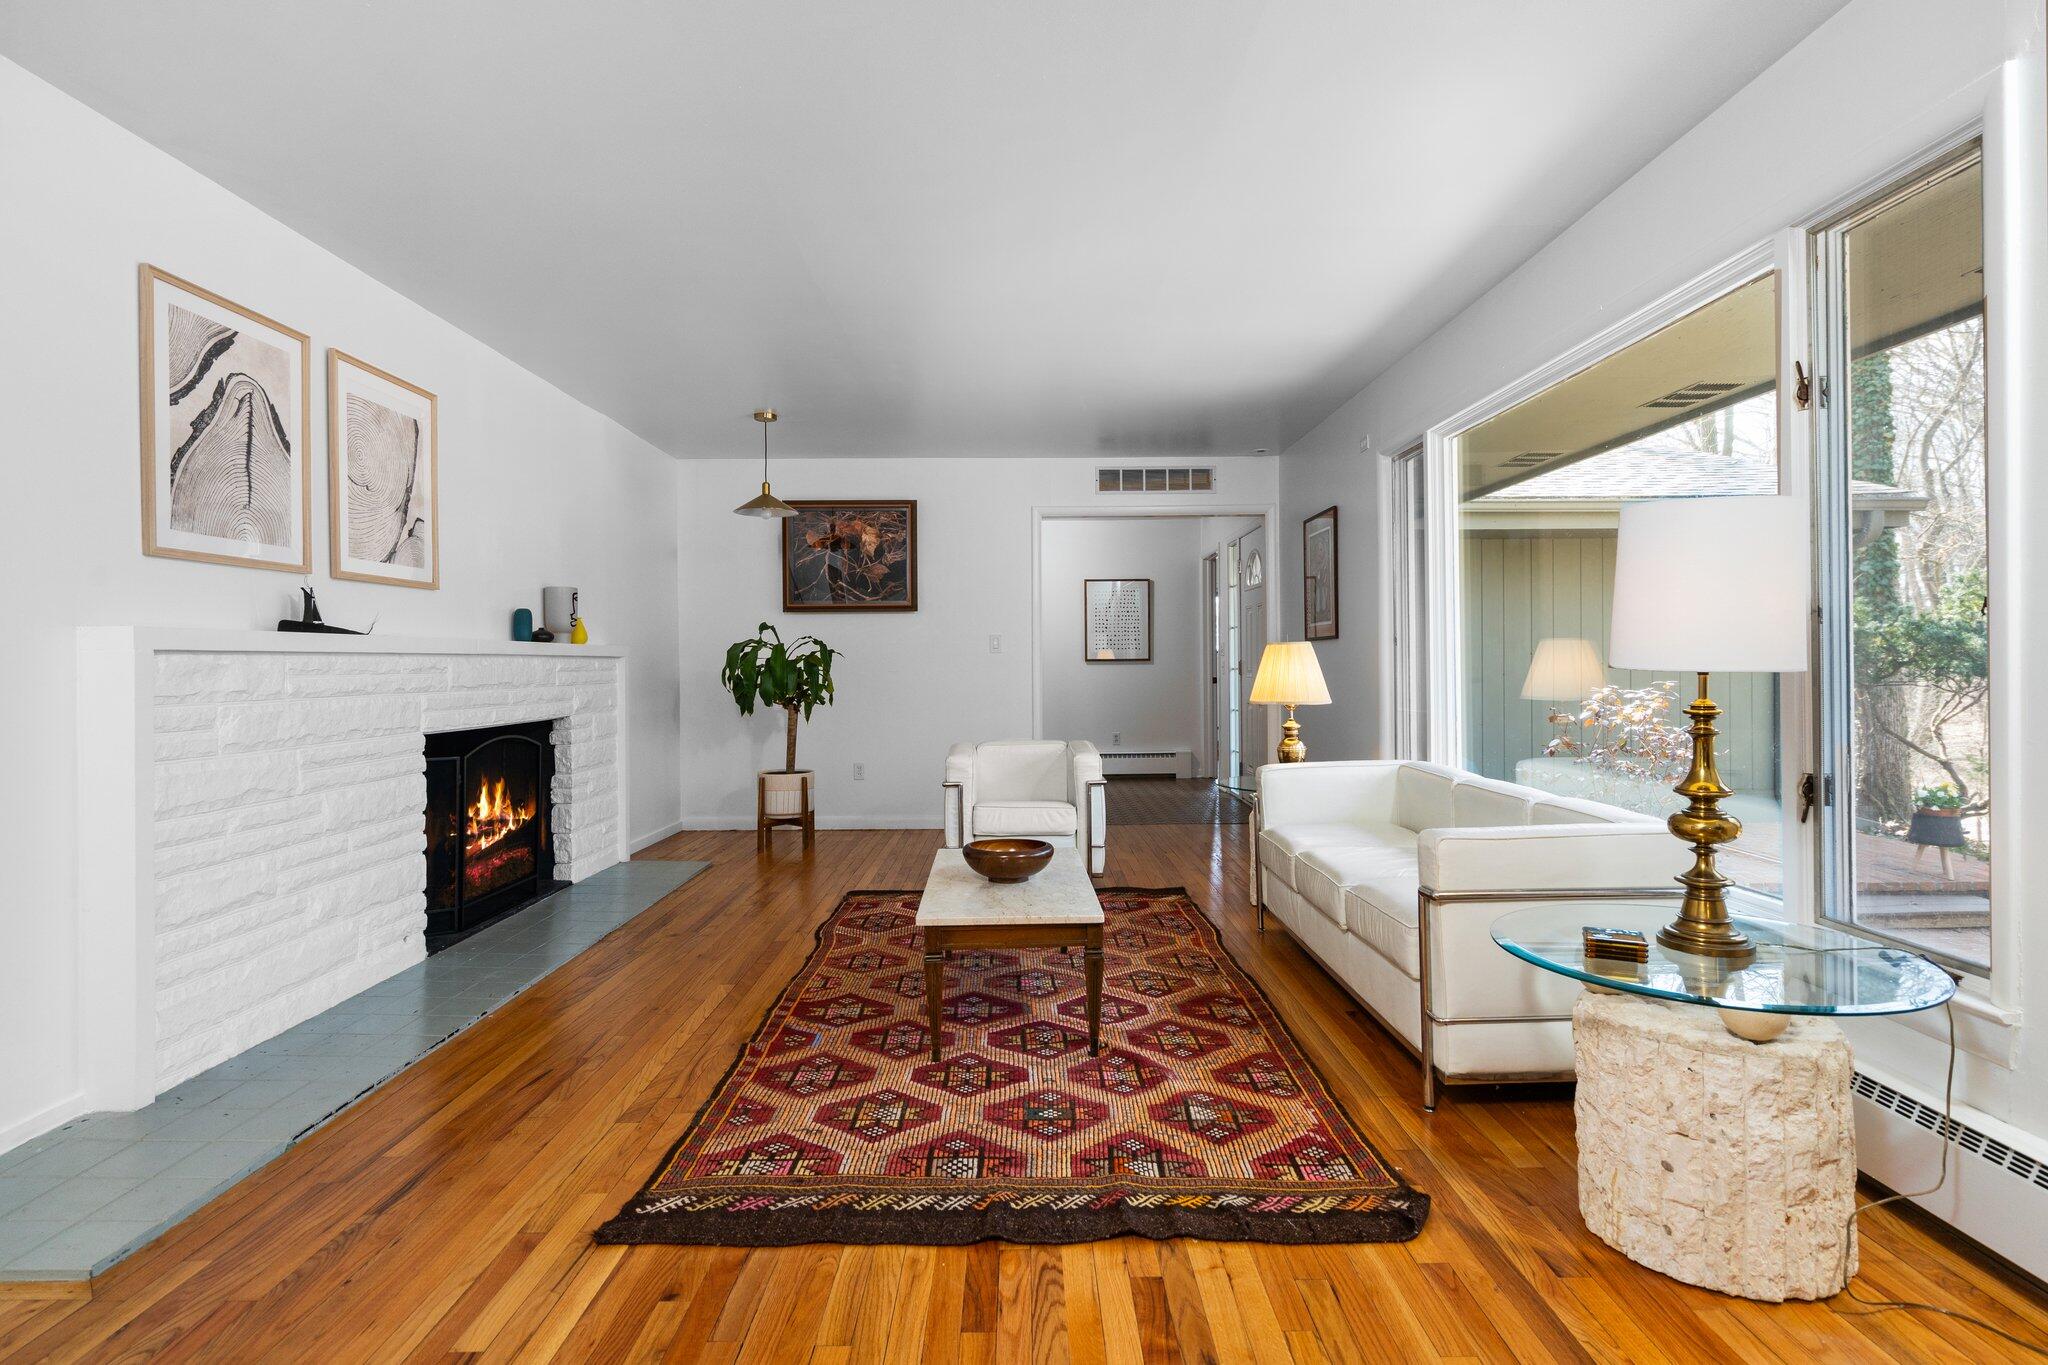
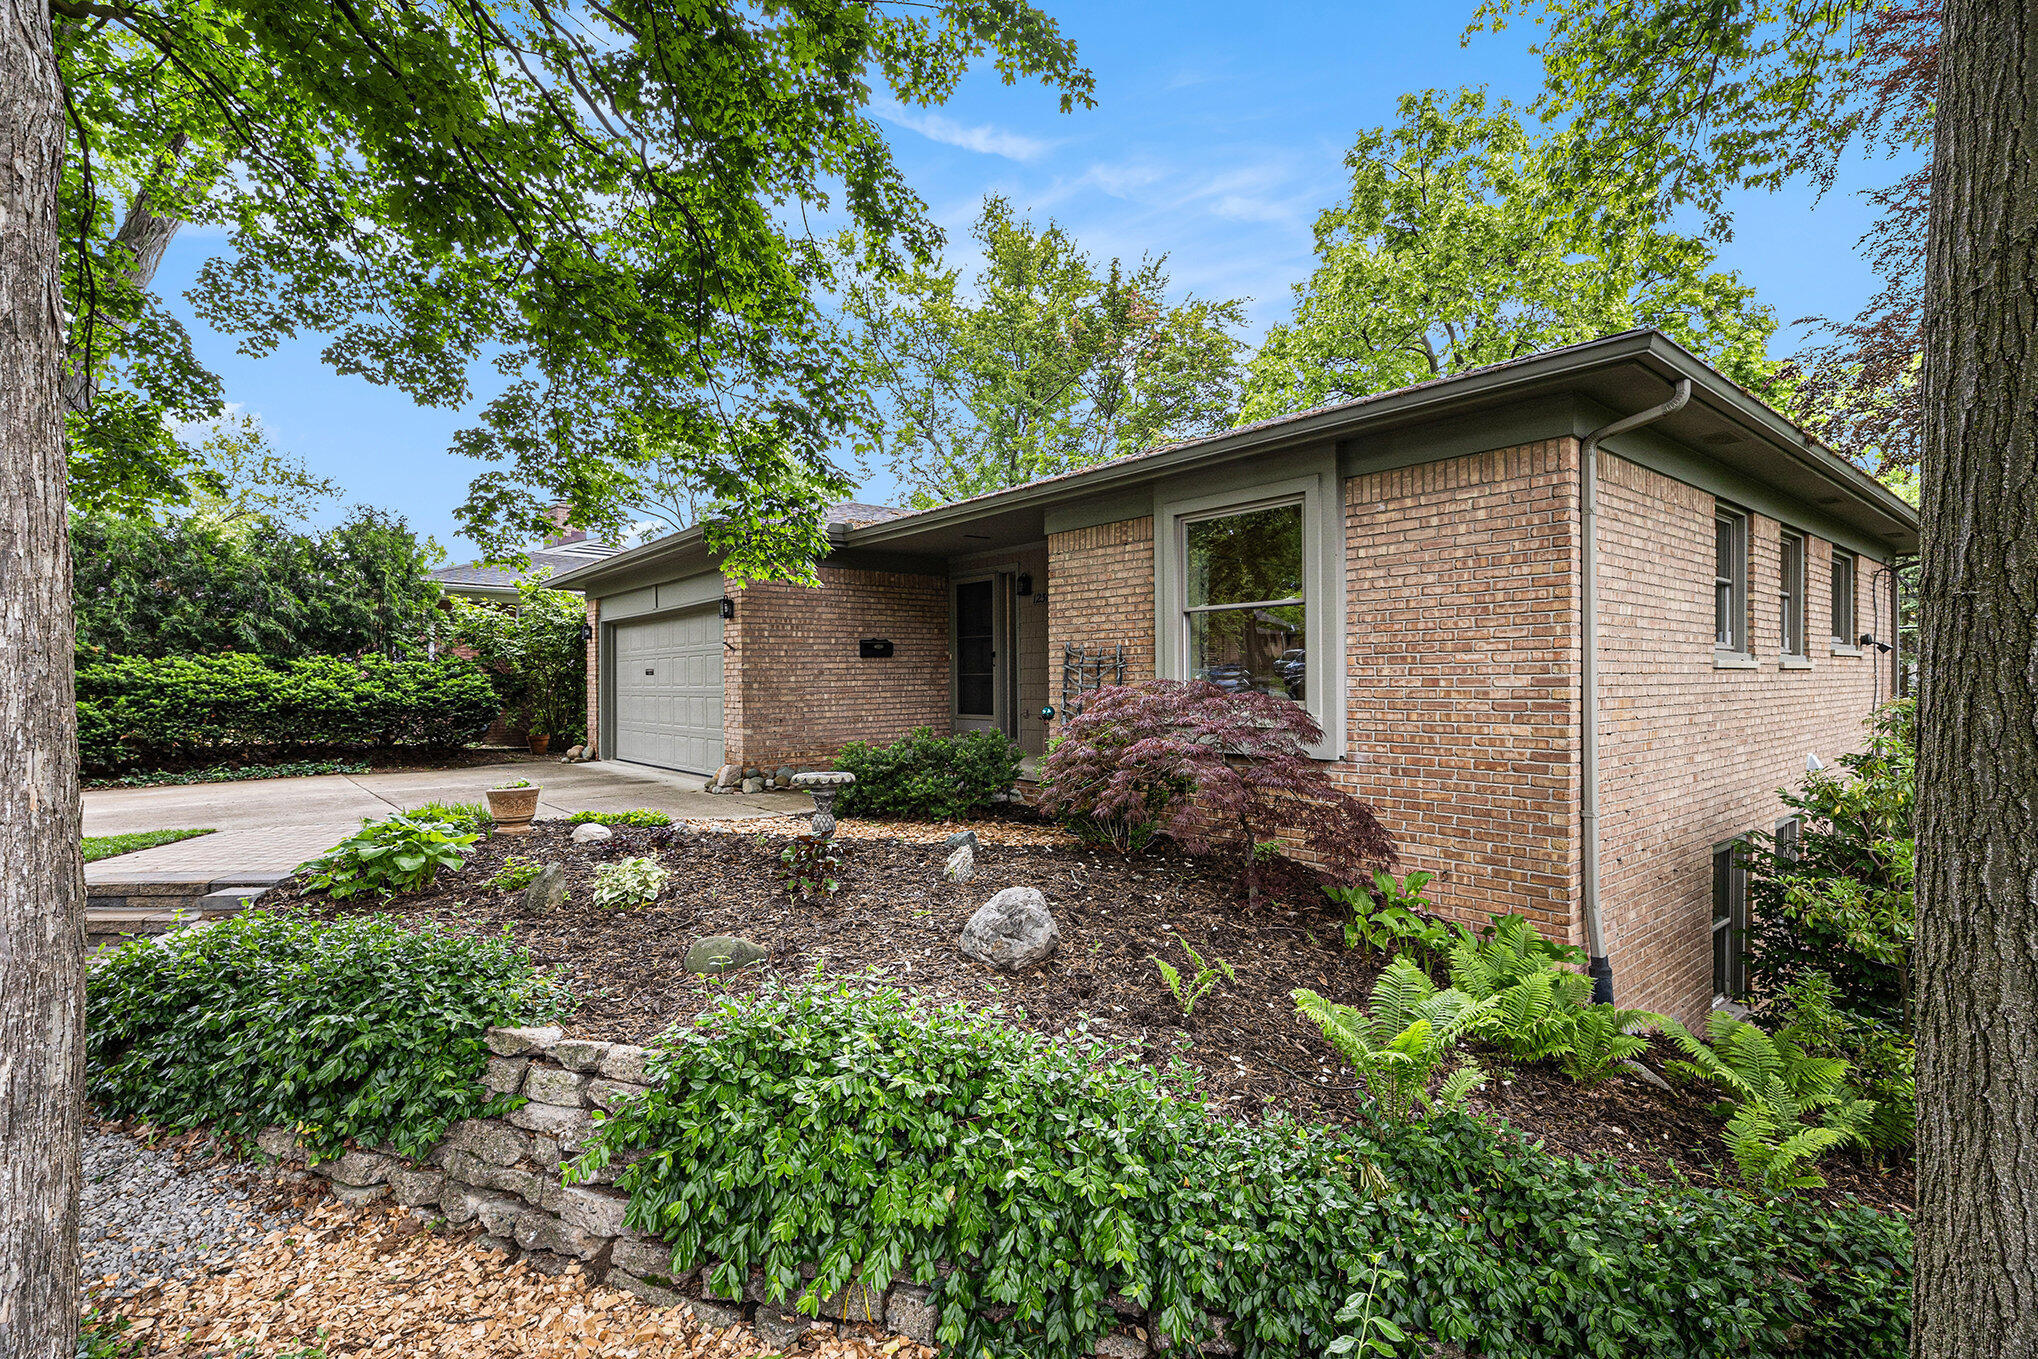
Active
$185,000
1
bds
|
1
ba
|
927
sqft
|
built
1959
2140 Pauline Blvd, Ann Arbor, MI 48103
$-646
Cash flow
-18.2%
Cash-on-Cash Return
2.1%
Cap rate
0.9%
Rent to Value Ratio
171 out of 188 properties for sale in Ann Arbor, MI
Limited Results Shown
Create a free account, or log in to reveal all property listings and enjoy the complete experience.

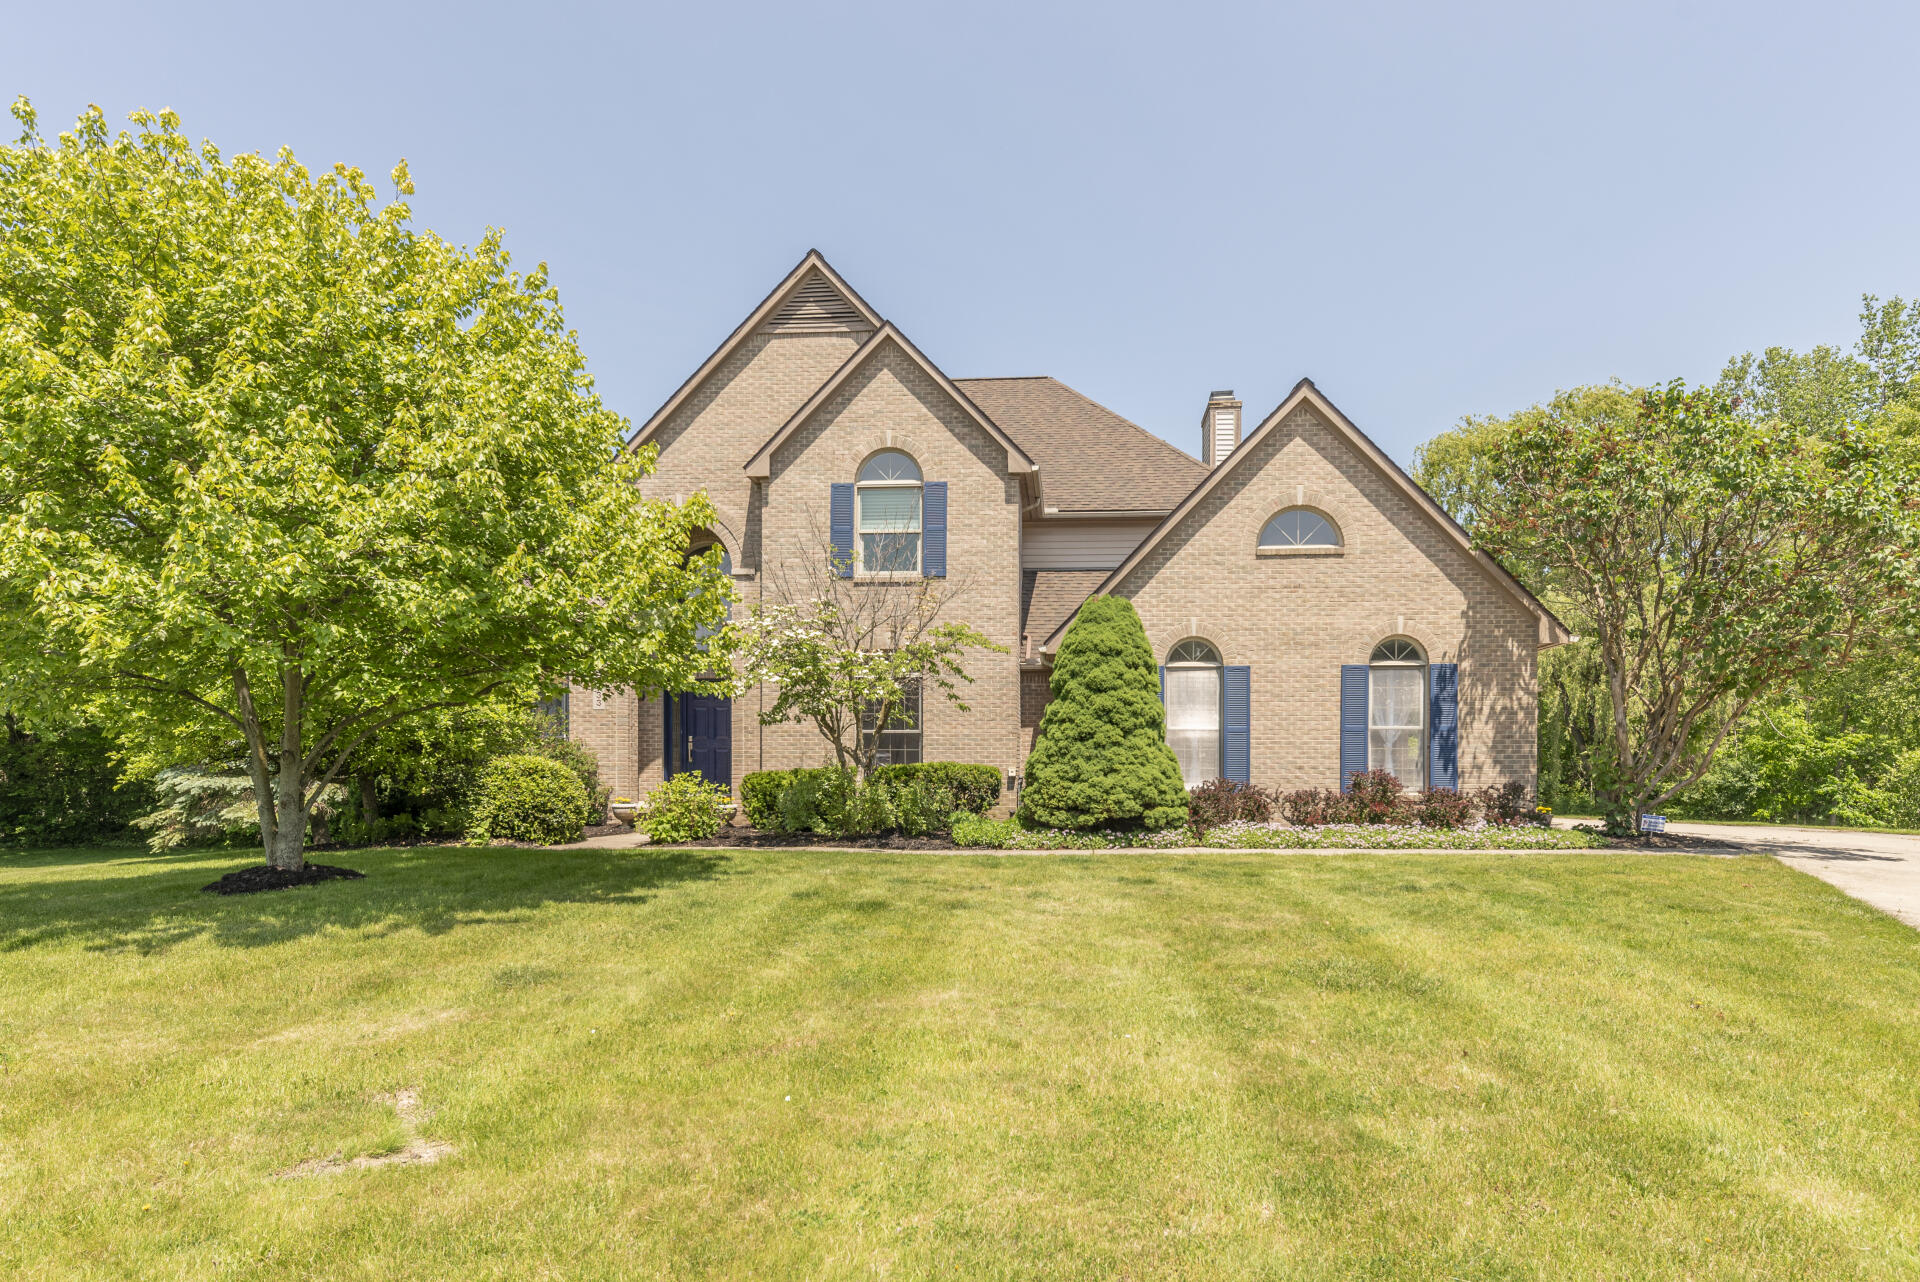
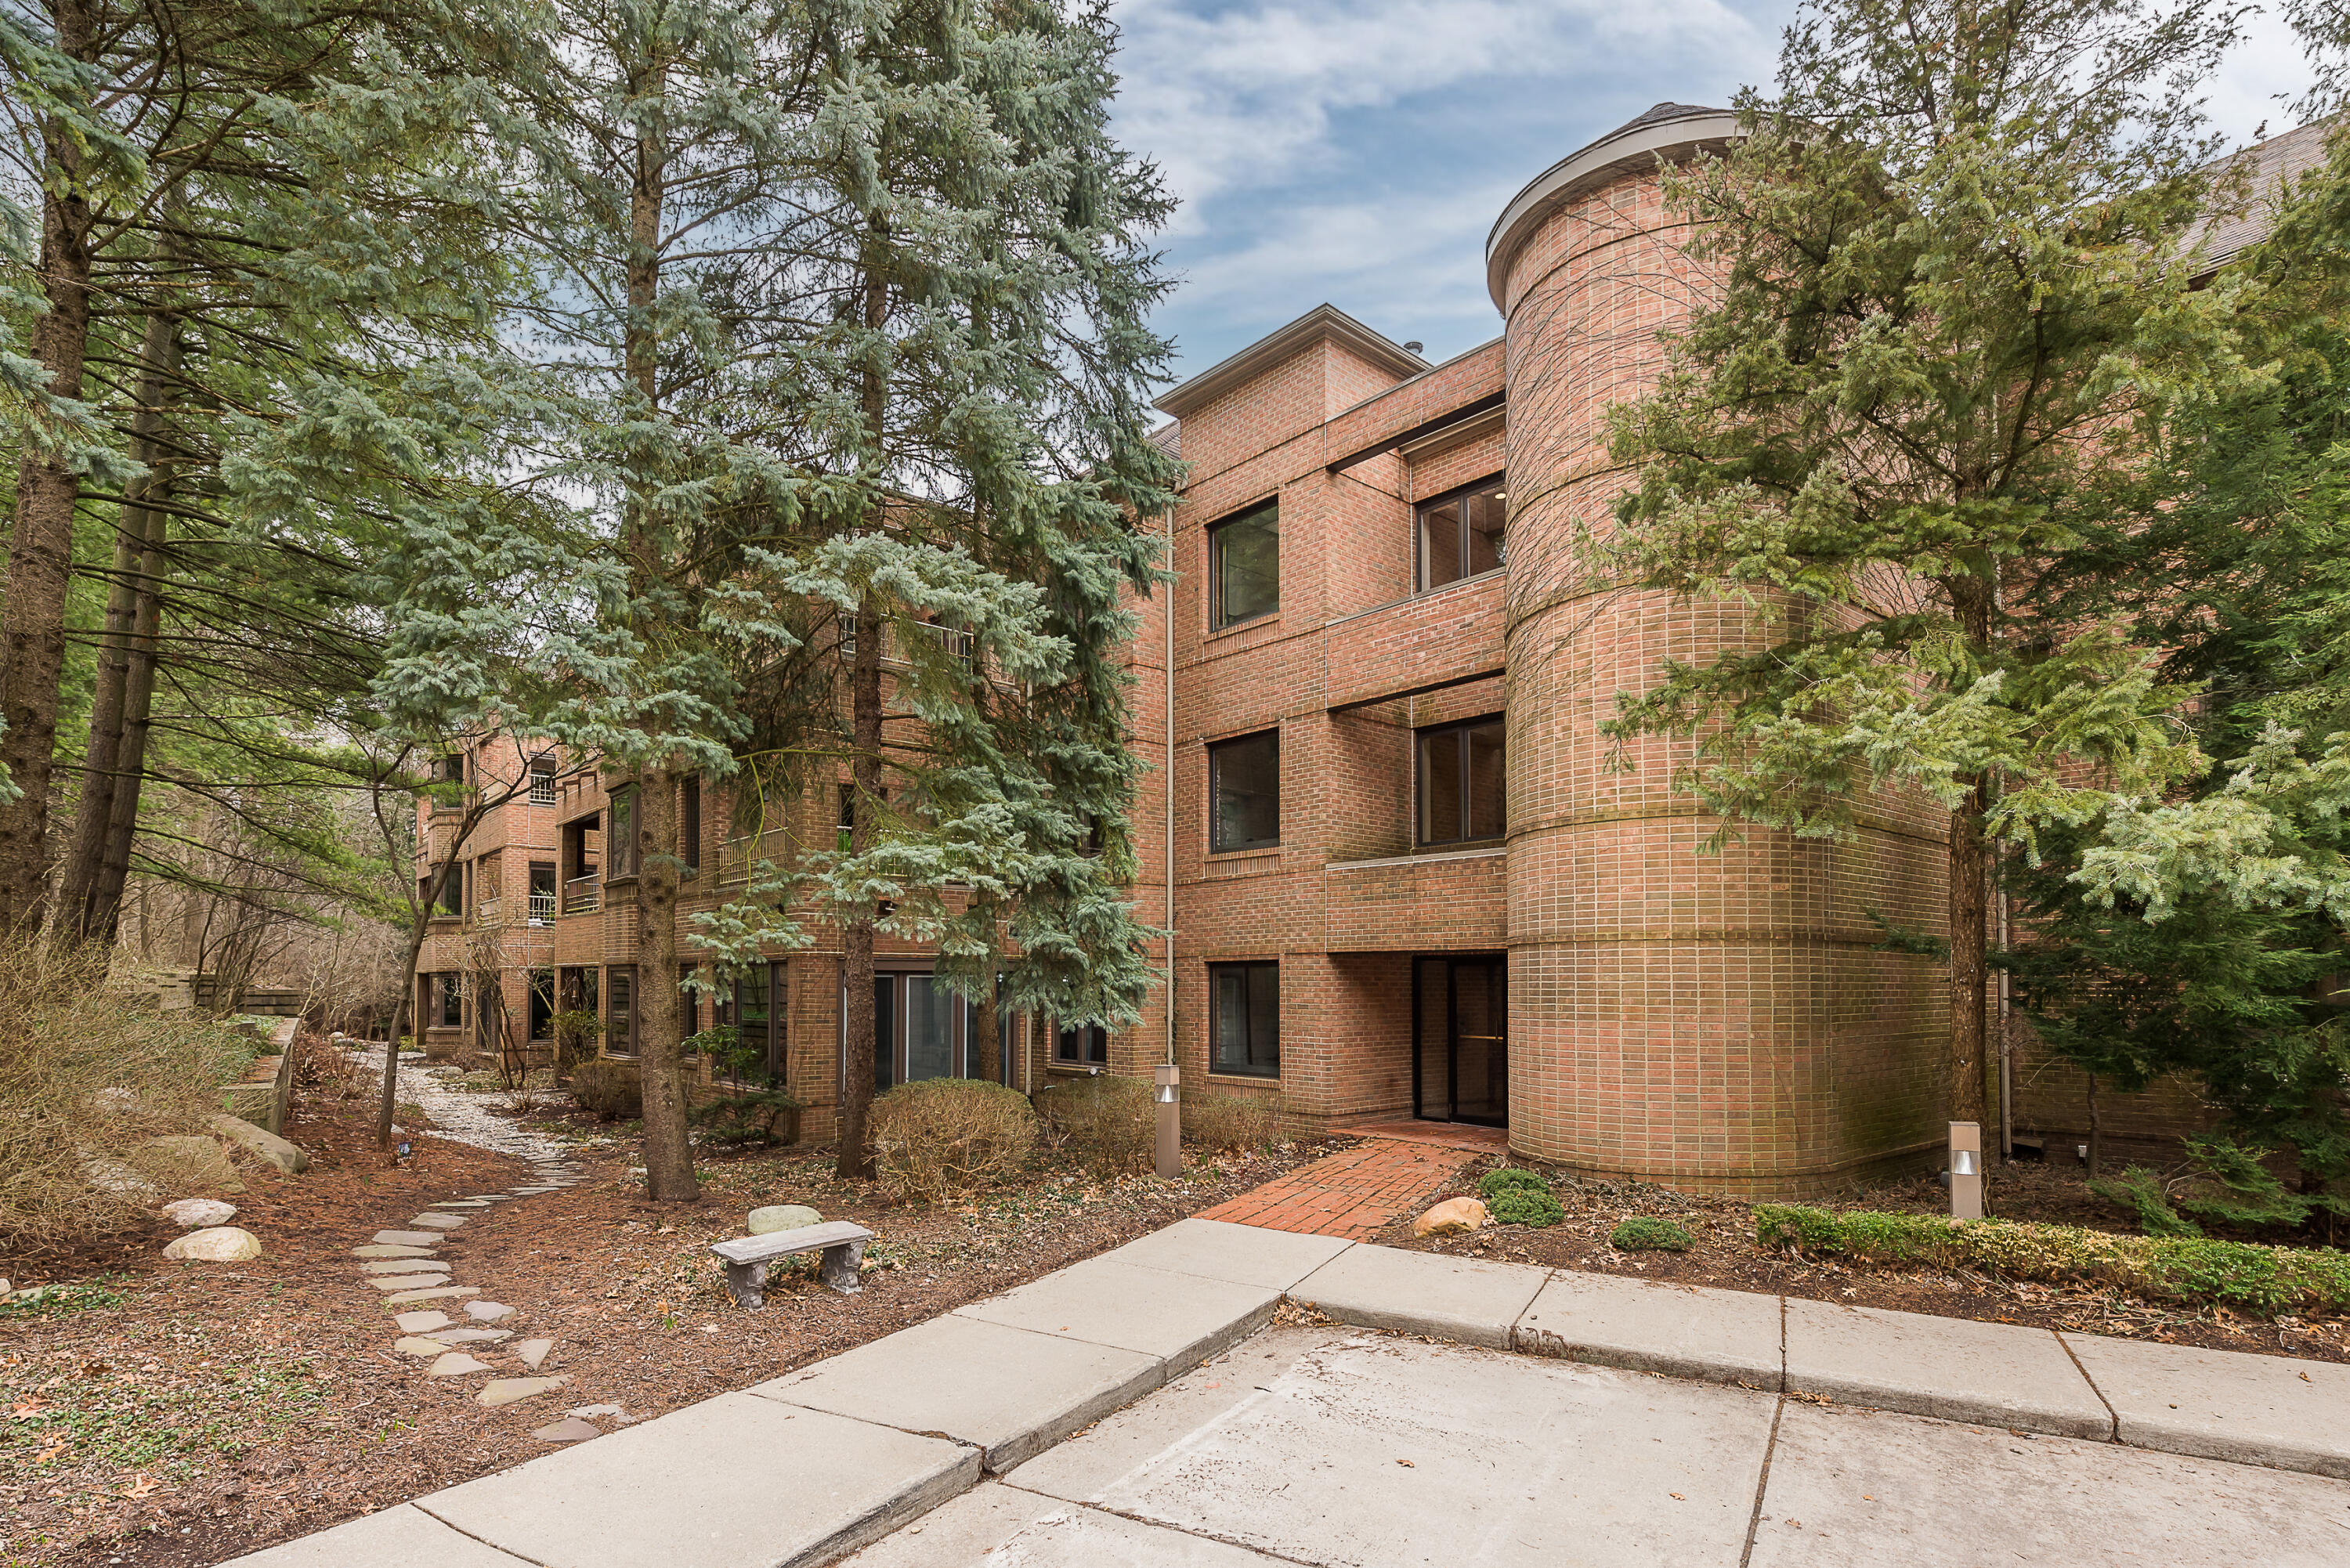
Active
$569,000
3
bds
|
4
ba
|
2,681
sqft
|
built
2019
2765 Polson St, Ann Arbor, MI 48105
$-1,741
Cash flow
-16.0%
Cash-on-Cash Return
2.6%
Cap rate
0.6%
Rent to Value Ratio

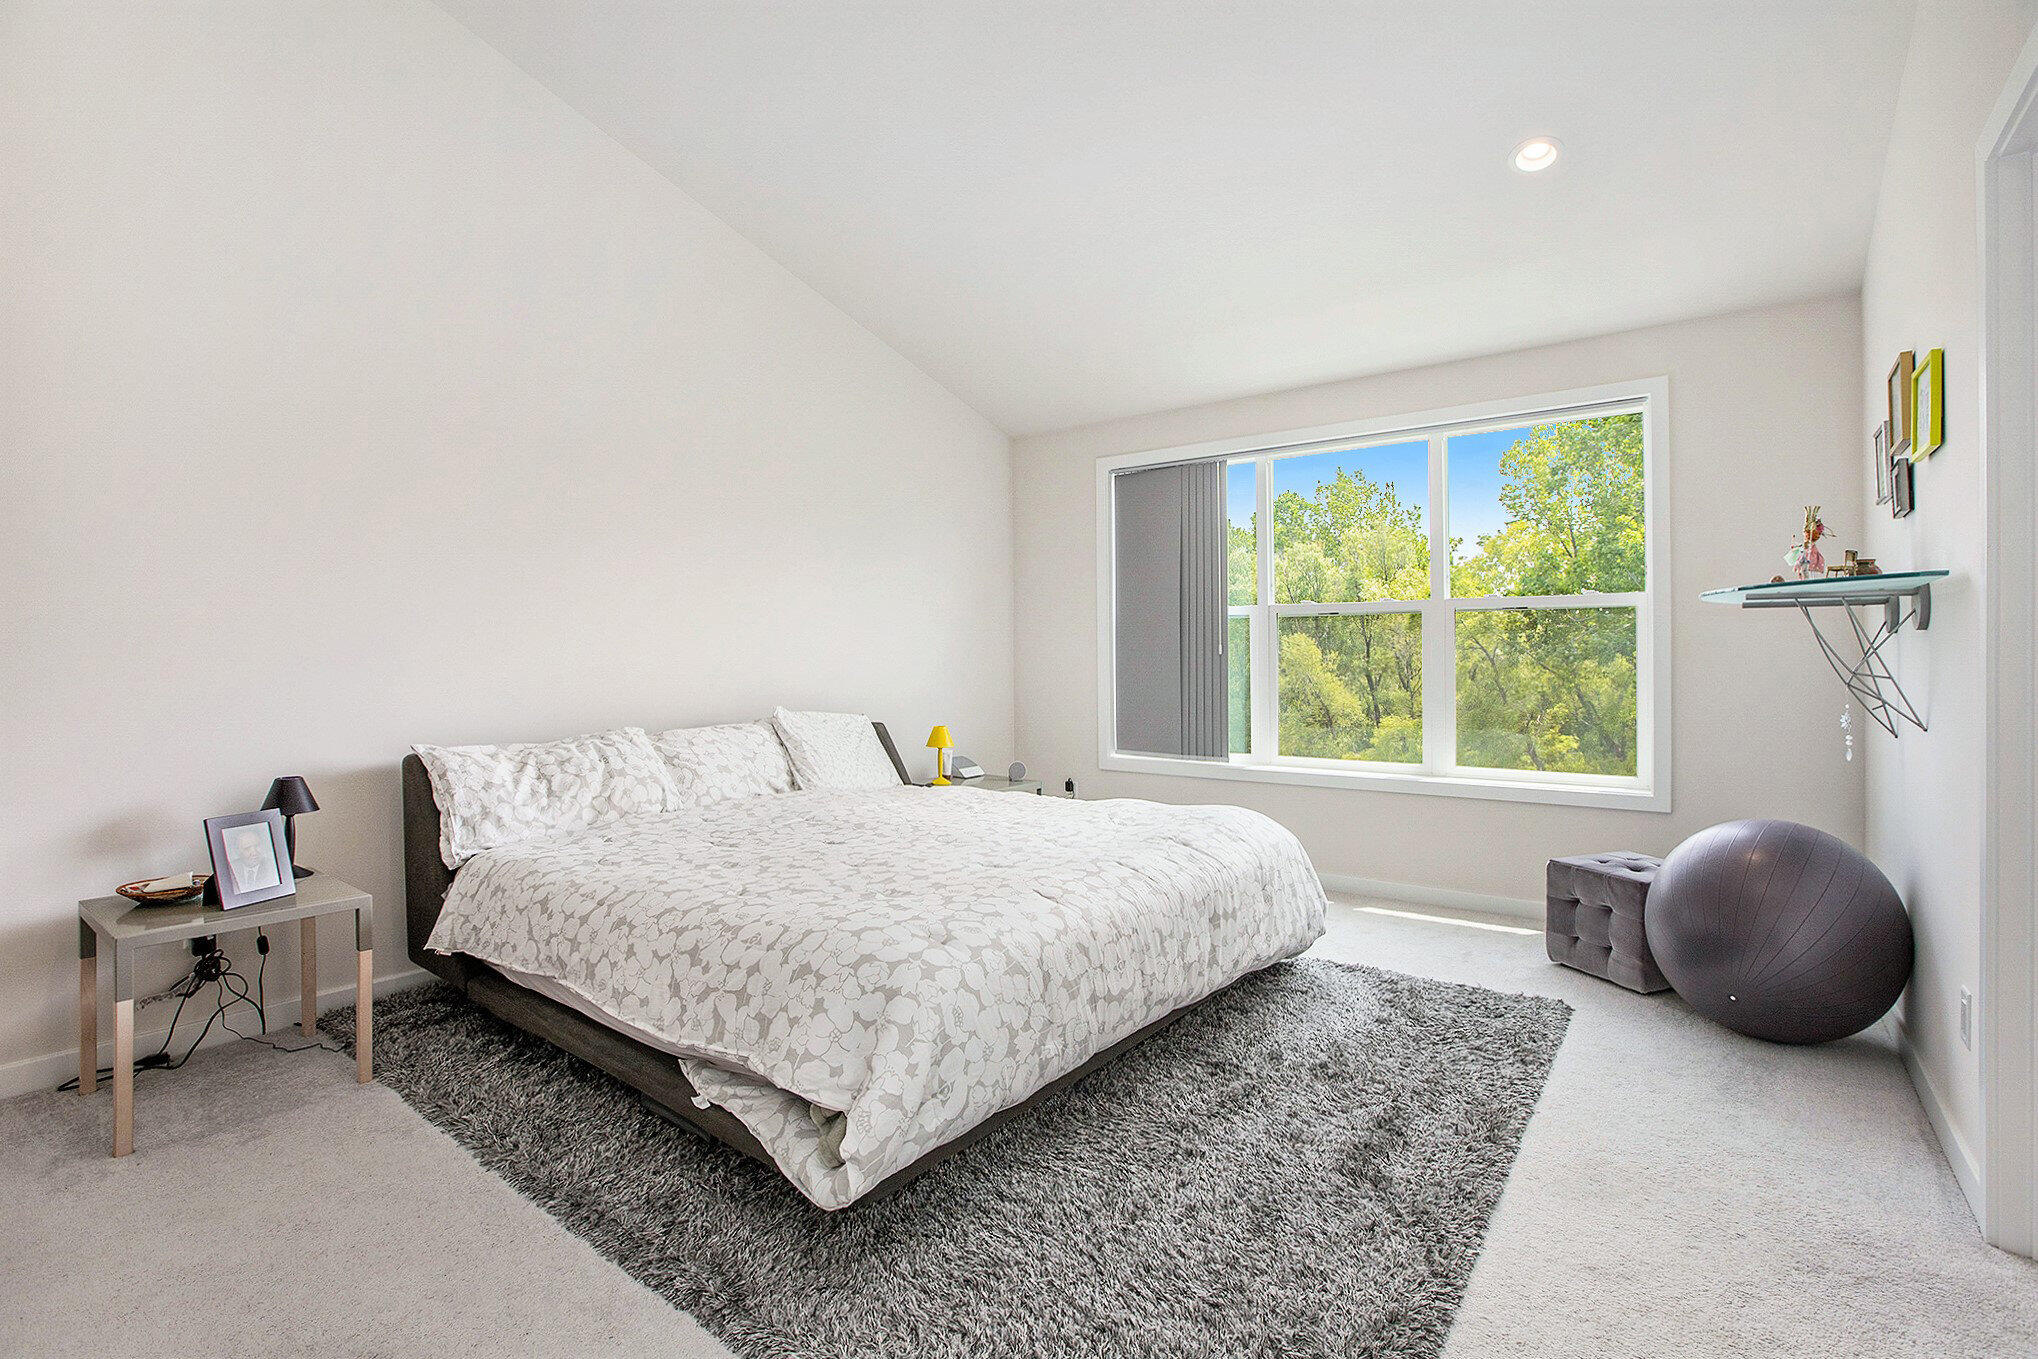
Active
$499,900
3
bds
|
2
ba
|
1,901
sqft
|
built
1975
2149 Fair St, Ann Arbor, MI 48103
$-1,326
Cash flow
-13.8%
Cash-on-Cash Return
3.1%
Cap rate
0.6%
Rent to Value Ratio
Active
$697,500
5
bds
|
4
ba
|
4,459
sqft
|
built
1995
5433 Waterfield Ct, Ann Arbor, MI 48108
$-2,009
Cash flow
-15.0%
Cash-on-Cash Return
2.8%
Cap rate
0.6%
Rent to Value Ratio

Active
$244,900
2
bds
|
2
ba
|
952
sqft
|
built
1977
2705 Winthrop Ct, Ann Arbor, MI 48104
$-651
Cash flow
-13.9%
Cash-on-Cash Return
3.1%
Cap rate
0.7%
Rent to Value Ratio

Active
$1,465,000
6
bds
|
5
ba
|
5,726
sqft
|
built
1990
3427 E Dobson Pl, Ann Arbor, MI 48105
$-6,701
Cash flow
-23.9%
Cash-on-Cash Return
0.8%
Cap rate
0.3%
Rent to Value Ratio
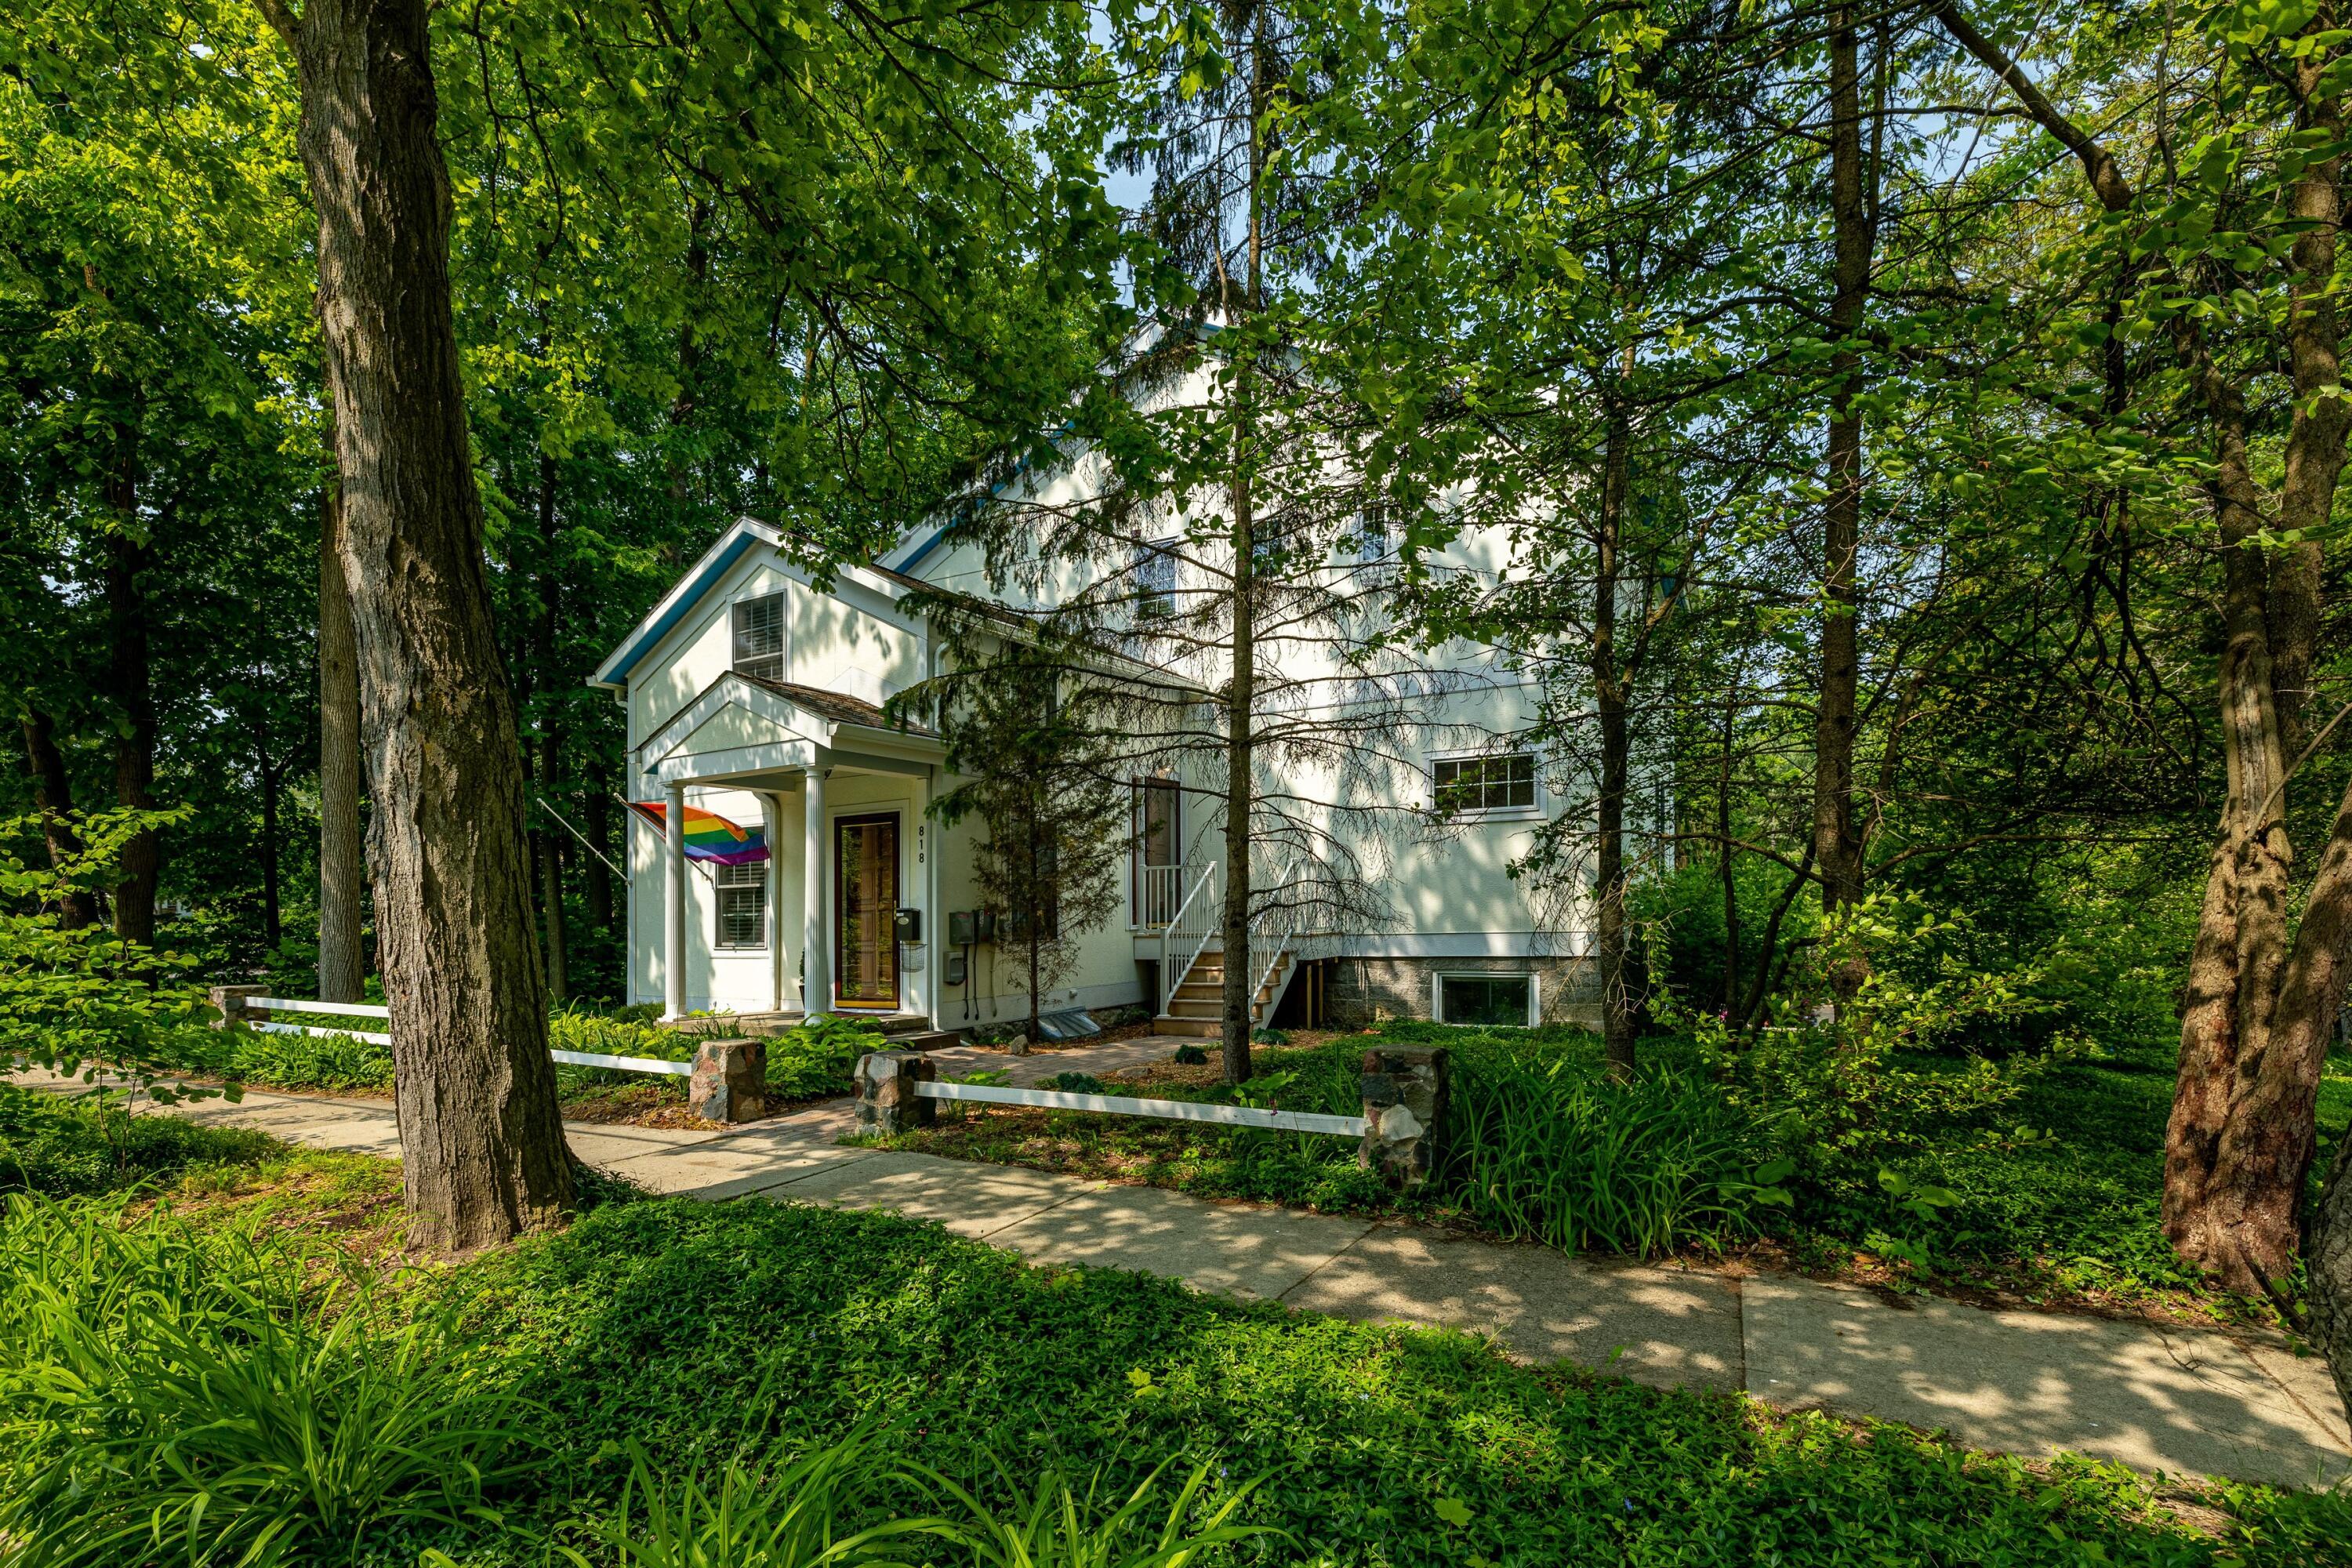
Active
$1,195,000
5
bds
|
5
ba
|
4,027
sqft
|
built
1901
818 S 7th St, Ann Arbor, MI 48103
$-4,453
Cash flow
-19.4%
Cash-on-Cash Return
1.8%
Cap rate
0.3%
Rent to Value Ratio
Active
$575,000
5
bds
|
3
ba
|
2,288
sqft
|
built
1950
407 Pauline Blvd, Ann Arbor, MI 48103
$-1,418
Cash flow
-12.9%
Cash-on-Cash Return
3.3%
Cap rate
0.7%
Rent to Value Ratio
Active
$185,000
1
bds
|
1
ba
|
927
sqft
|
built
1959
2140 Pauline Blvd, Ann Arbor, MI 48103
$-646
Cash flow
-18.2%
Cash-on-Cash Return
2.1%
Cap rate
0.9%
Rent to Value Ratio
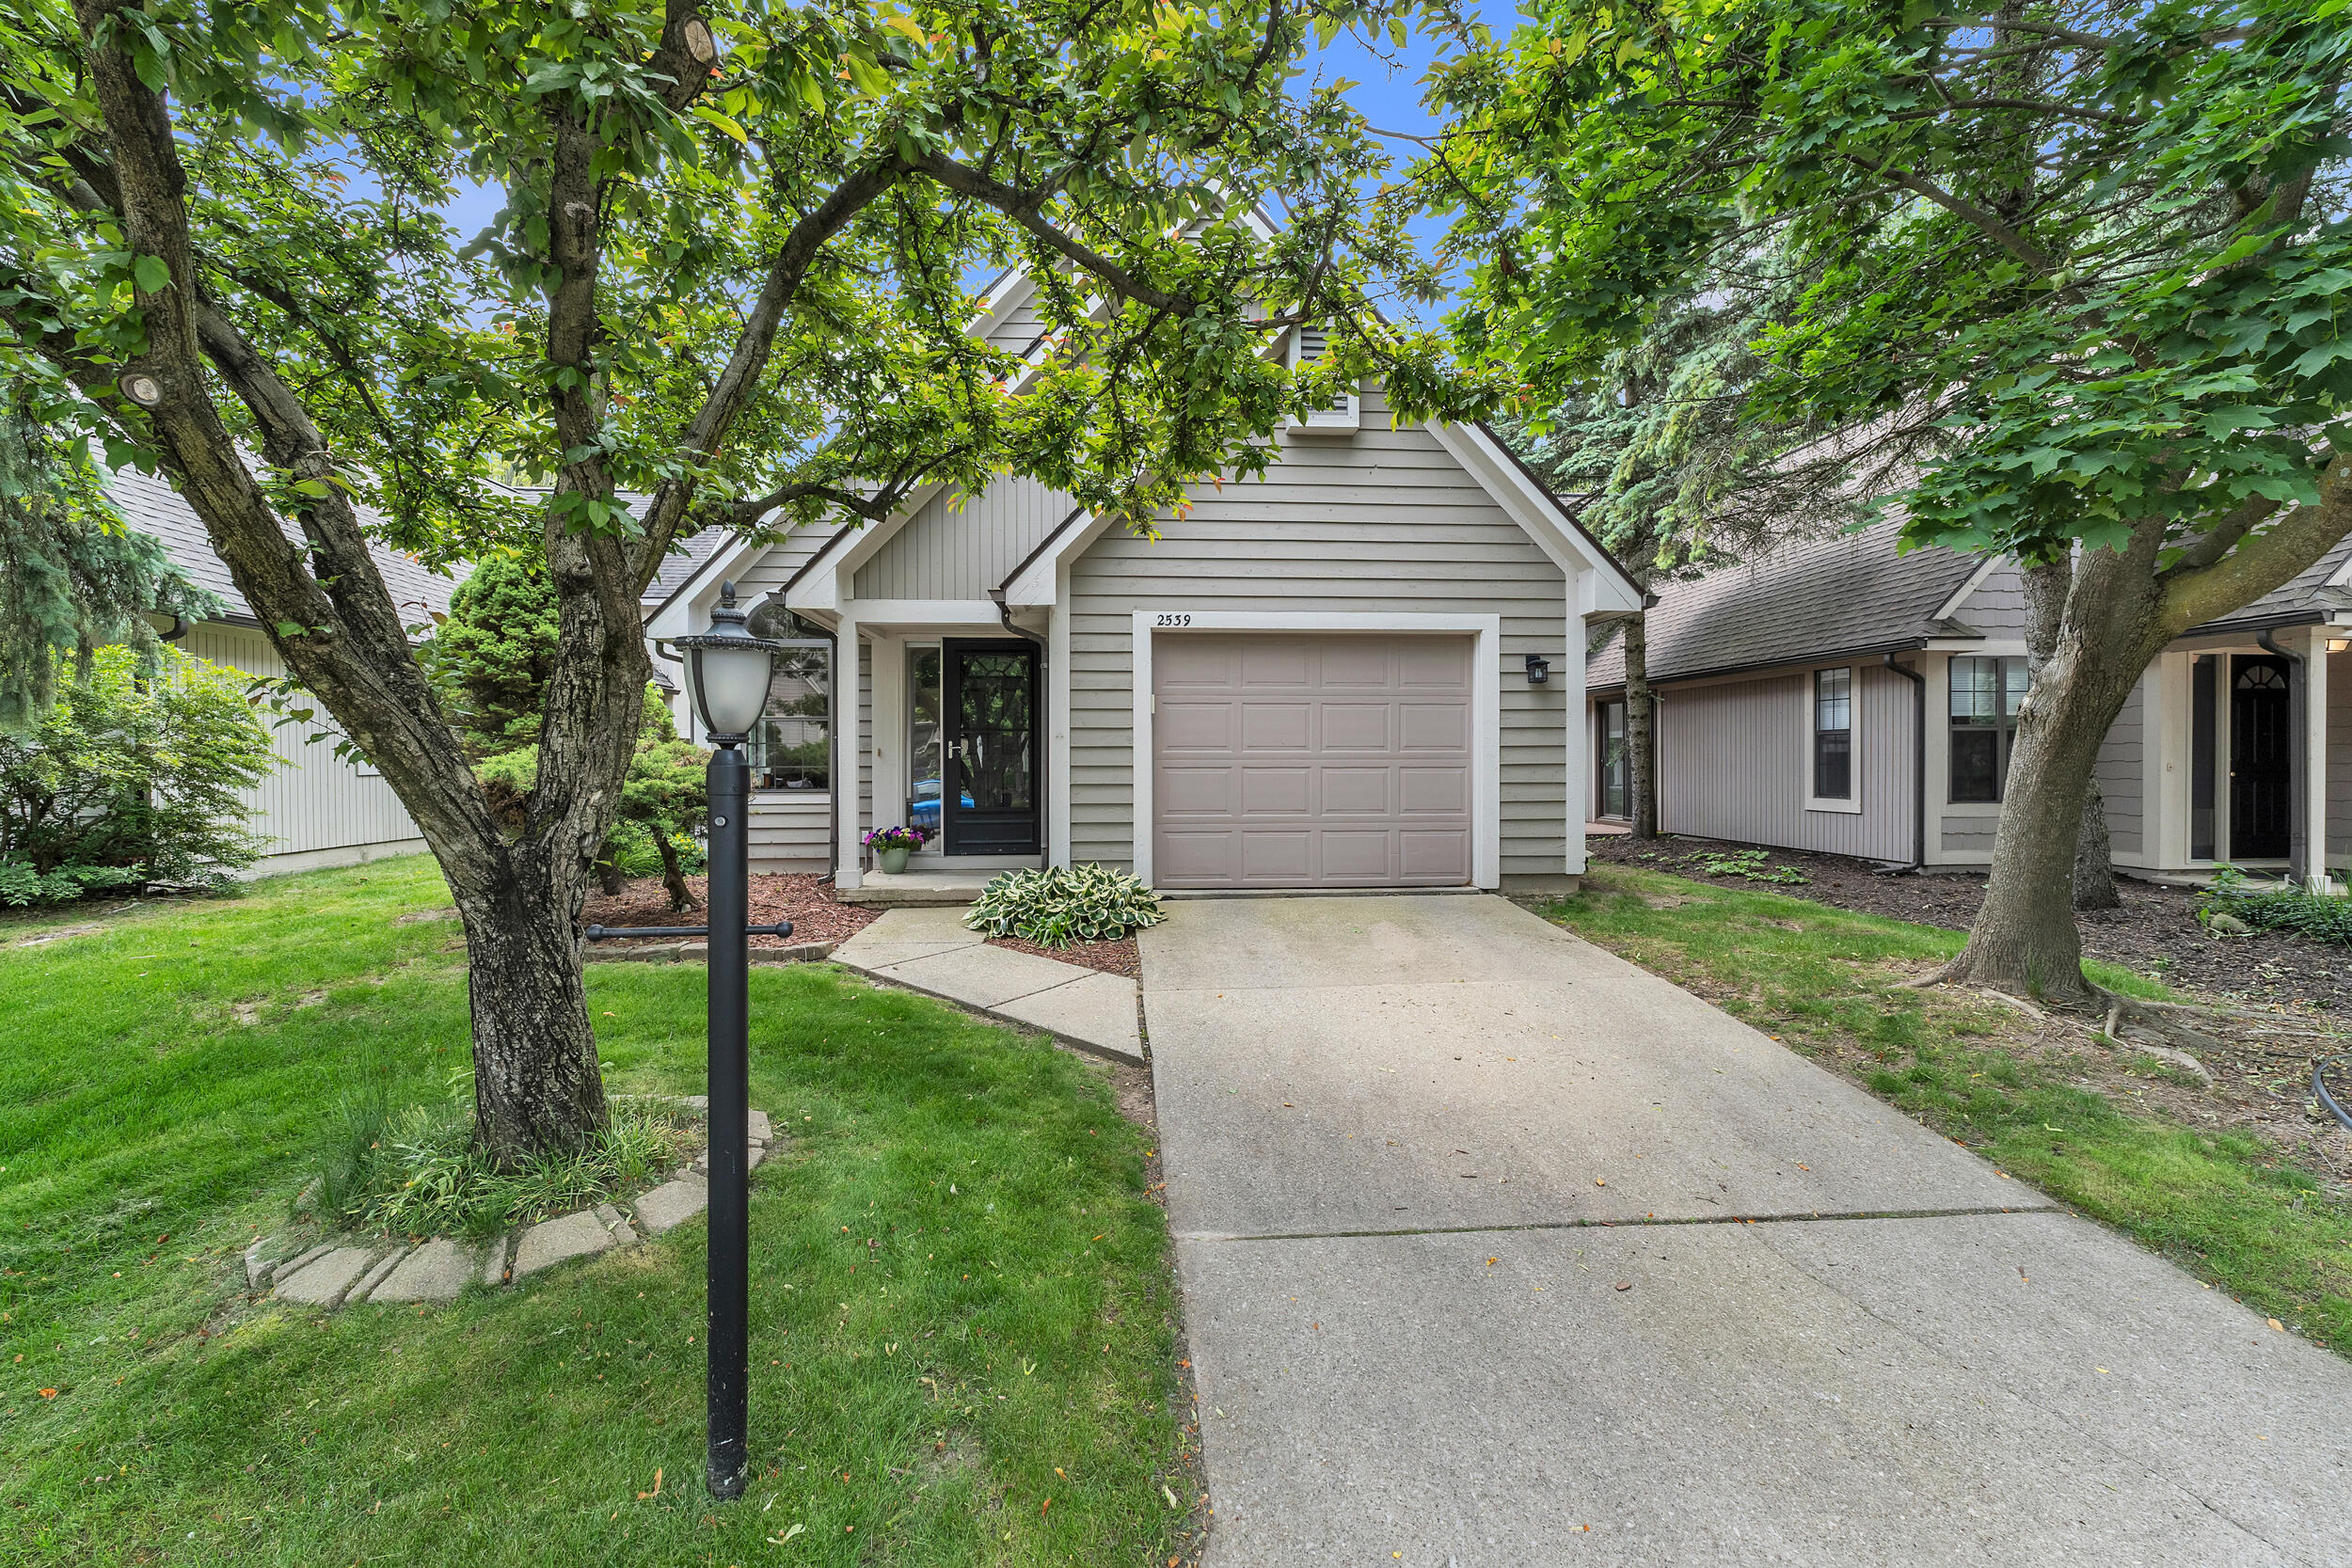
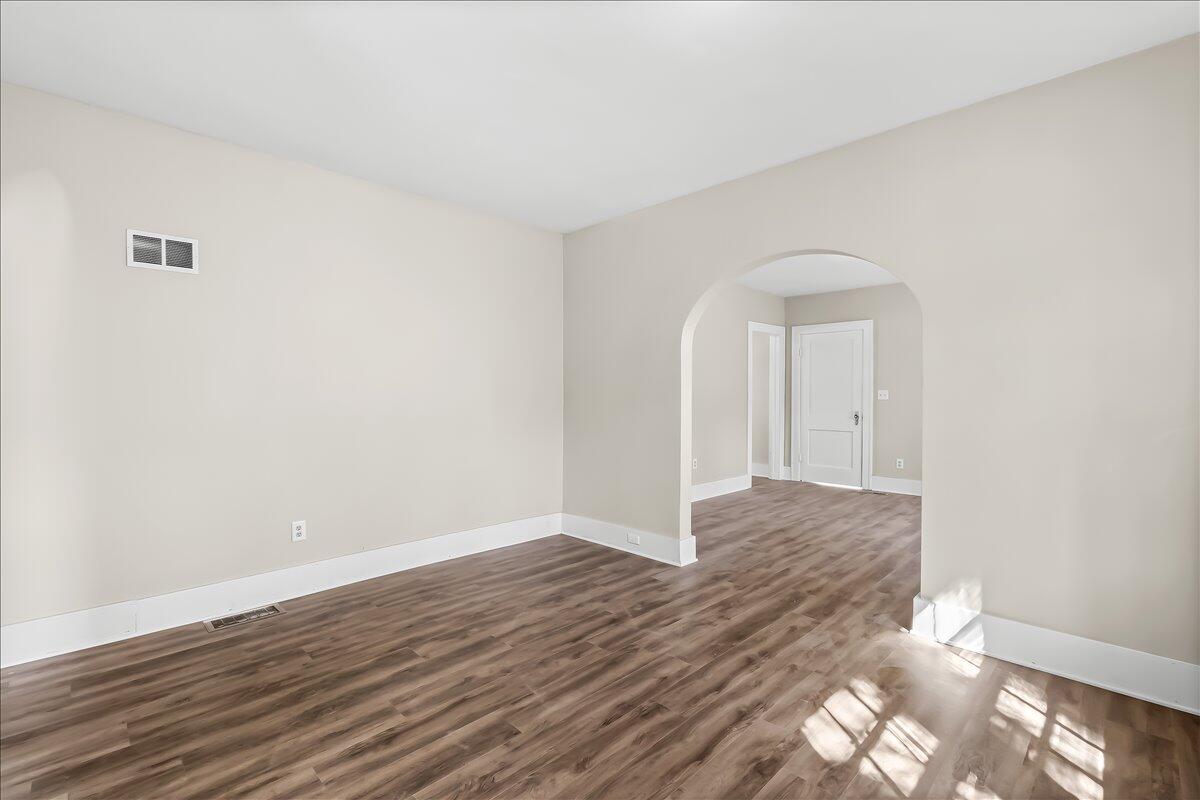
Active
$400,000
3
bds
|
3
ba
|
1,664
sqft
|
built
1991
2539 Country Village Ct, Ann Arbor, MI 48103
$-1,205
Cash flow
-15.7%
Cash-on-Cash Return
2.7%
Cap rate
0.7%
Rent to Value Ratio
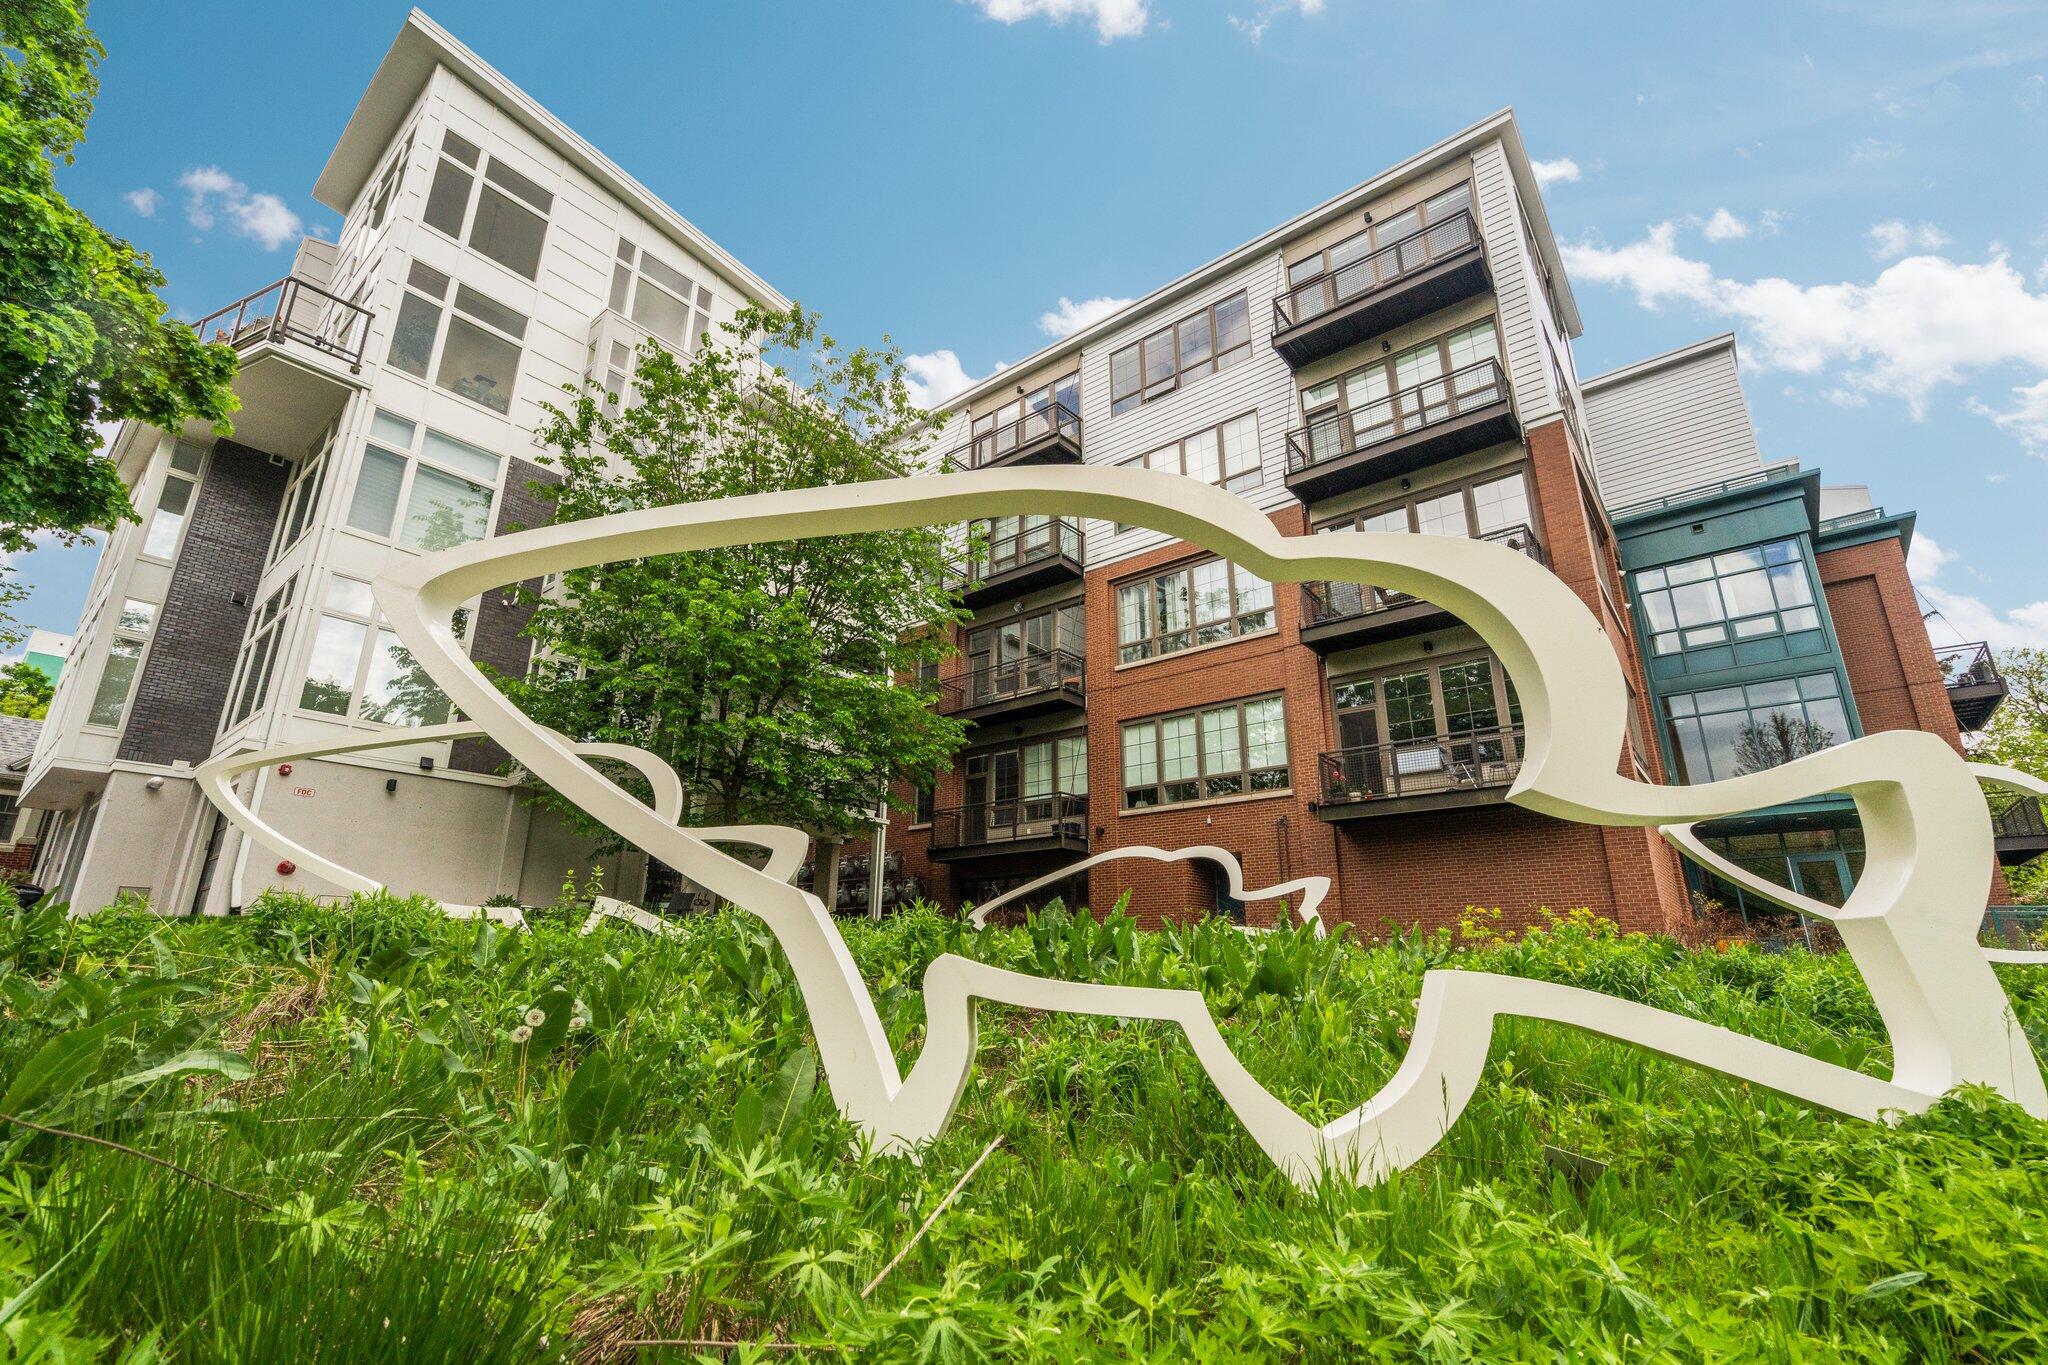
Active
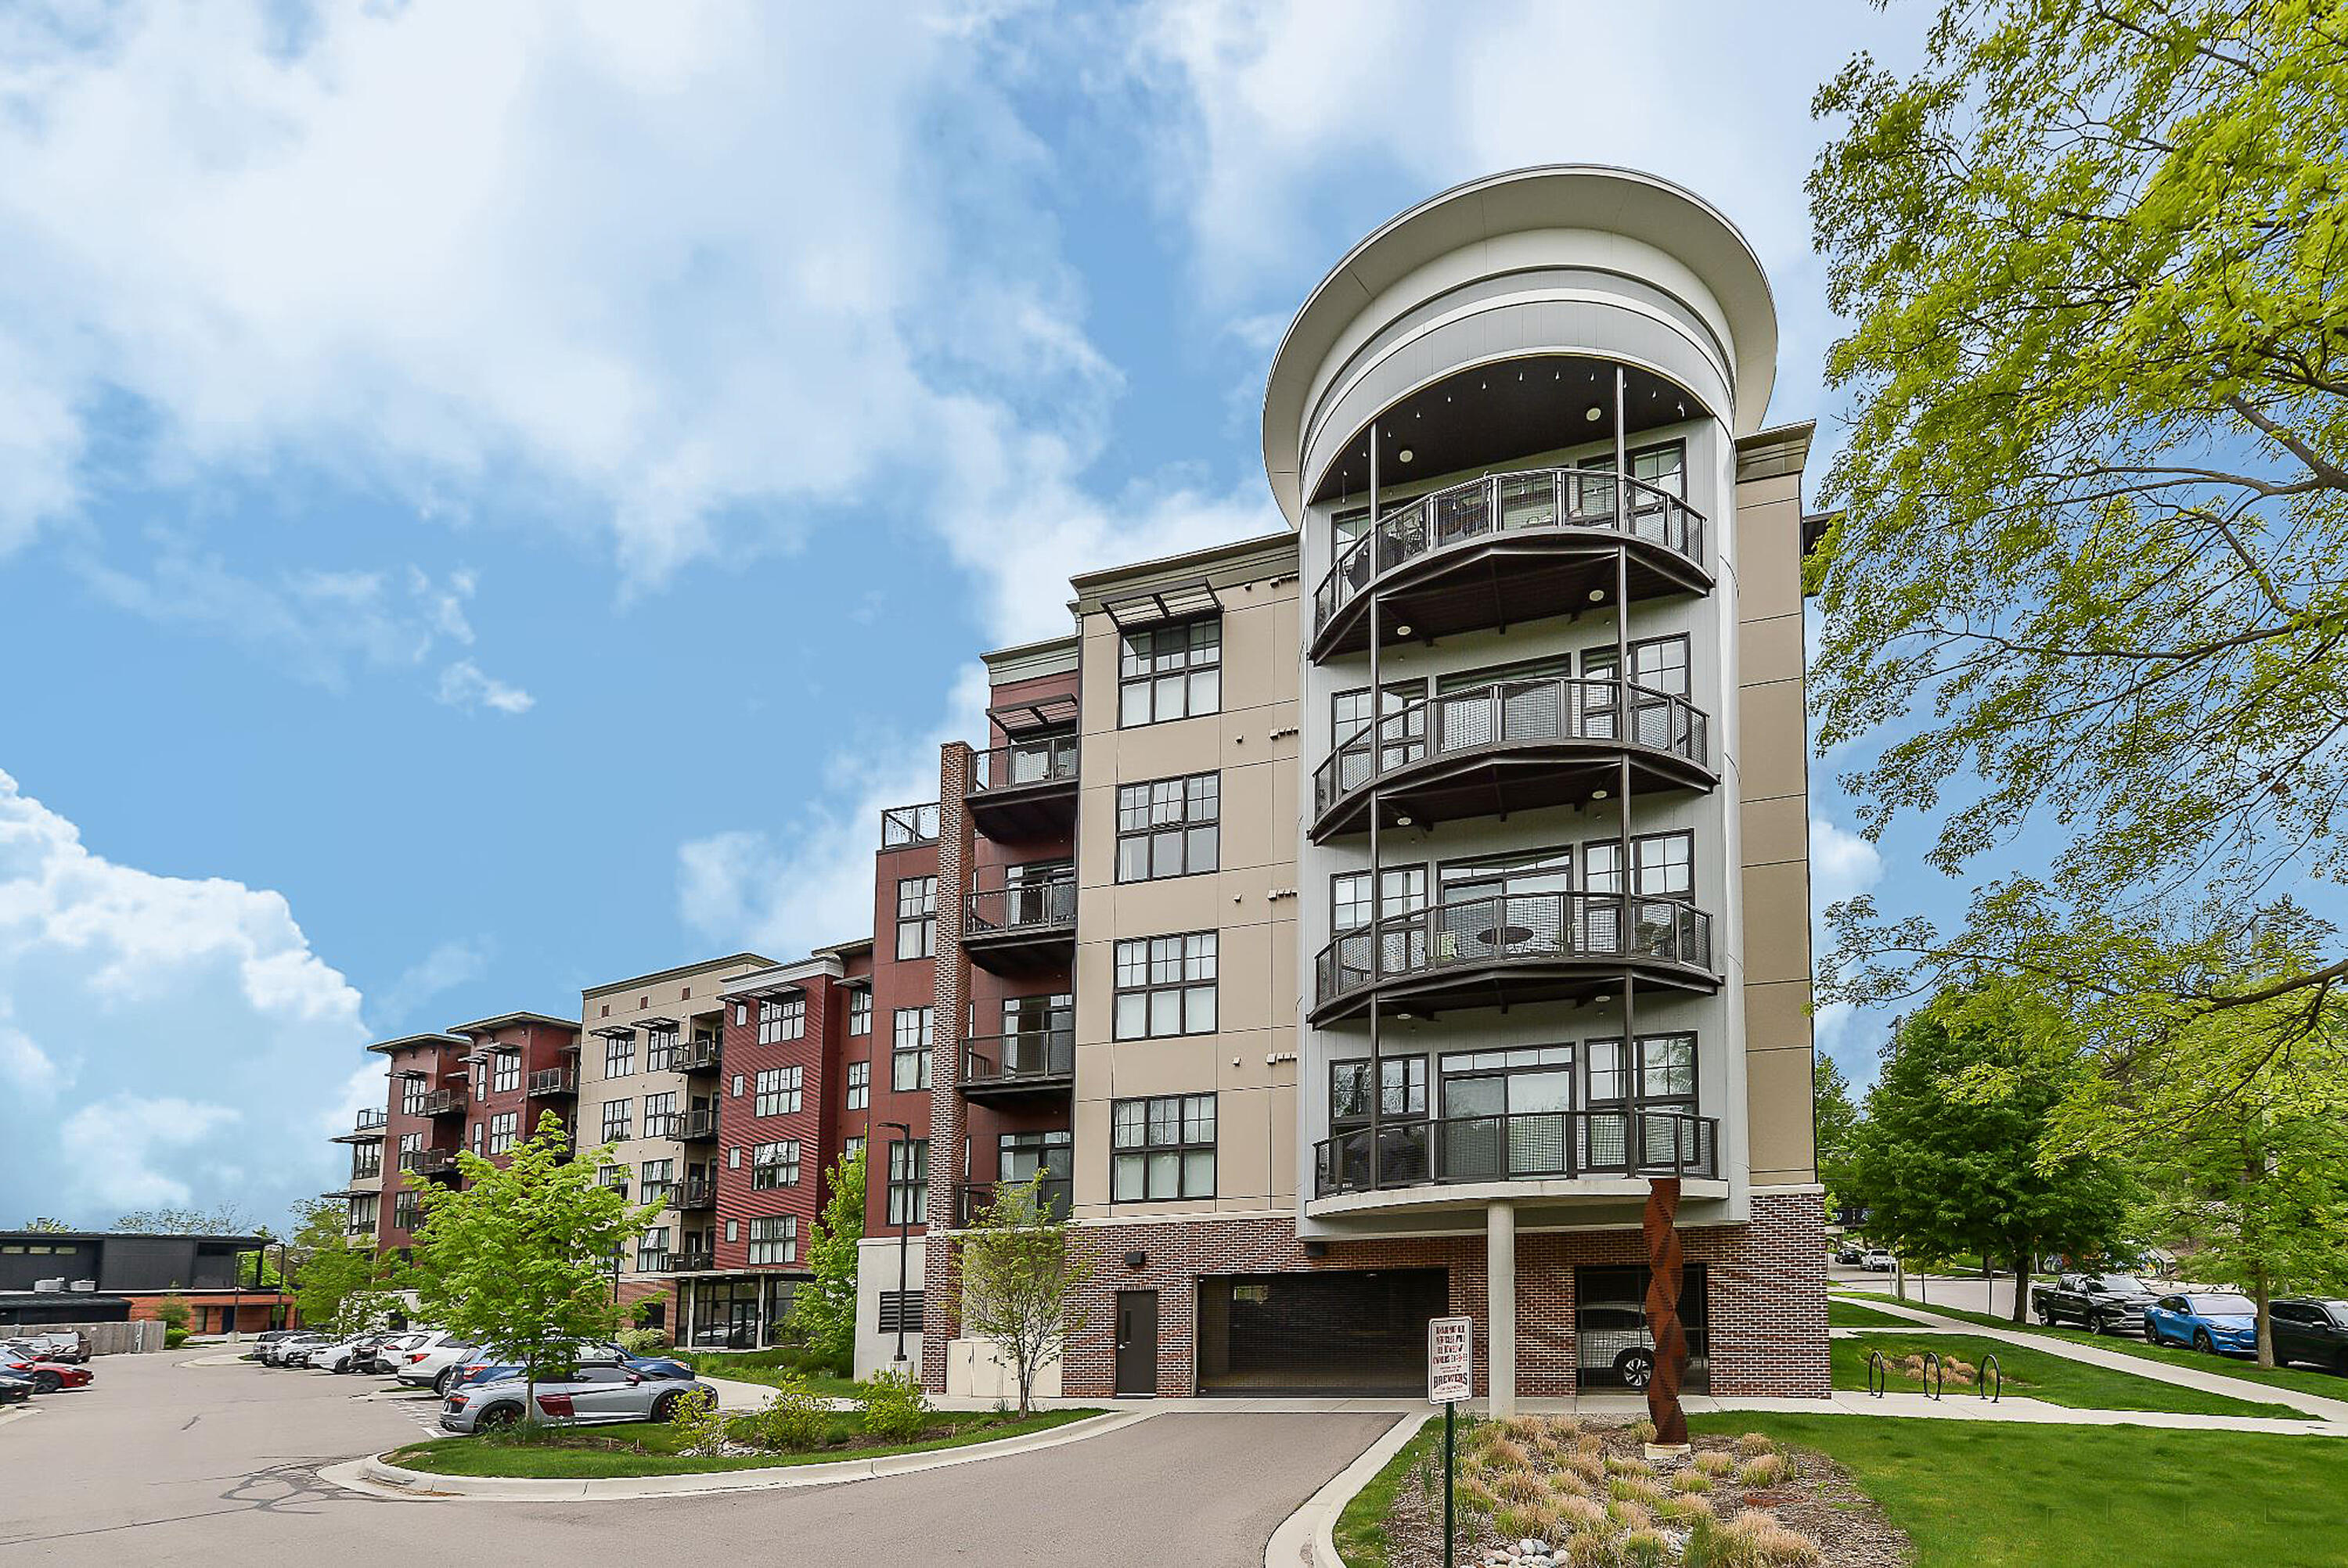
$659,000
2
bds
|
2
ba
|
1,096
sqft
|
built
2017
410 N 1st St, Ann Arbor, MI 48103
$-3,118
Cash flow
-24.7%
Cash-on-Cash Return
0.6%
Cap rate
0.6%
Rent to Value Ratio
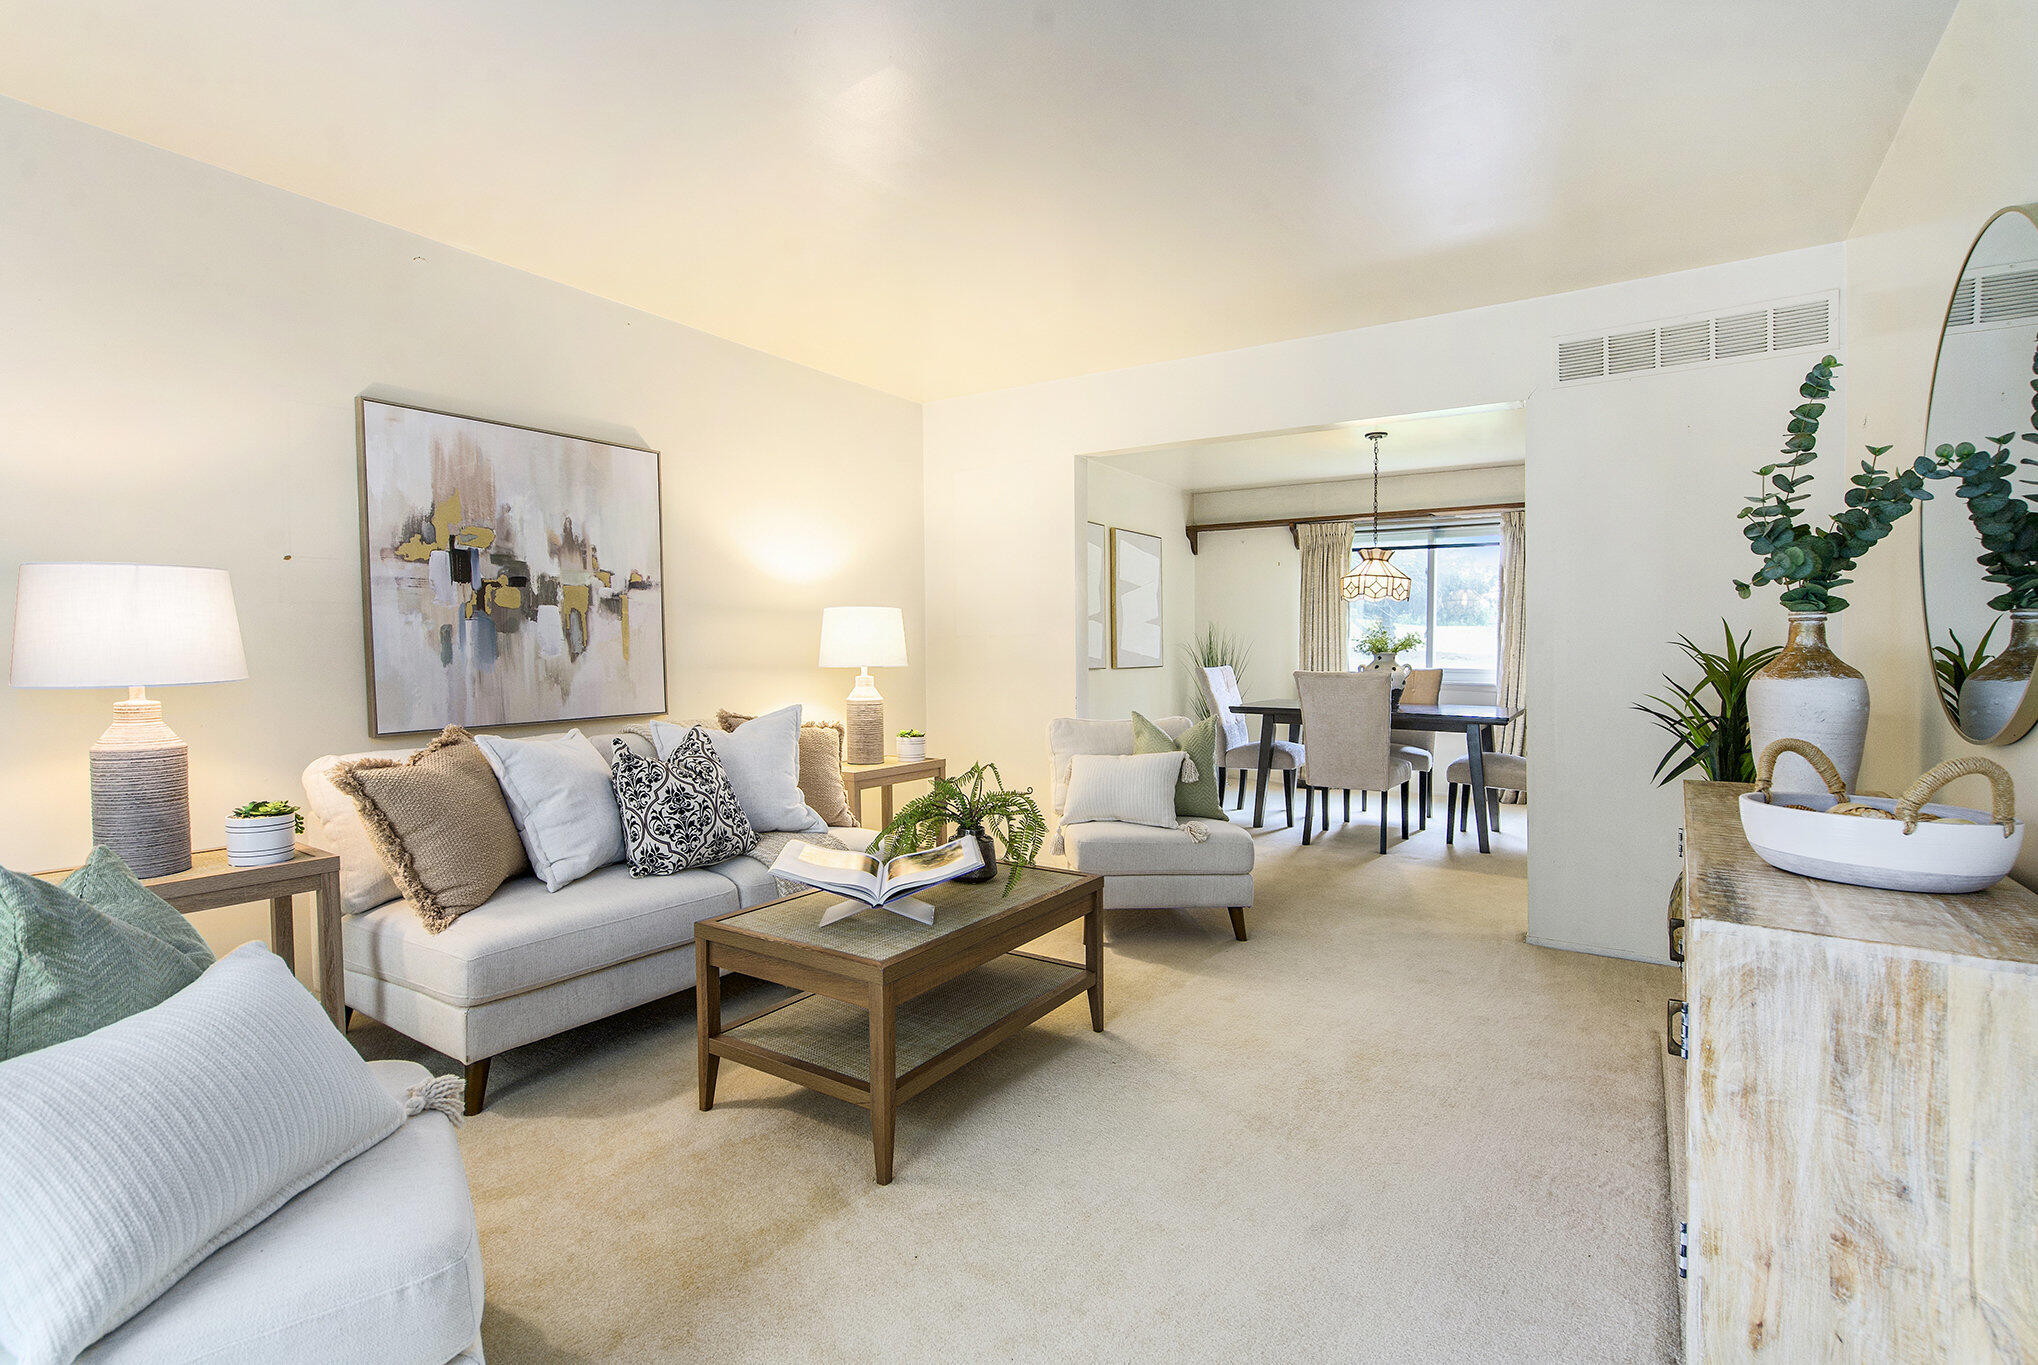
Active under contract
$540,000
4
bds
|
3
ba
|
2,431
sqft
|
built
1972
1349 King George Blvd, Ann Arbor, MI 48108
$-1,306
Cash flow
-12.6%
Cash-on-Cash Return
3.4%
Cap rate
0.6%
Rent to Value Ratio
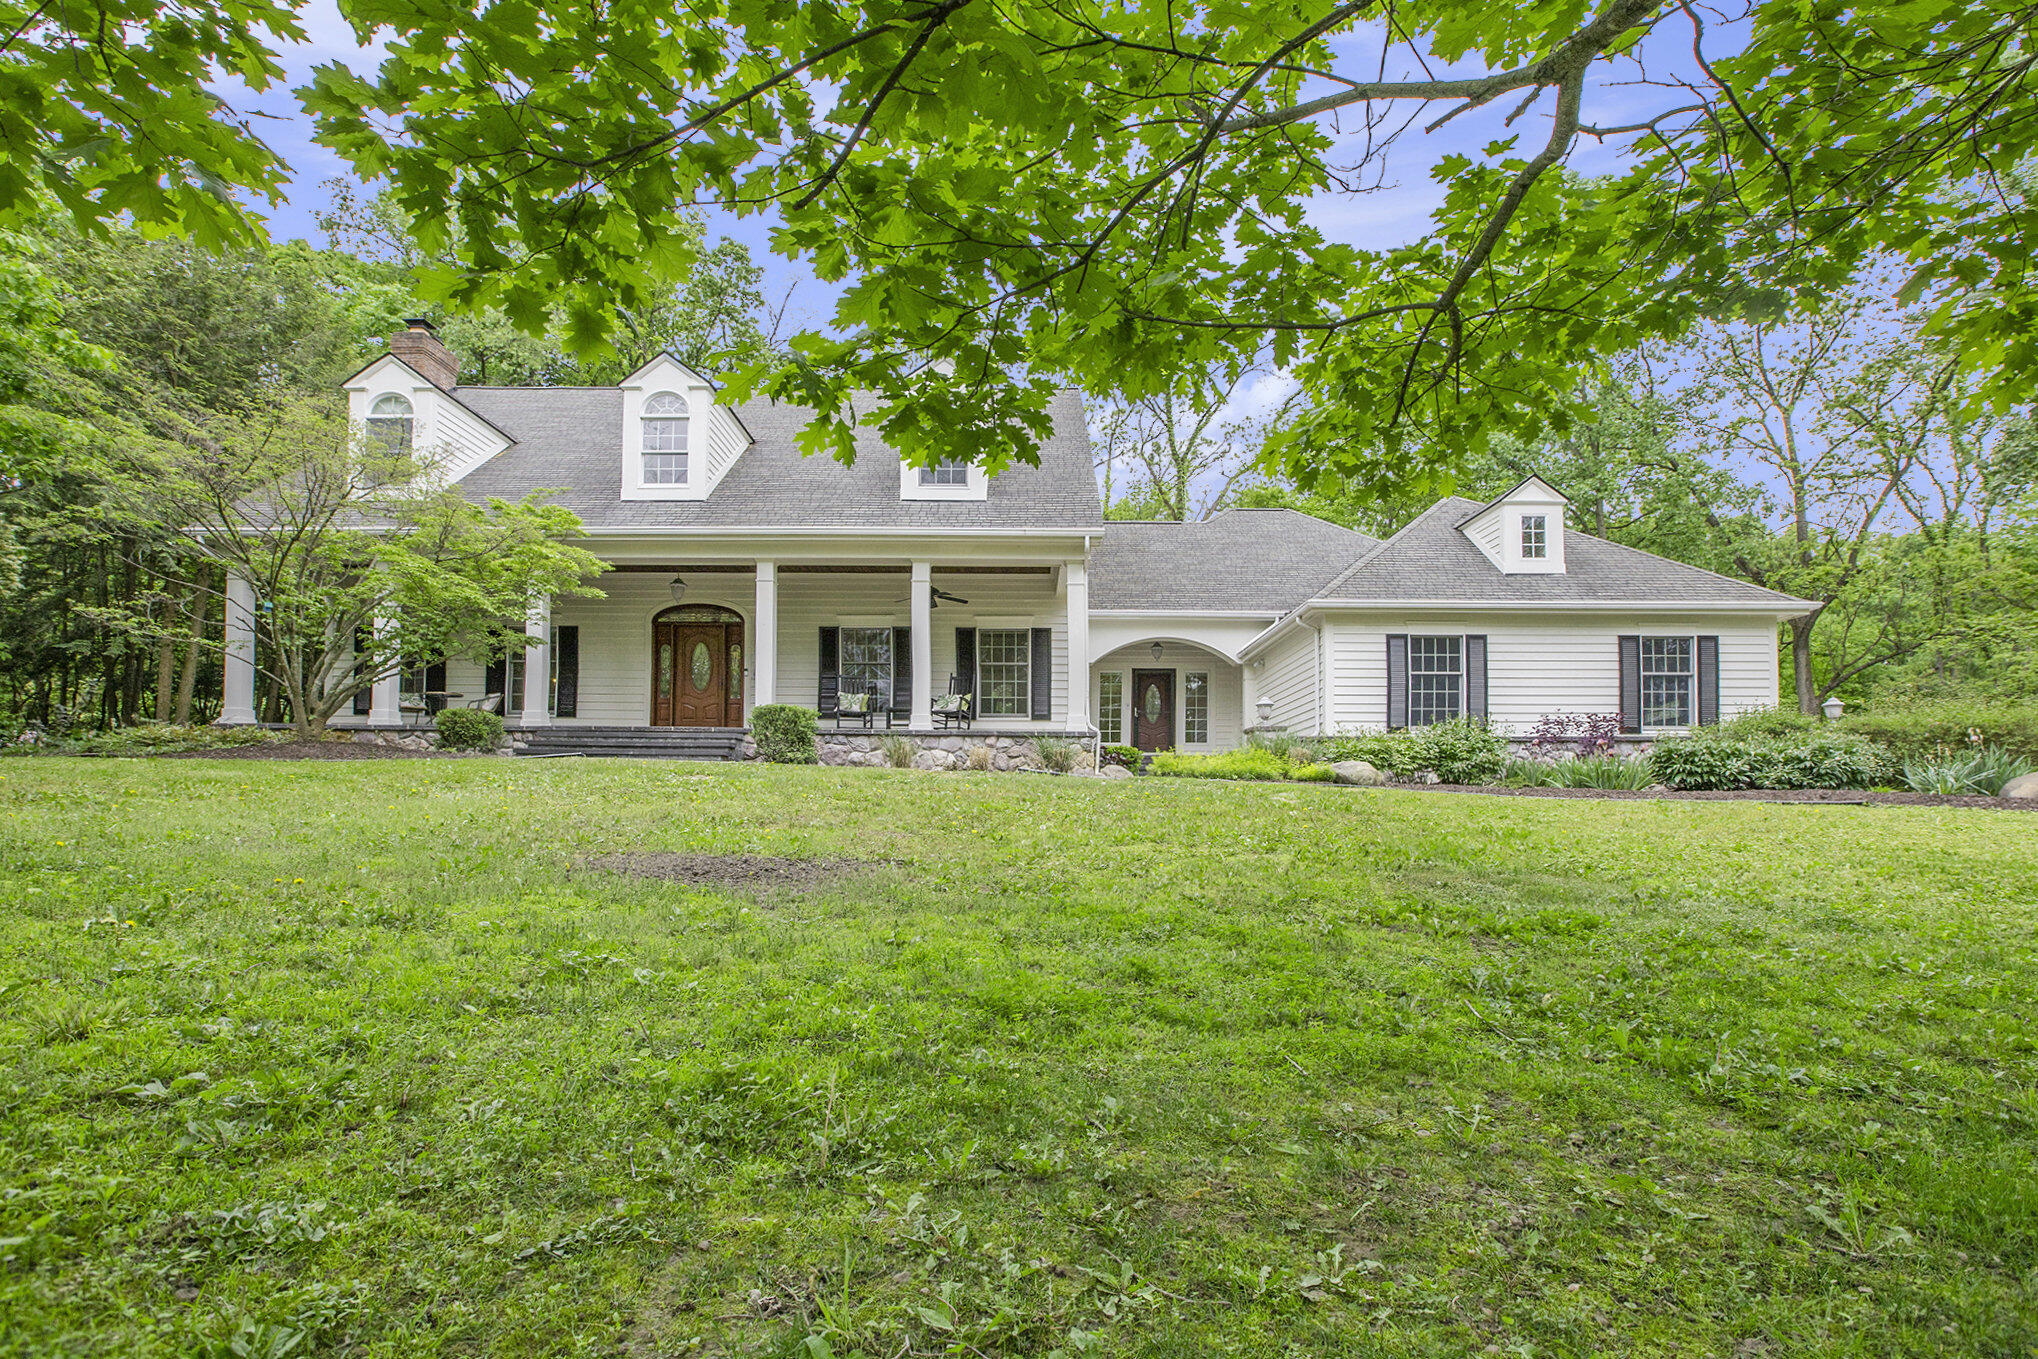
Active
$850,000
3
bds
|
0
ba
|
0
sqft
|
built
1901
220 W Mosley St, Ann Arbor, MI 48103
$-3,706
Cash flow
-22.7%
Cash-on-Cash Return
1.1%
Cap rate
0.4%
Rent to Value Ratio
Active
$975,000
4
bds
|
3
ba
|
3,428
sqft
|
built
1958
1657 Glenwood Rd, Ann Arbor, MI 48104
$-4,328
Cash flow
-23.2%
Cash-on-Cash Return
1.0%
Cap rate
0.4%
Rent to Value Ratio
Active
$749,000
2
bds
|
2
ba
|
2,390
sqft
|
built
1988
3000 Glazier Way, Ann Arbor, MI 48105
$-3,582
Cash flow
-25.0%
Cash-on-Cash Return
0.5%
Cap rate
0.5%
Rent to Value Ratio

Active
$1,175,000
4
bds
|
6
ba
|
5,365
sqft
|
built
2003
998 Eagle Ave, Ann Arbor, MI 48103
$-2,794
Cash flow
-12.4%
Cash-on-Cash Return
3.4%
Cap rate
0.4%
Rent to Value Ratio

Active
$989,000
4
bds
|
4
ba
|
3,784
sqft
|
built
1969
2971 Daleview Dr, Ann Arbor, MI 48105
$-3,905
Cash flow
-20.6%
Cash-on-Cash Return
1.5%
Cap rate
0.3%
Rent to Value Ratio
Active
$625,000
4
bds
|
4
ba
|
2,395
sqft
|
built
2021
2990 Stoke Way, Ann Arbor, MI 48105
$-3,011
Cash flow
-25.1%
Cash-on-Cash Return
0.5%
Cap rate
0.5%
Rent to Value Ratio

Active
$1,345,000
4
bds
|
4
ba
|
5,518
sqft
|
built
1998
2315 Tall Oaks Dr, Ann Arbor, MI 48103
$-6,014
Cash flow
-23.3%
Cash-on-Cash Return
0.9%
Cap rate
0.3%
Rent to Value Ratio
Active
$775,000
2
bds
|
2
ba
|
1,199
sqft
|
built
2018
218 W Kingsley St, Ann Arbor, MI 48103
$-3,375
Cash flow
-22.7%
Cash-on-Cash Return
1.1%
Cap rate
0.5%
Rent to Value Ratio
Active
$1,235,000
4
bds
|
4
ba
|
4,767
sqft
|
built
1957
1060 Chestnut St, Ann Arbor, MI 48104
$-5,447
Cash flow
-23.0%
Cash-on-Cash Return
1.0%
Cap rate
0.3%
Rent to Value Ratio
Active
$1,795,000
5
bds
|
5
ba
|
5,045
sqft
|
built
1908
1015 Olivia Ave, Ann Arbor, MI 48104
$-8,086
Cash flow
-23.5%
Cash-on-Cash Return
0.9%
Cap rate
0.3%
Rent to Value Ratio
Active under contract
$185,000
1
bds
|
1
ba
|
614
sqft
|
built
1945
2542 Pittsfield Blvd, Ann Arbor, MI 48104
$-518
Cash flow
-14.6%
Cash-on-Cash Return
2.9%
Cap rate
0.9%
Rent to Value Ratio
Active
$355,000
2
bds
|
2
ba
|
1,402
sqft
|
built
1999
1870 Lindsay Ln, Ann Arbor, MI 48104
$-1,580
Cash flow
-23.2%
Cash-on-Cash Return
0.9%
Cap rate
0.6%
Rent to Value Ratio
Active
$515,000
4
bds
|
1
ba
|
1,456
sqft
|
built
1950
1204 Bydding Rd, Ann Arbor, MI 48103
$-1,414
Cash flow
-14.3%
Cash-on-Cash Return
3.0%
Cap rate
0.5%
Rent to Value Ratio
Active
$749,000
3
bds
|
3
ba
|
1,878
sqft
|
built
1901
414 W Summit St, Ann Arbor, MI 48103
$-3,084
Cash flow
-21.5%
Cash-on-Cash Return
1.3%
Cap rate
0.4%
Rent to Value Ratio
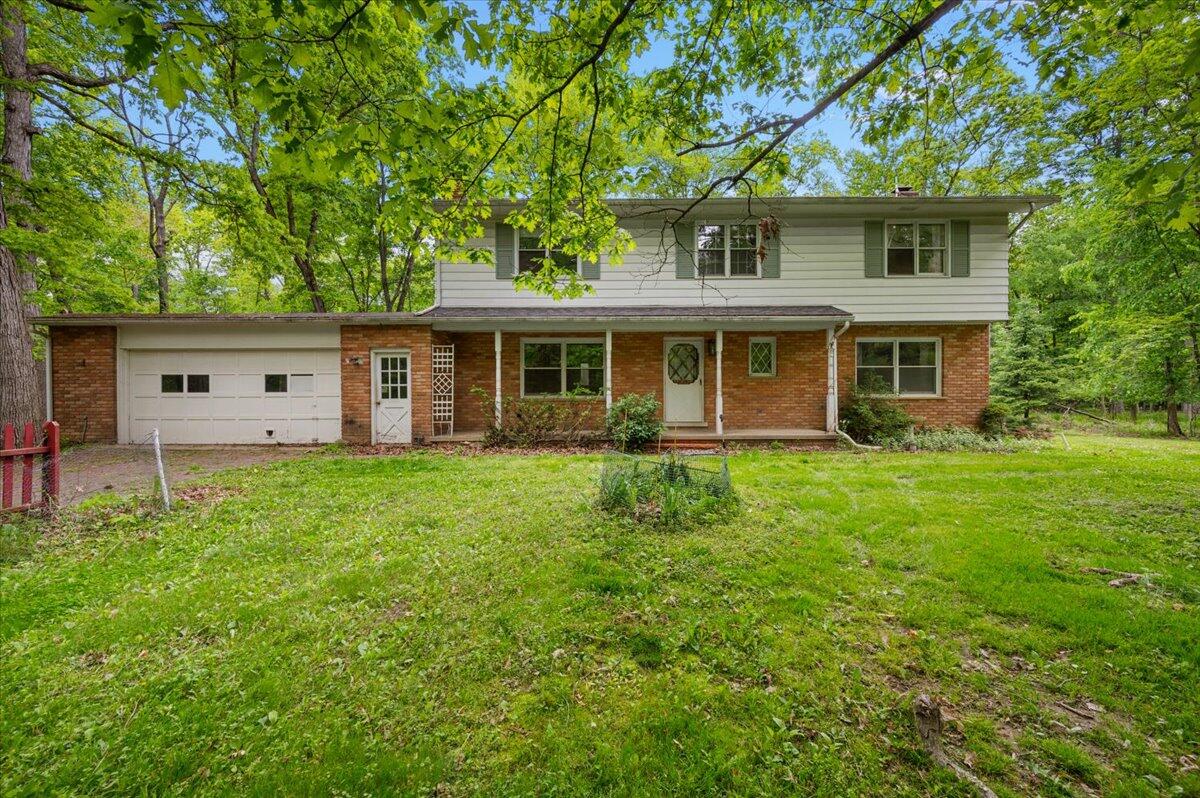
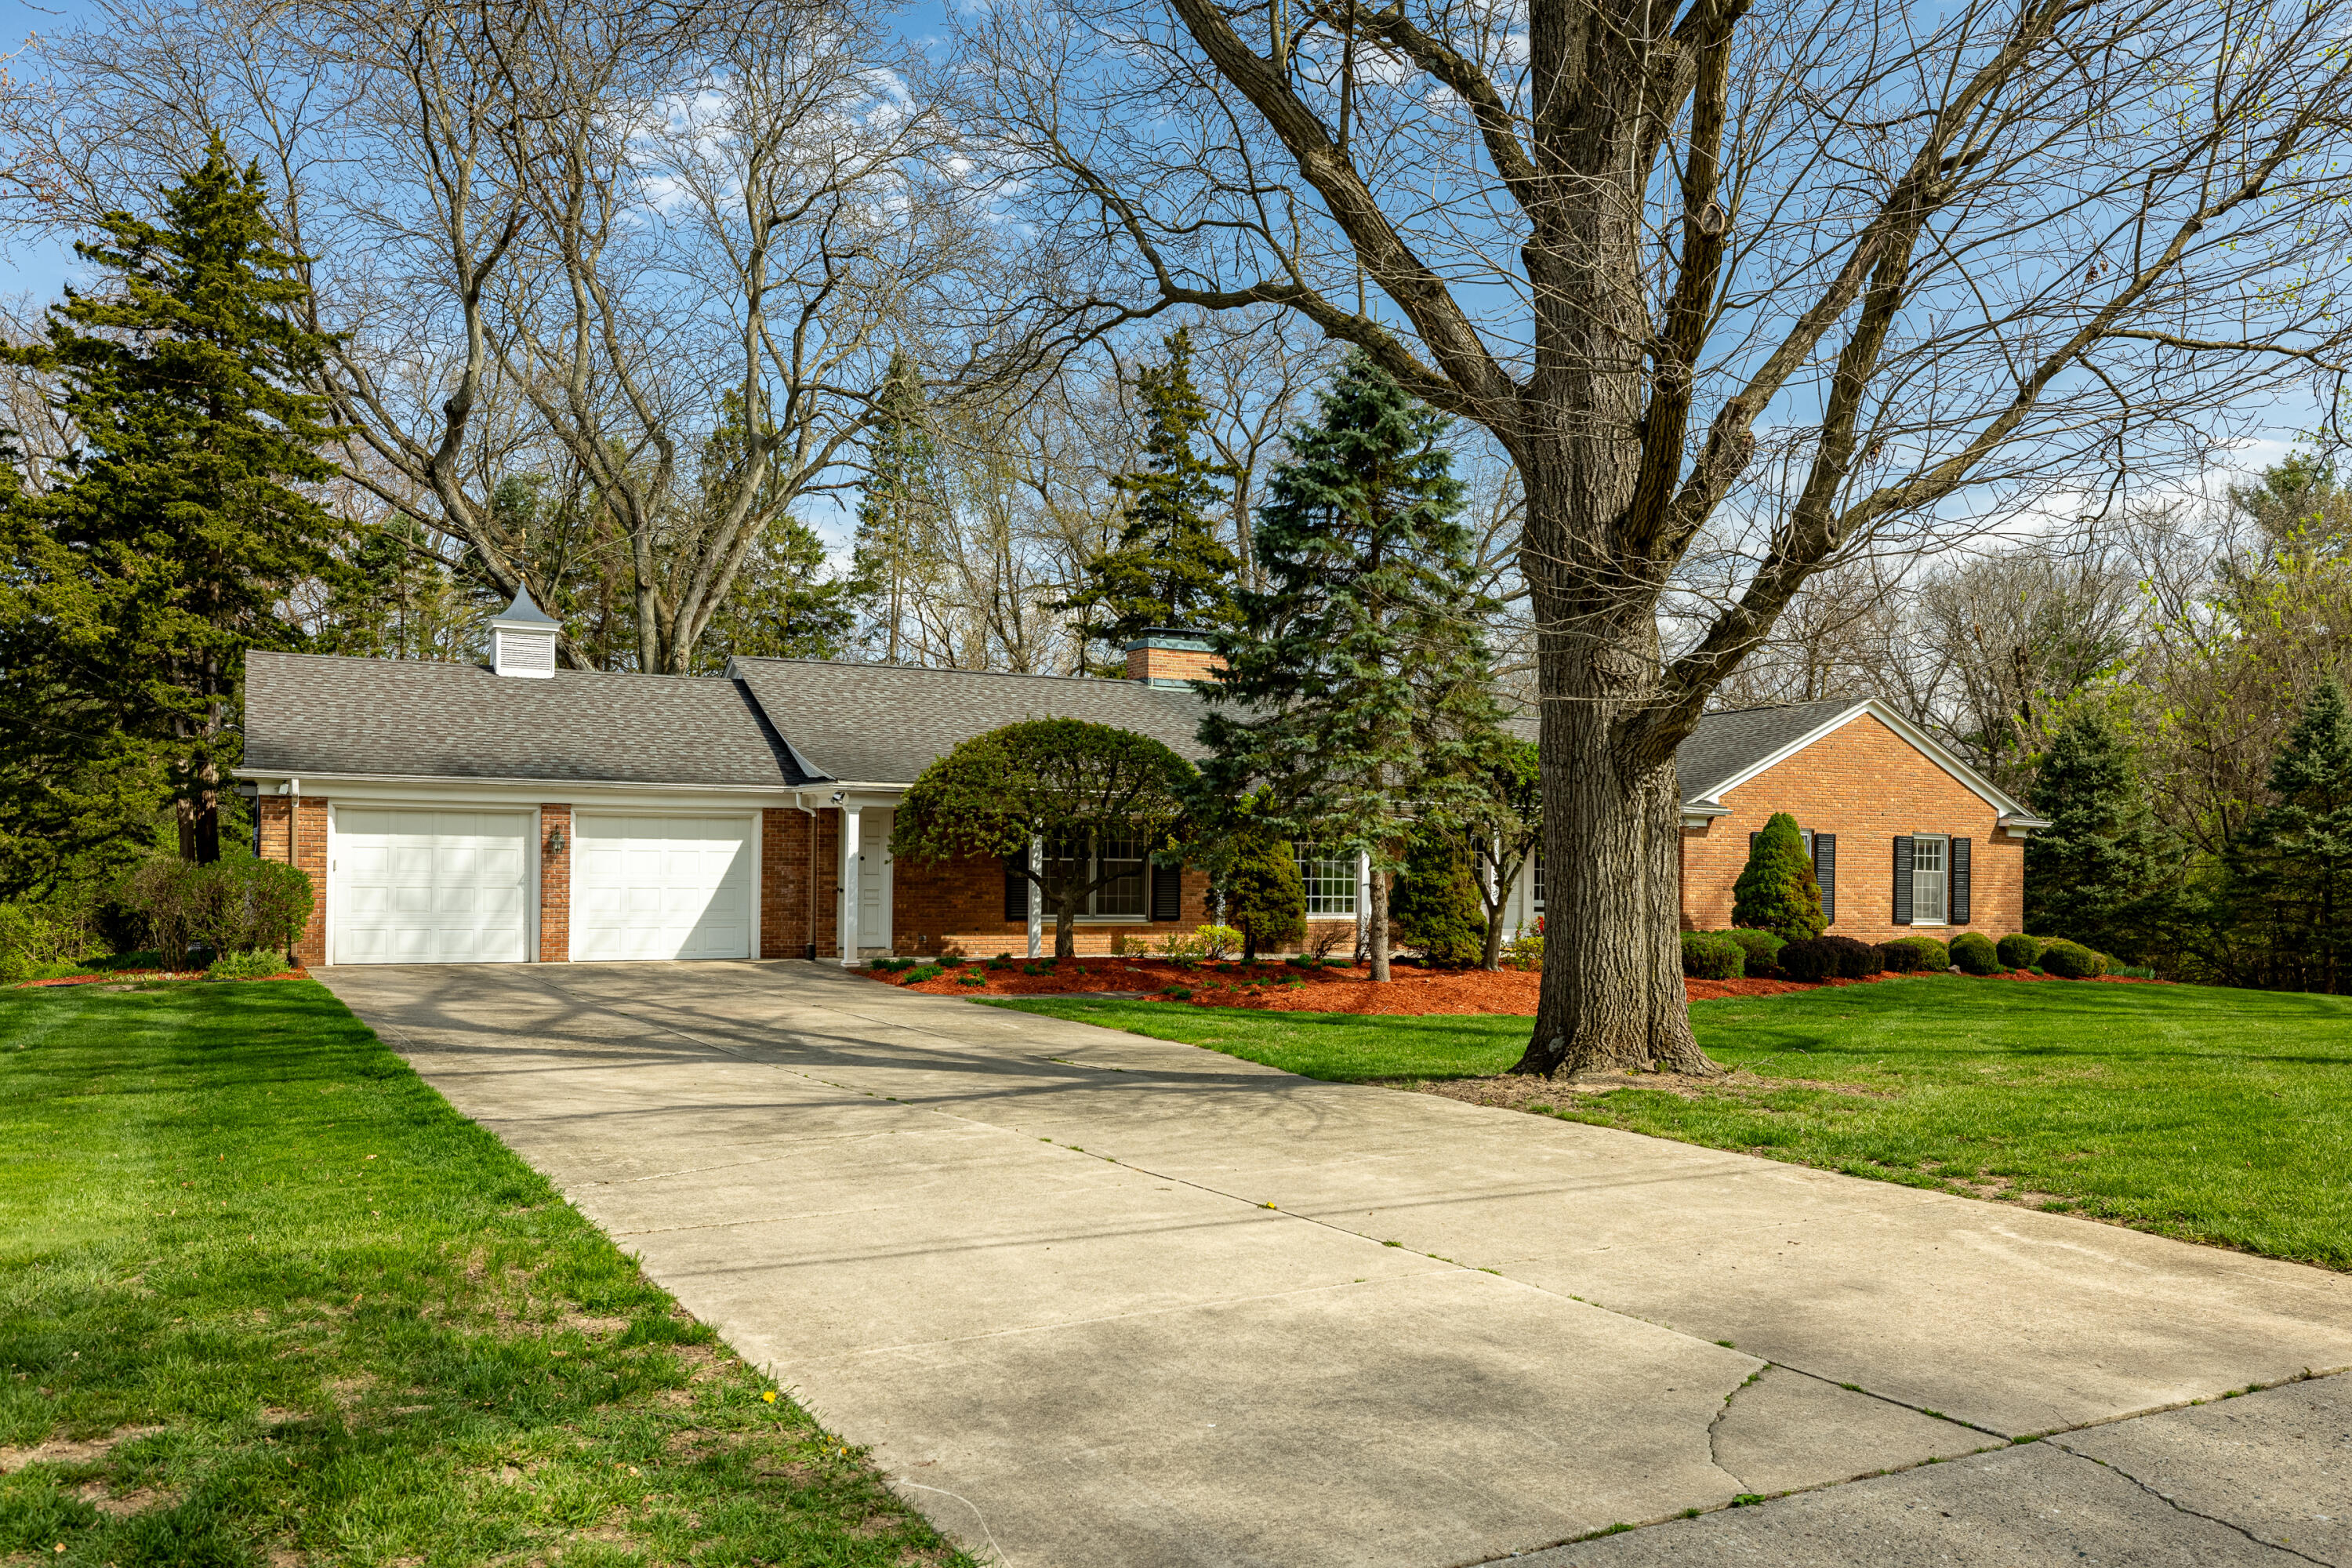
Active
$600,000
4
bds
|
3
ba
|
2,441
sqft
|
built
1966
2100 W Delhi Rd, Ann Arbor, MI 48103
$-1,030
Cash flow
-9.0%
Cash-on-Cash Return
4.2%
Cap rate
0.7%
Rent to Value Ratio
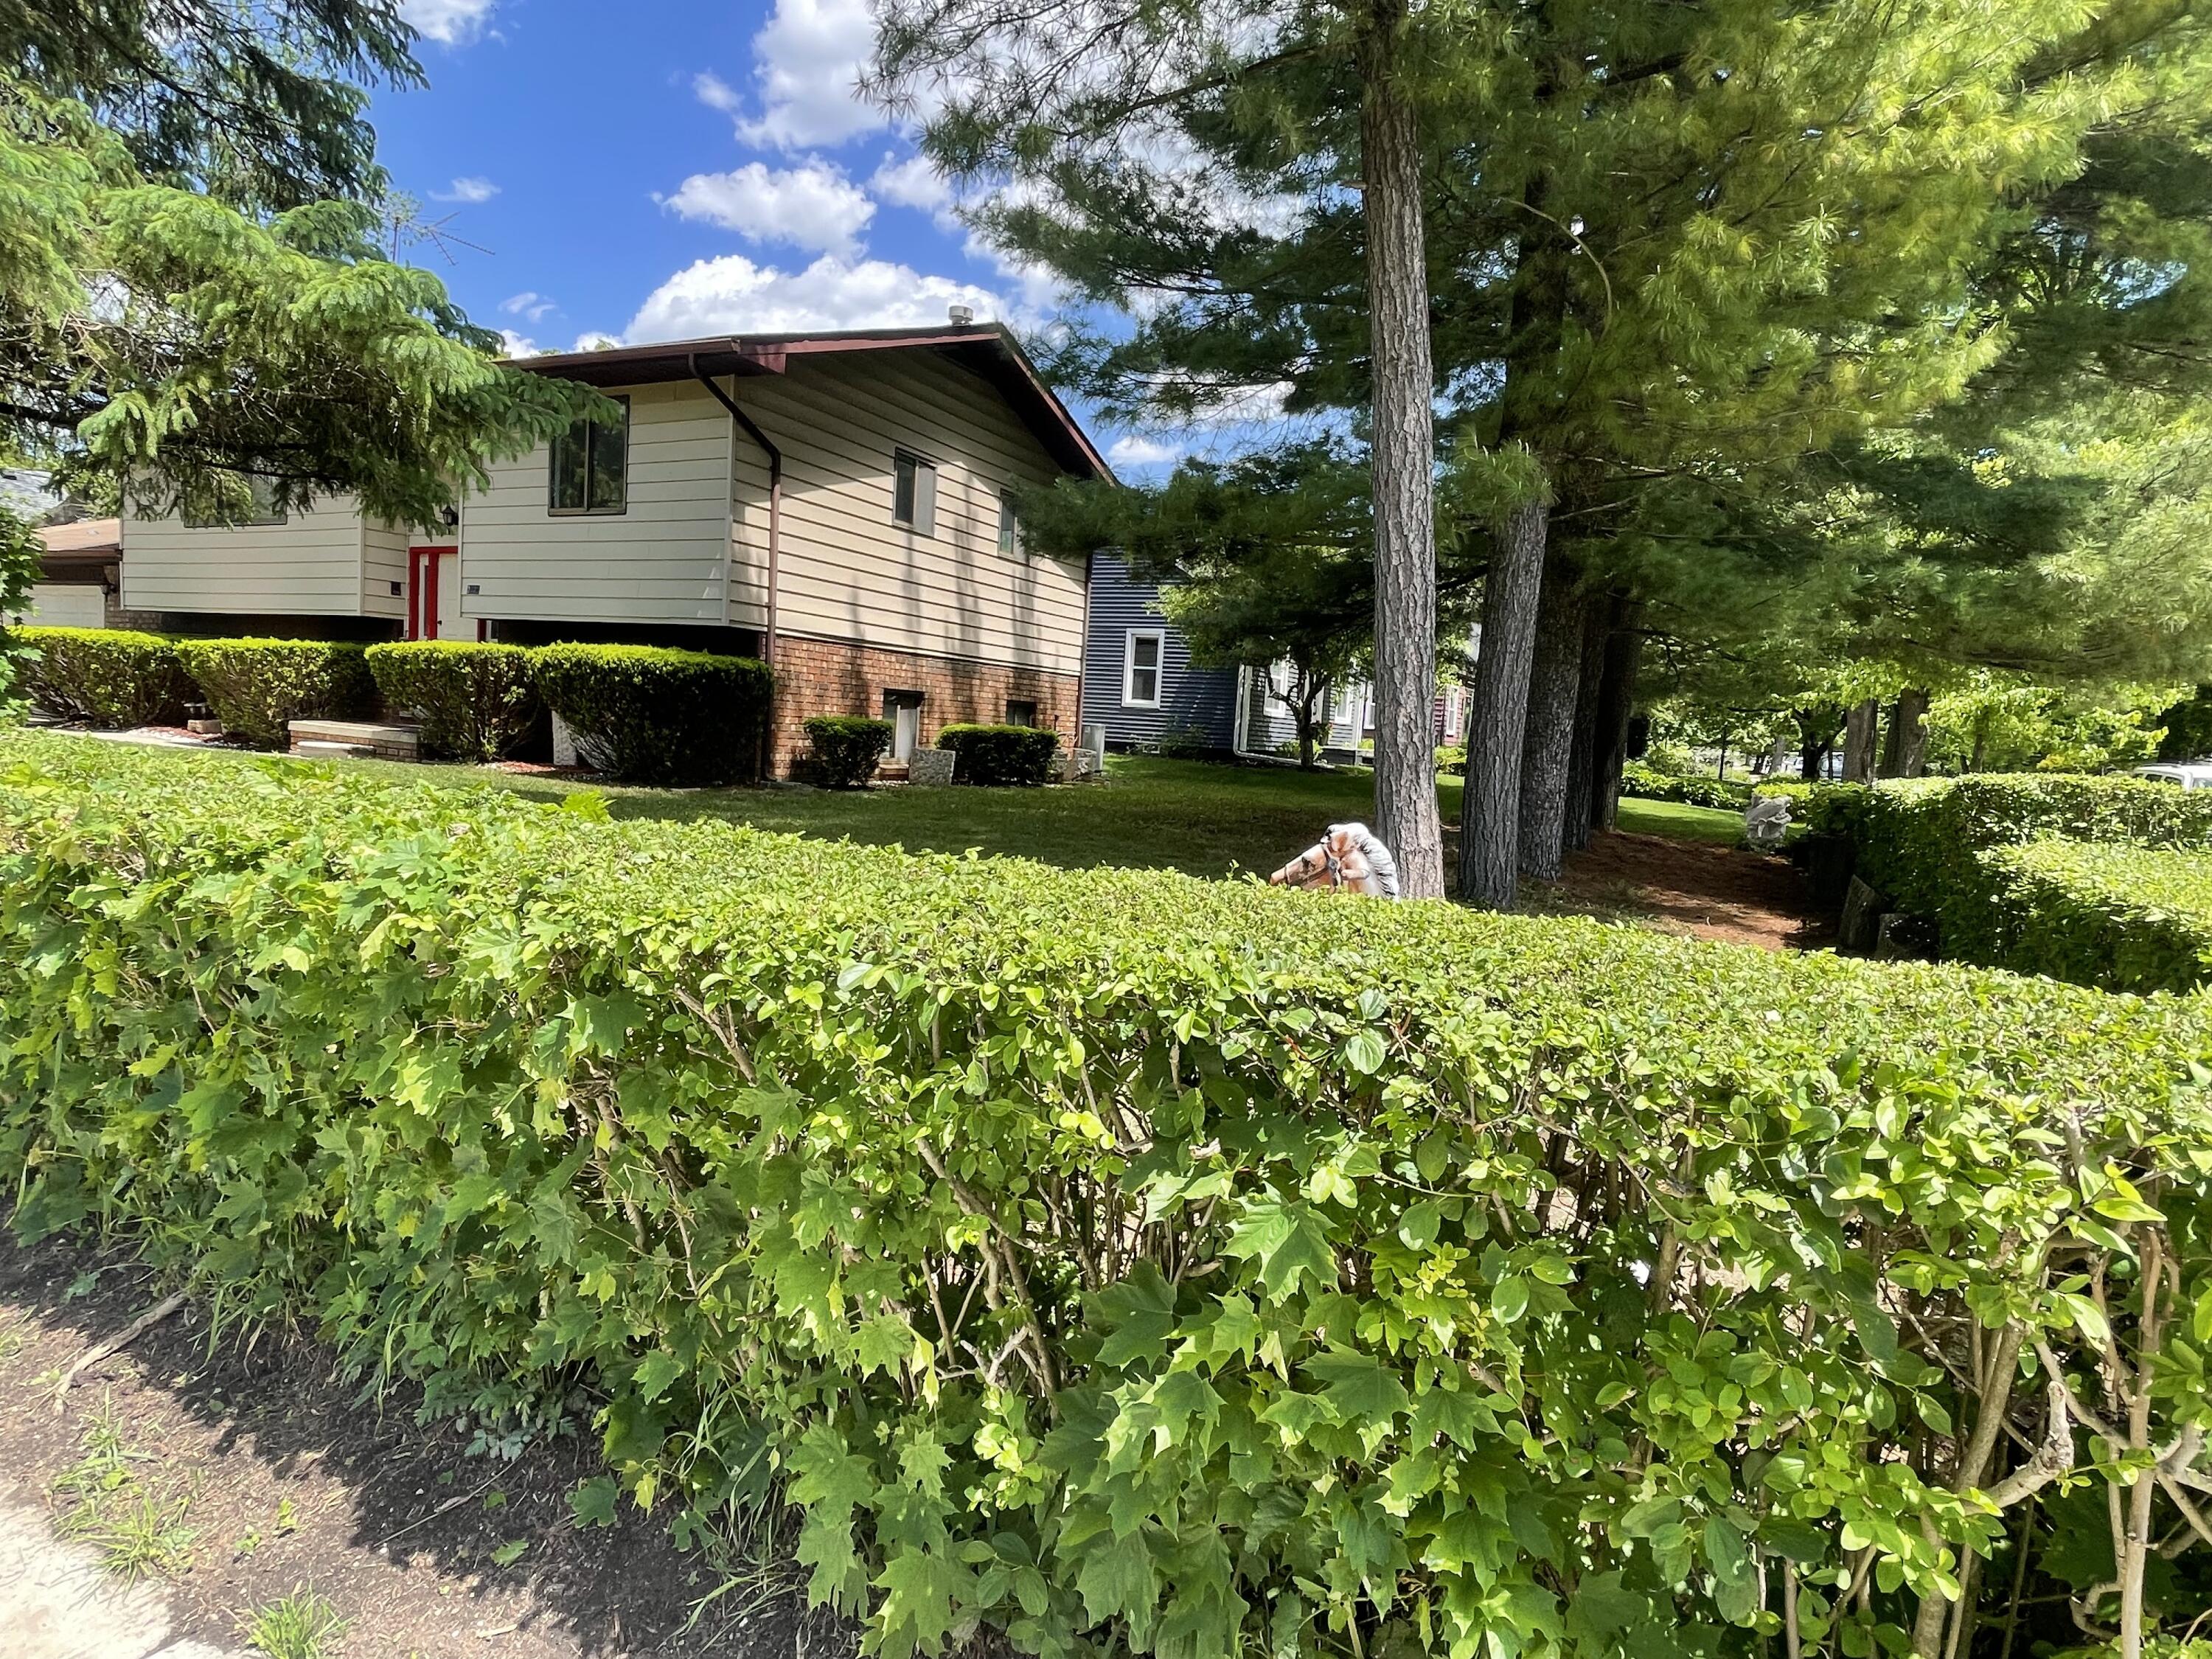
Active
$619,000
4
bds
|
2
ba
|
1,780
sqft
|
built
1980
2323 Page Ave, Ann Arbor, MI 48104
$-1,376
Cash flow
-11.6%
Cash-on-Cash Return
3.6%
Cap rate
0.6%
Rent to Value Ratio
Active
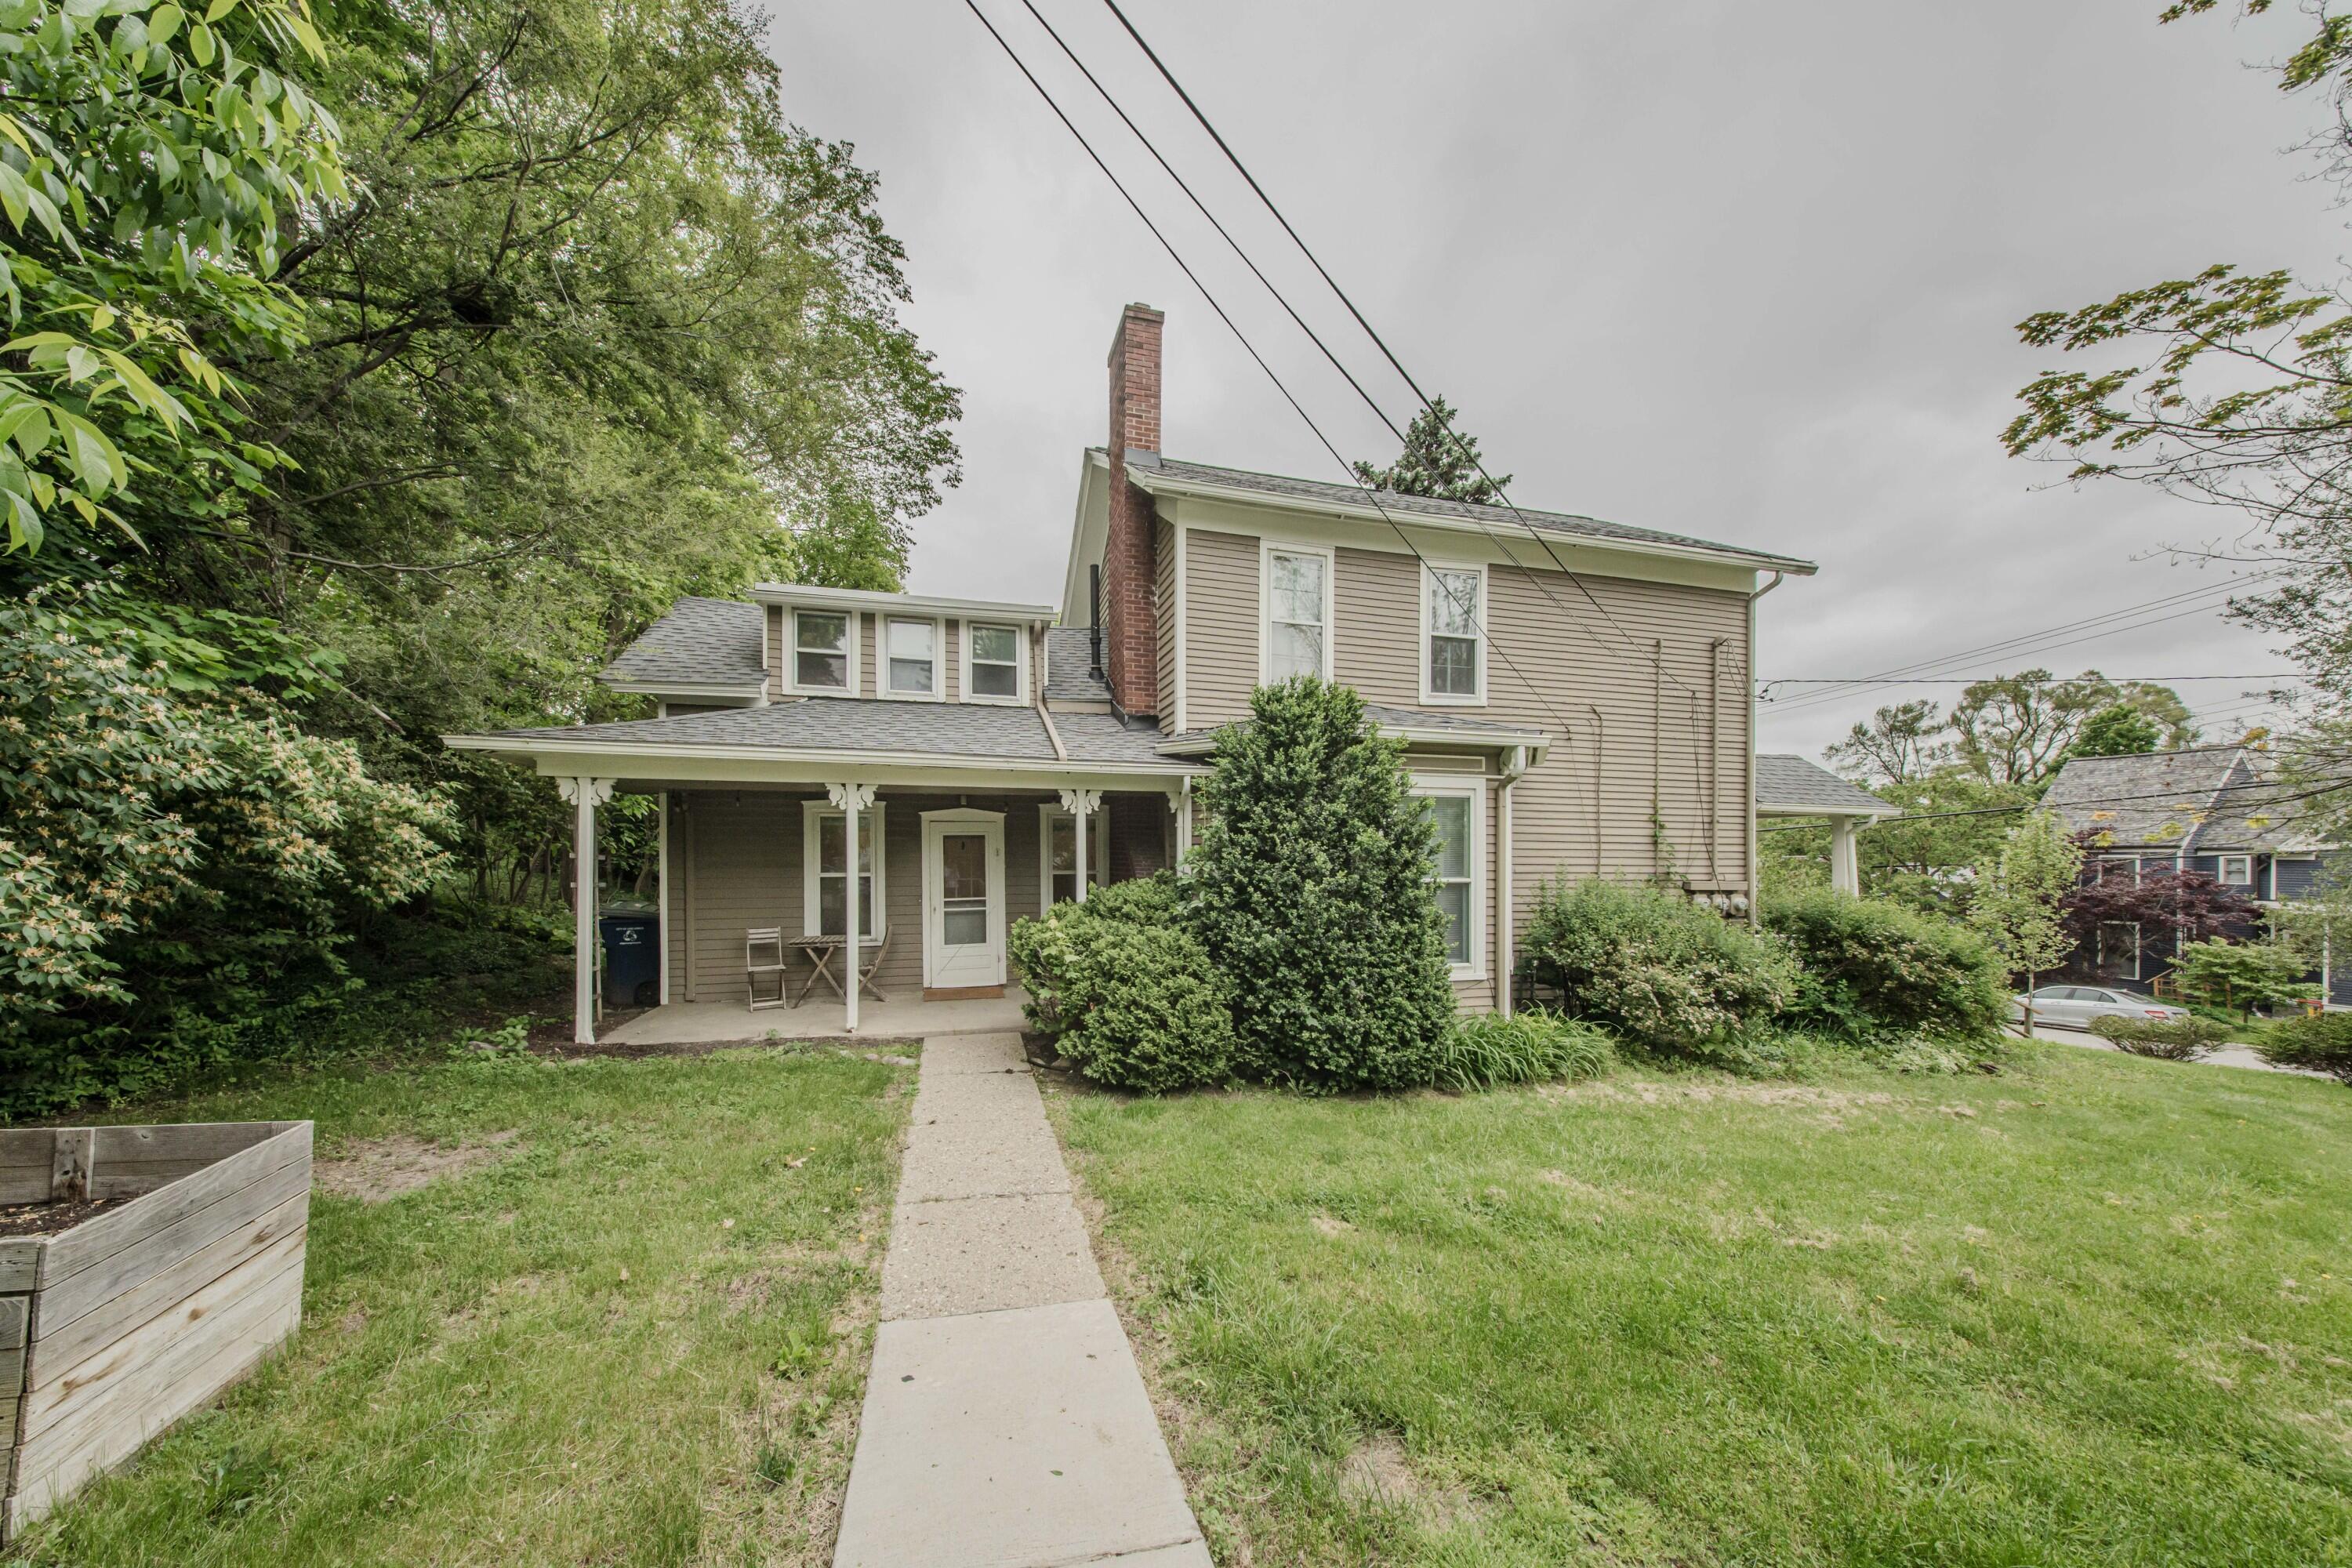
$550,000
4
bds
|
3
ba
|
2,028
sqft
|
built
1924
2107 Jackson Ave, Ann Arbor, MI 48103
$-1,088
Cash flow
-10.3%
Cash-on-Cash Return
3.9%
Cap rate
0.7%
Rent to Value Ratio
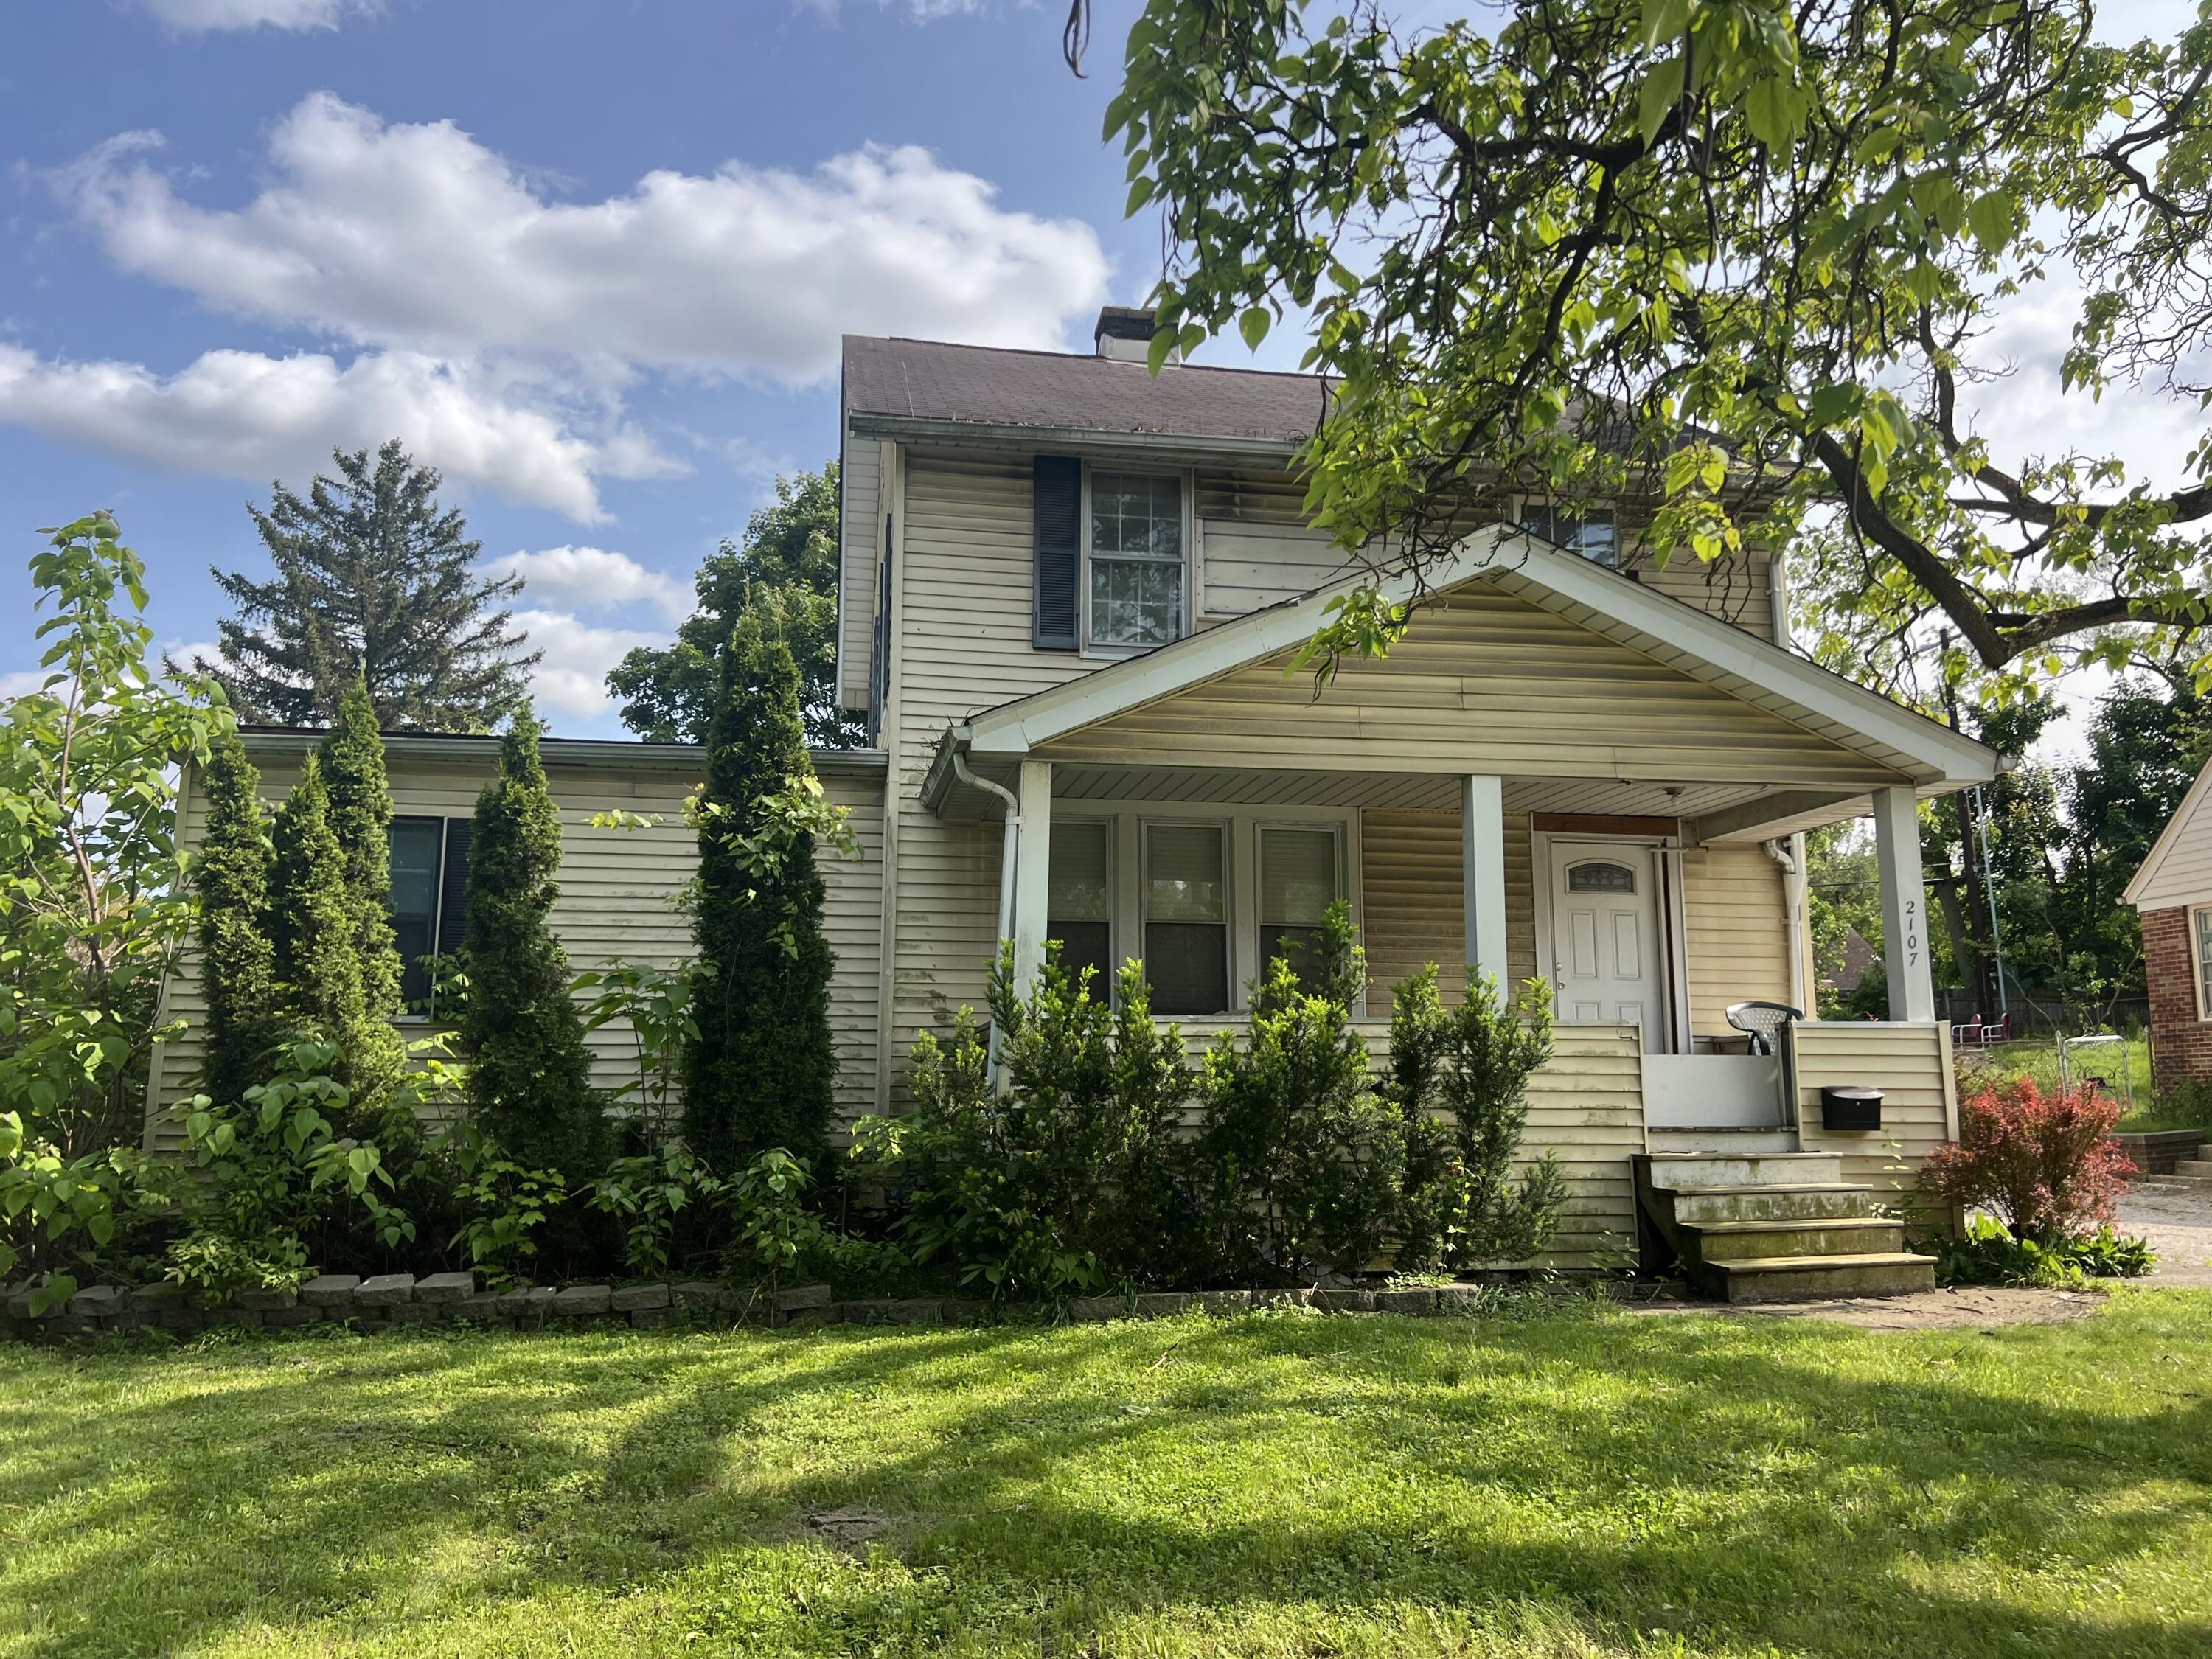
Active
$630,000
3
bds
|
2
ba
|
2,224
sqft
|
built
1968
1231 Naples Ct, Ann Arbor, MI 48103
$-1,930
Cash flow
-16.0%
Cash-on-Cash Return
2.6%
Cap rate
0.5%
Rent to Value Ratio
Active under contract
$1,095,000
4
bds
|
5
ba
|
5,579
sqft
|
built
1991
3113 Miller Rd, Ann Arbor, MI 48103
$-3,337
Cash flow
-15.9%
Cash-on-Cash Return
2.6%
Cap rate
0.5%
Rent to Value Ratio
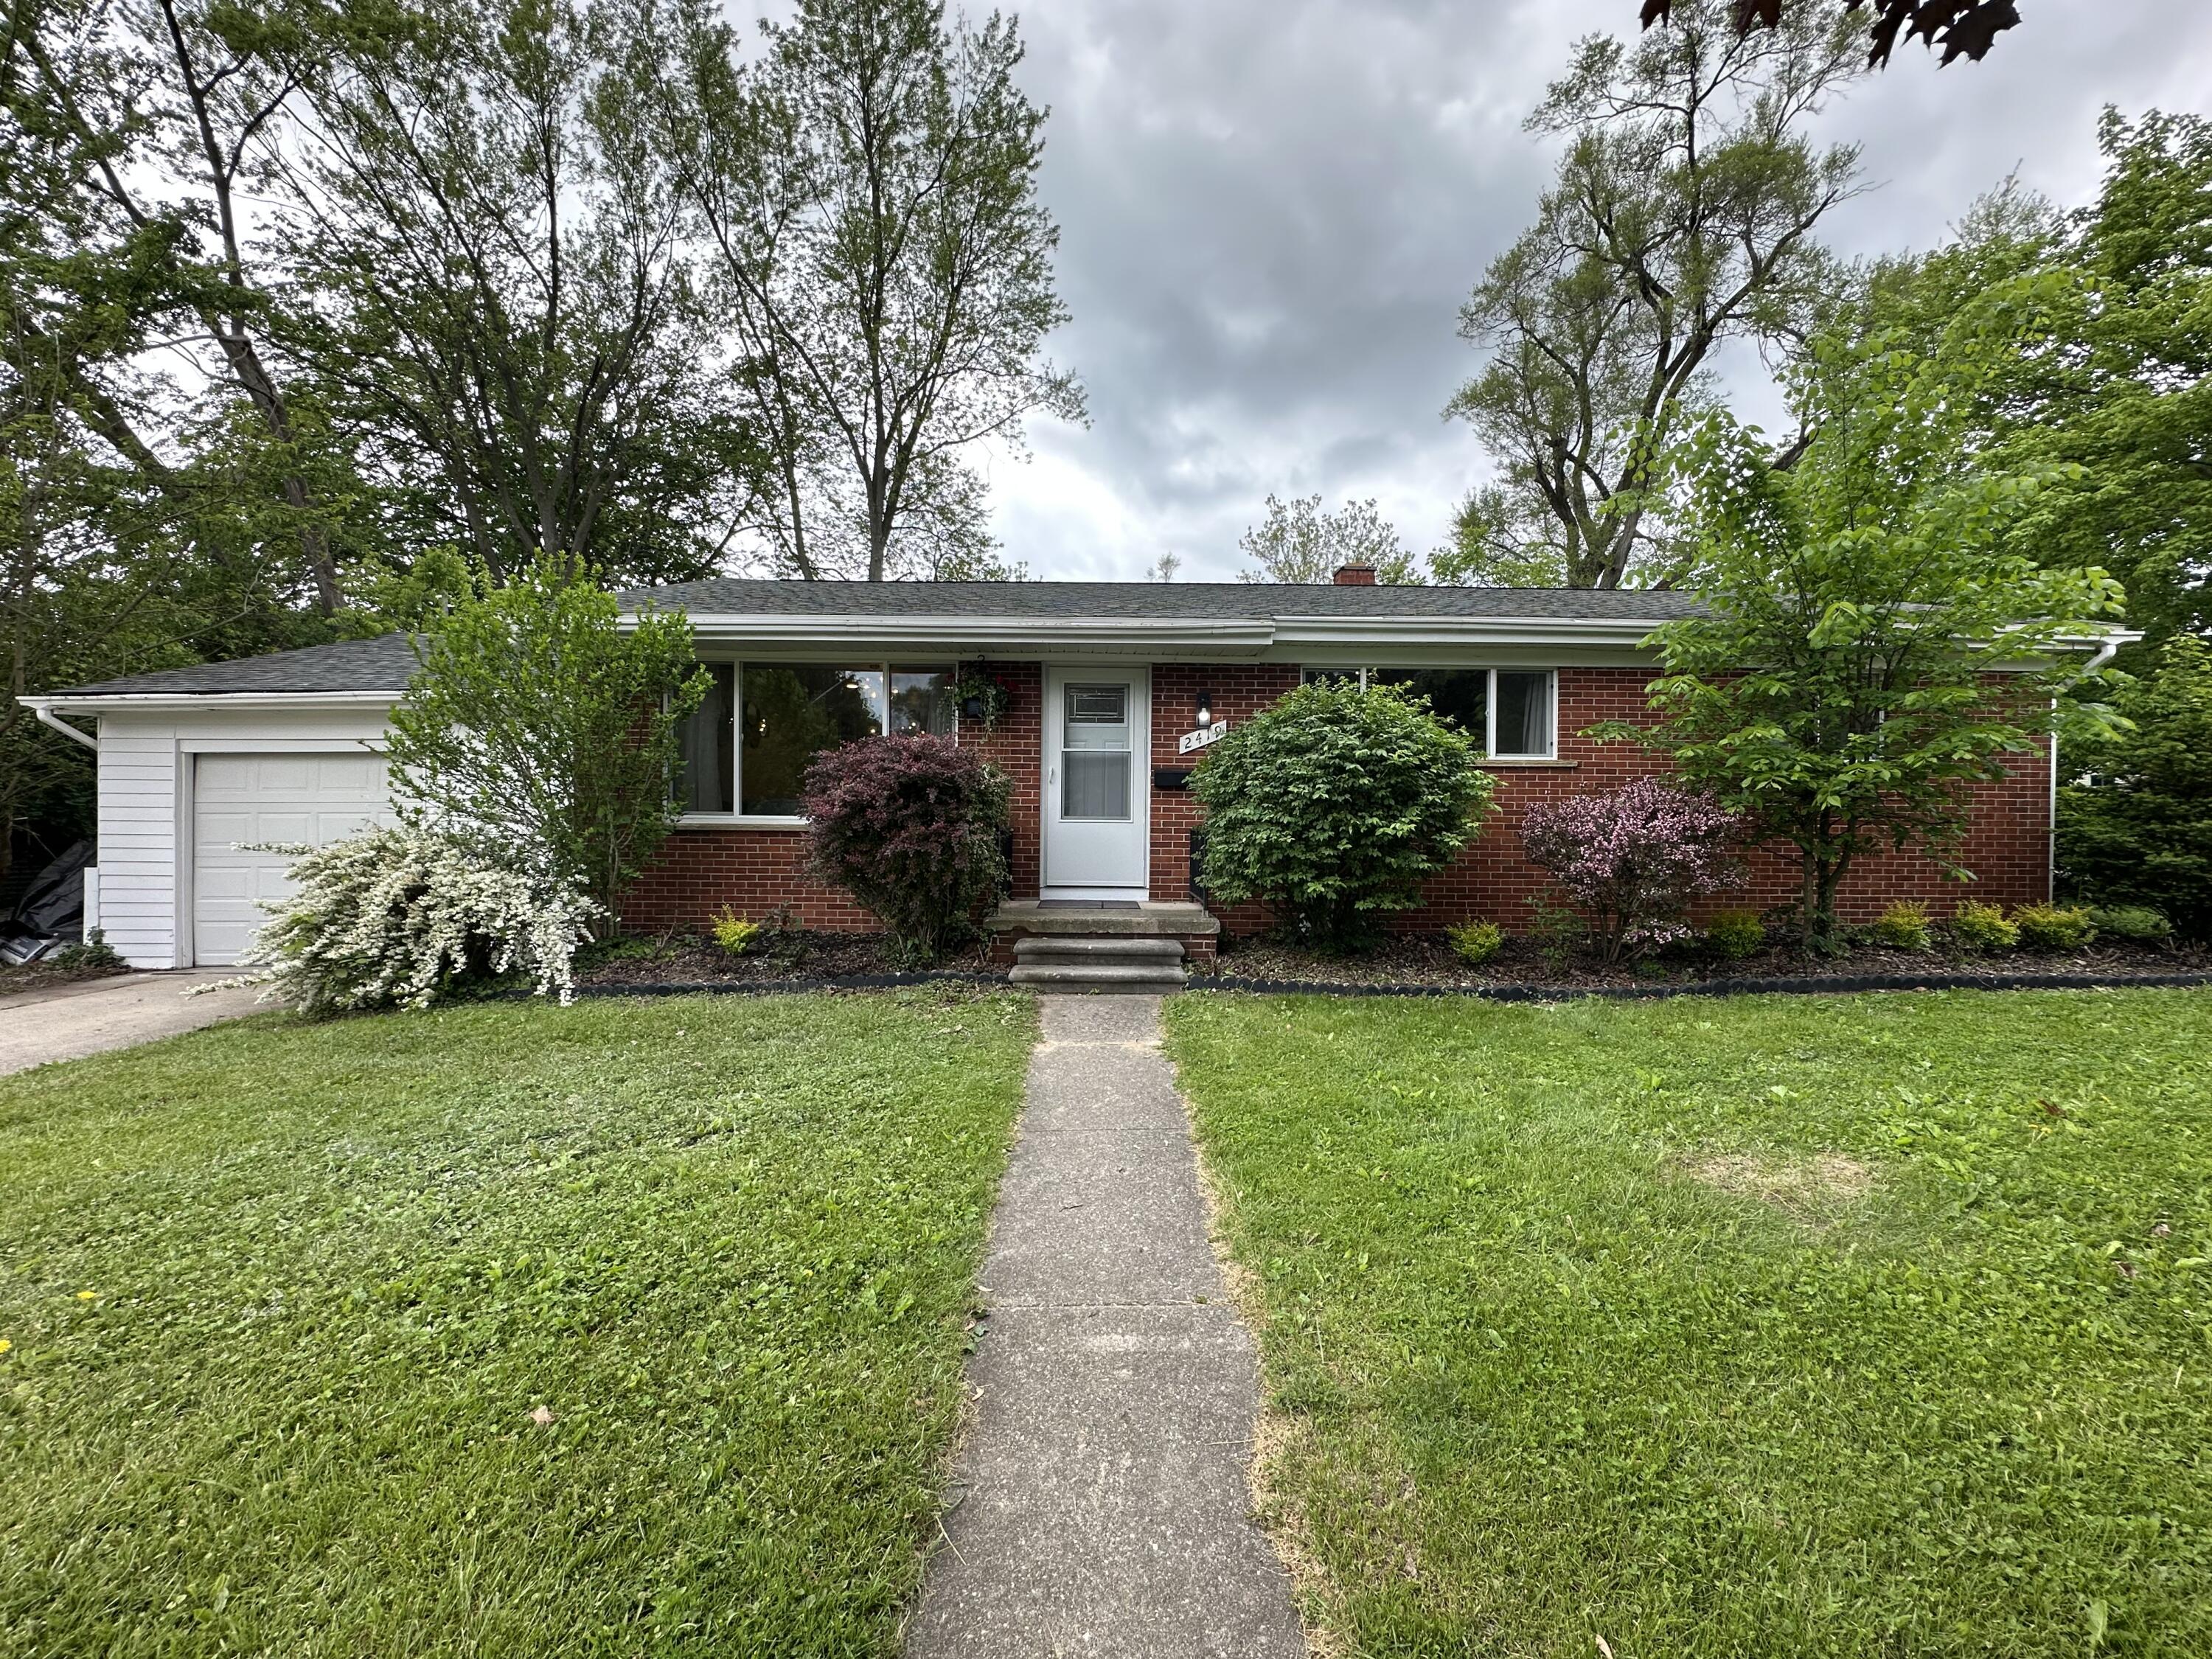
Active under contract
$427,000
3
bds
|
3
ba
|
1,125
sqft
|
built
1957
2419 Faye Dr, Ann Arbor, MI 48103
$-1,050
Cash flow
-12.8%
Cash-on-Cash Return
3.3%
Cap rate
0.5%
Rent to Value Ratio
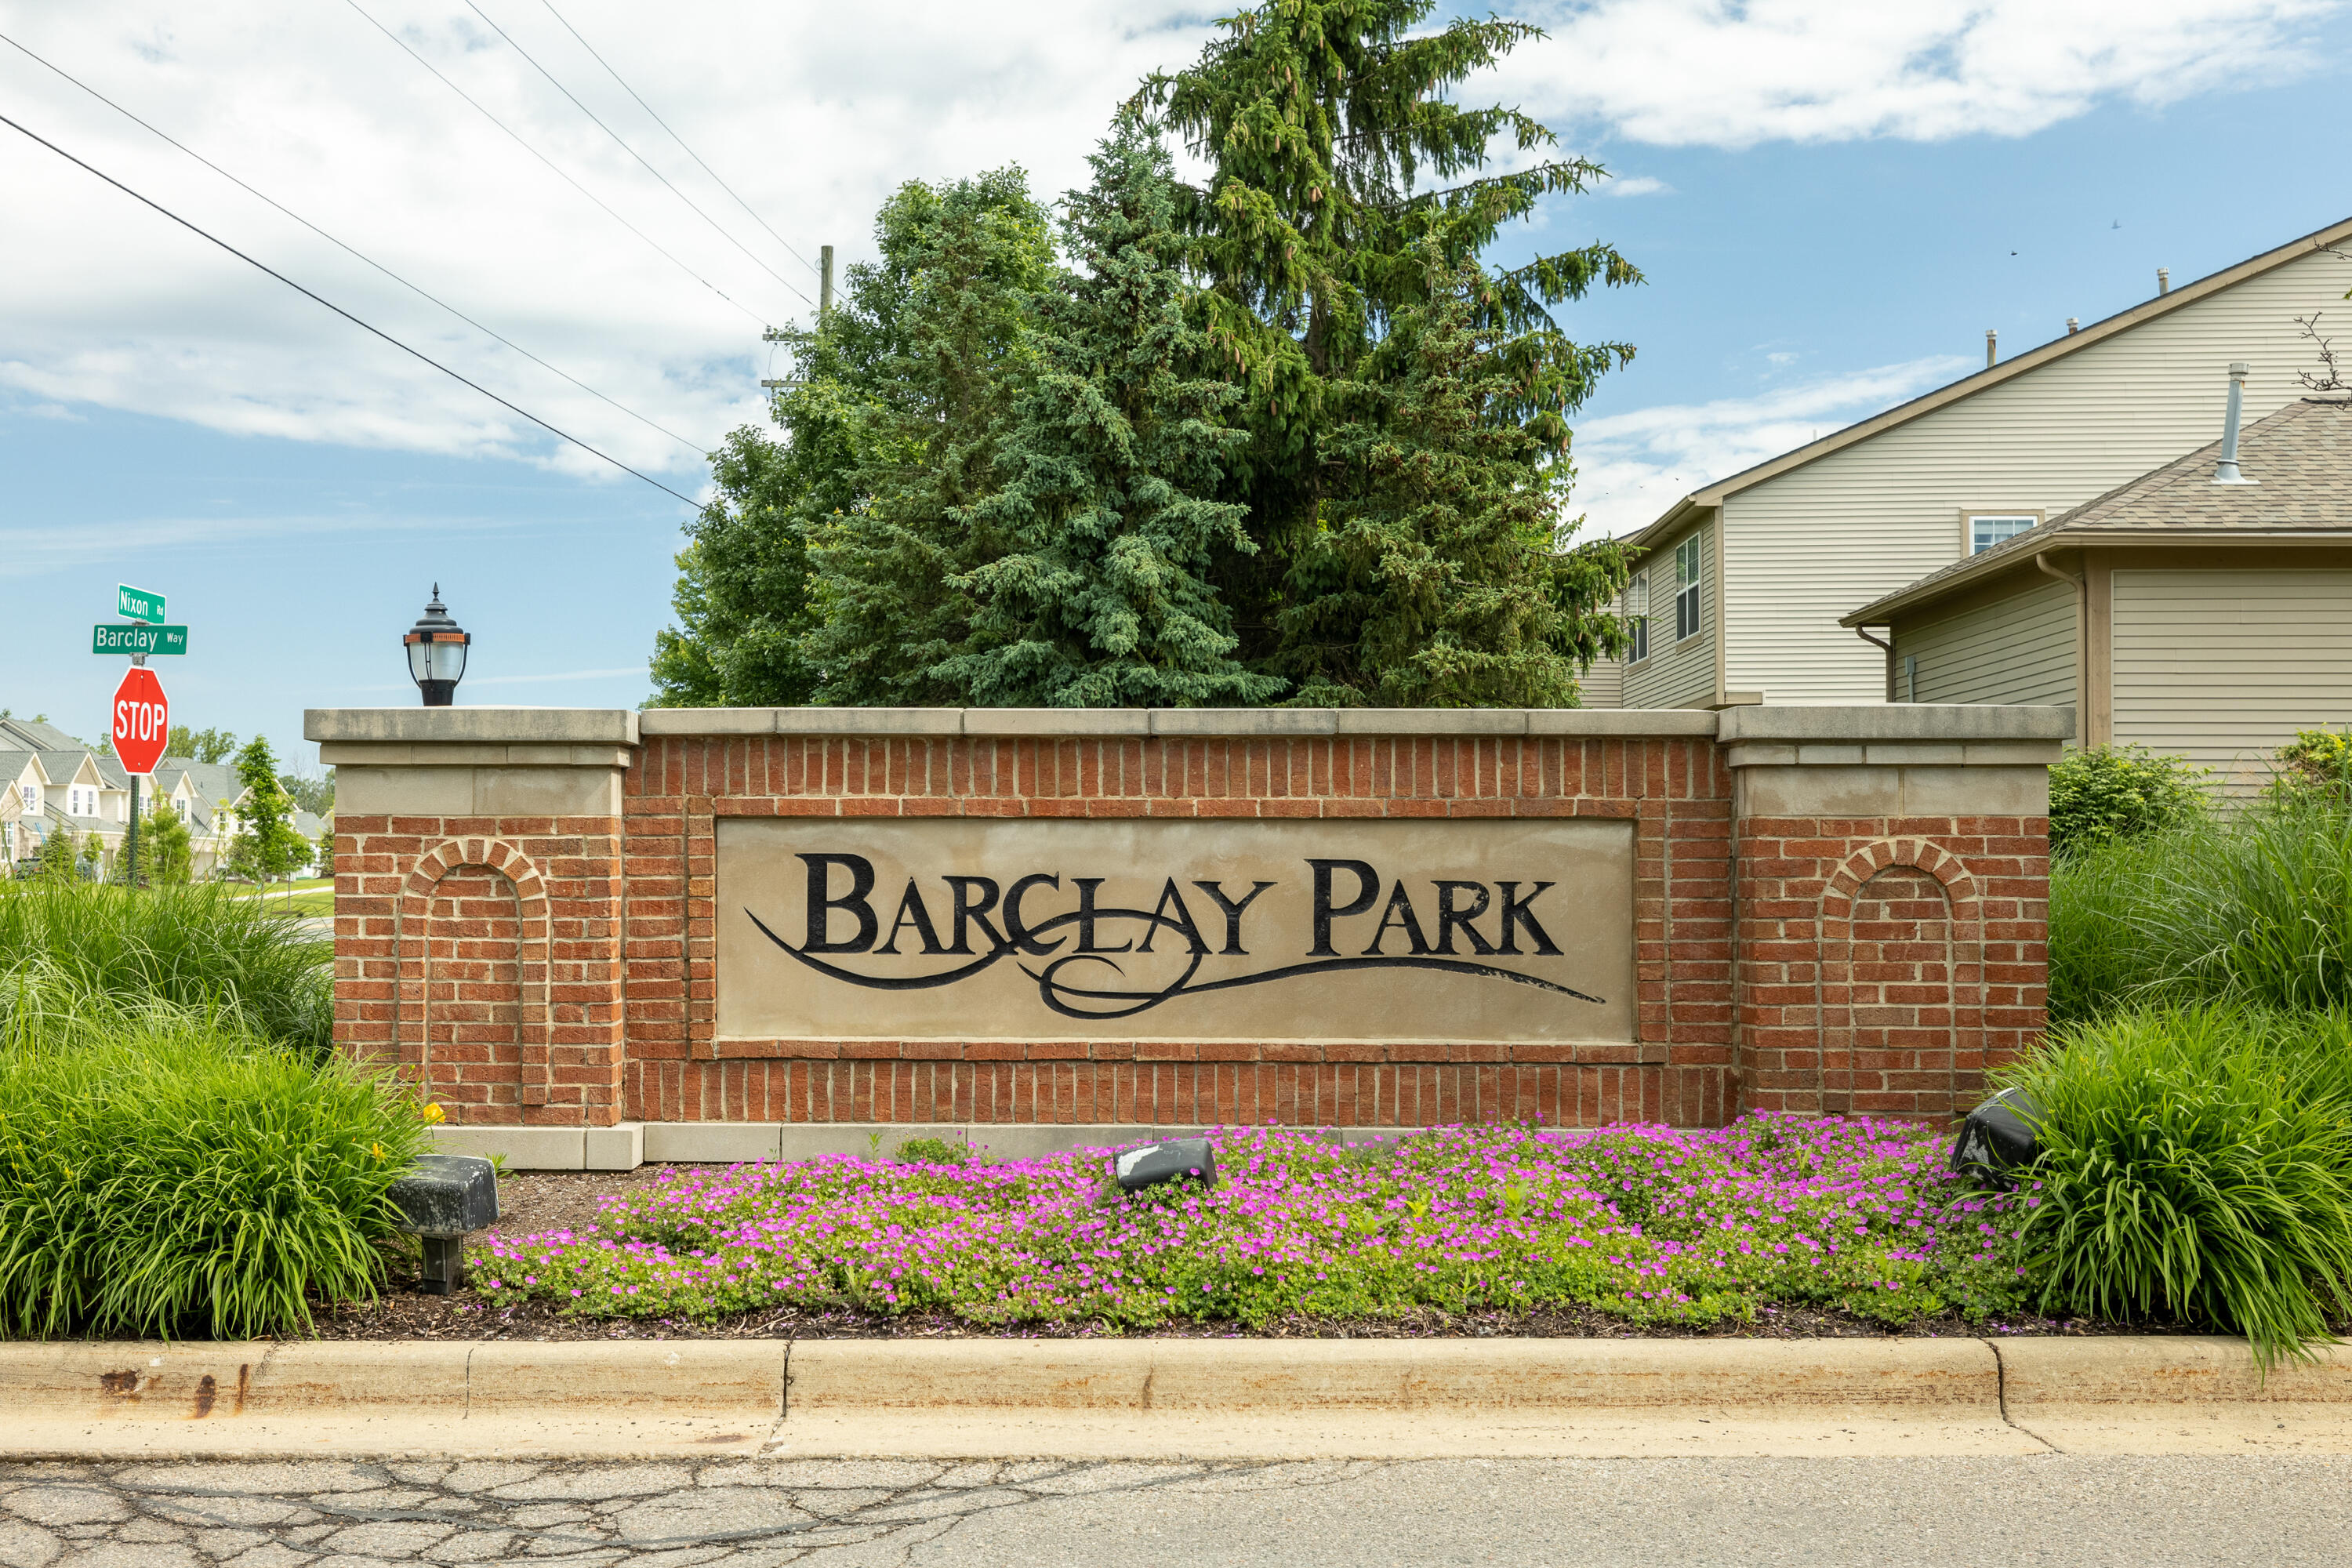
Active
$379,000
3
bds
|
3
ba
|
1,416
sqft
|
built
2001
3039 Barclay Way, Ann Arbor, MI 48105
$-1,144
Cash flow
-15.7%
Cash-on-Cash Return
2.7%
Cap rate
0.7%
Rent to Value Ratio

Active under contract
$895,000
3
bds
|
3
ba
|
2,066
sqft
|
built
1927
1015 Lincoln Ave, Ann Arbor, MI 48104
$-3,160
Cash flow
-18.4%
Cash-on-Cash Return
2.0%
Cap rate
0.4%
Rent to Value Ratio

Active
$1,015,000
2
bds
|
2
ba
|
1,385
sqft
|
built
2017
211 W Kingsley St, Ann Arbor, MI 48103
$-4,077
Cash flow
-21.0%
Cash-on-Cash Return
1.5%
Cap rate
0.5%
Rent to Value Ratio
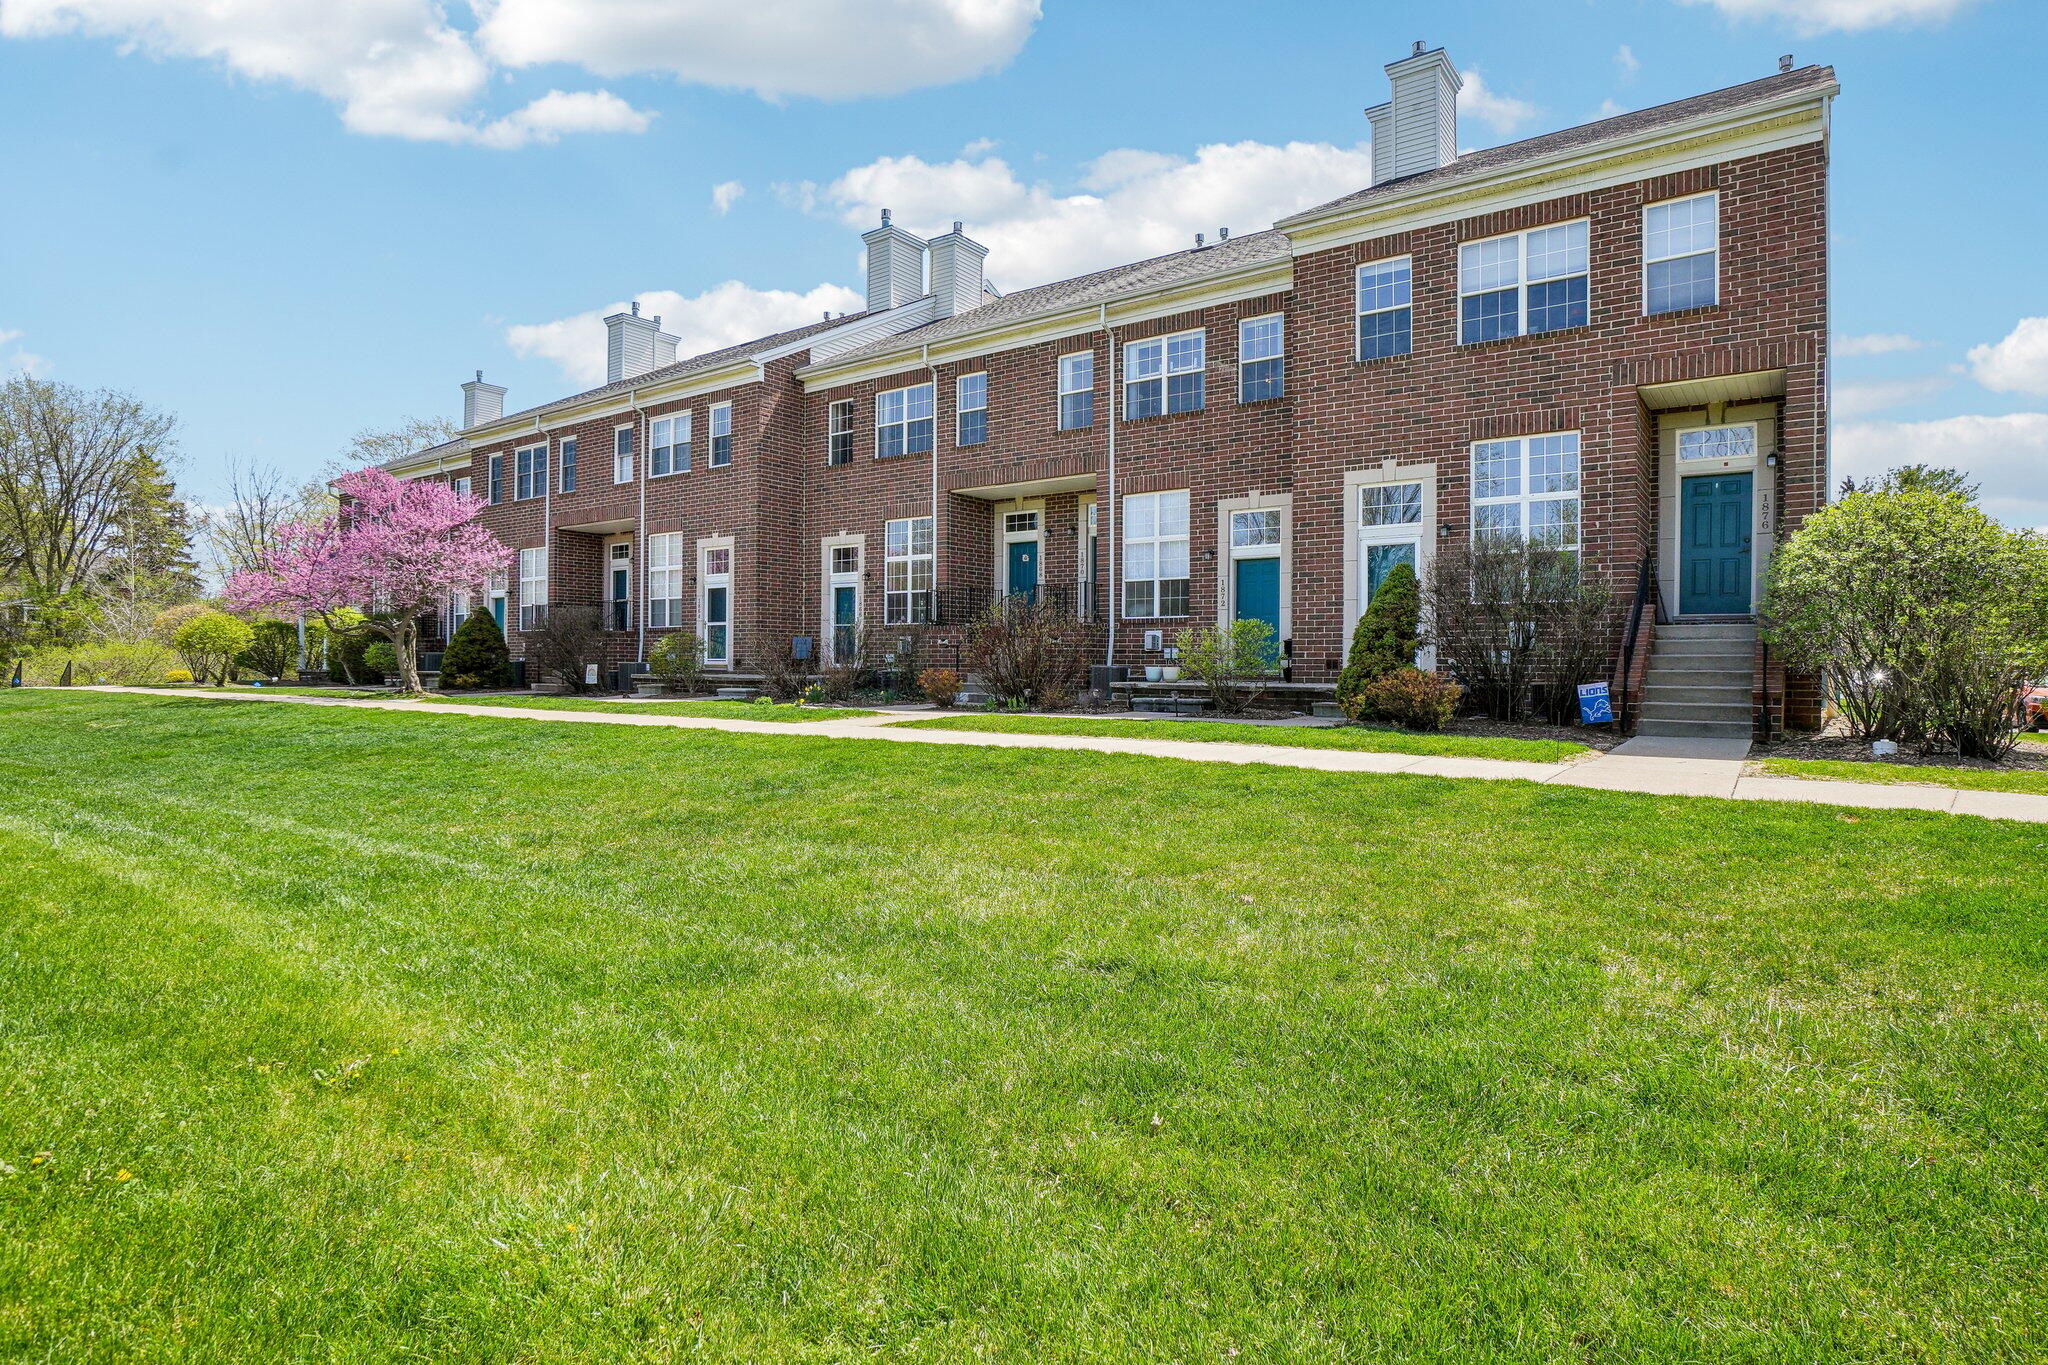
Pending
$359,900
2
bds
|
3
ba
|
1,500
sqft
|
built
1992
2545 Country Village Ct, Ann Arbor, MI 48103
$-1,204
Cash flow
-17.5%
Cash-on-Cash Return
2.3%
Cap rate
0.7%
Rent to Value Ratio
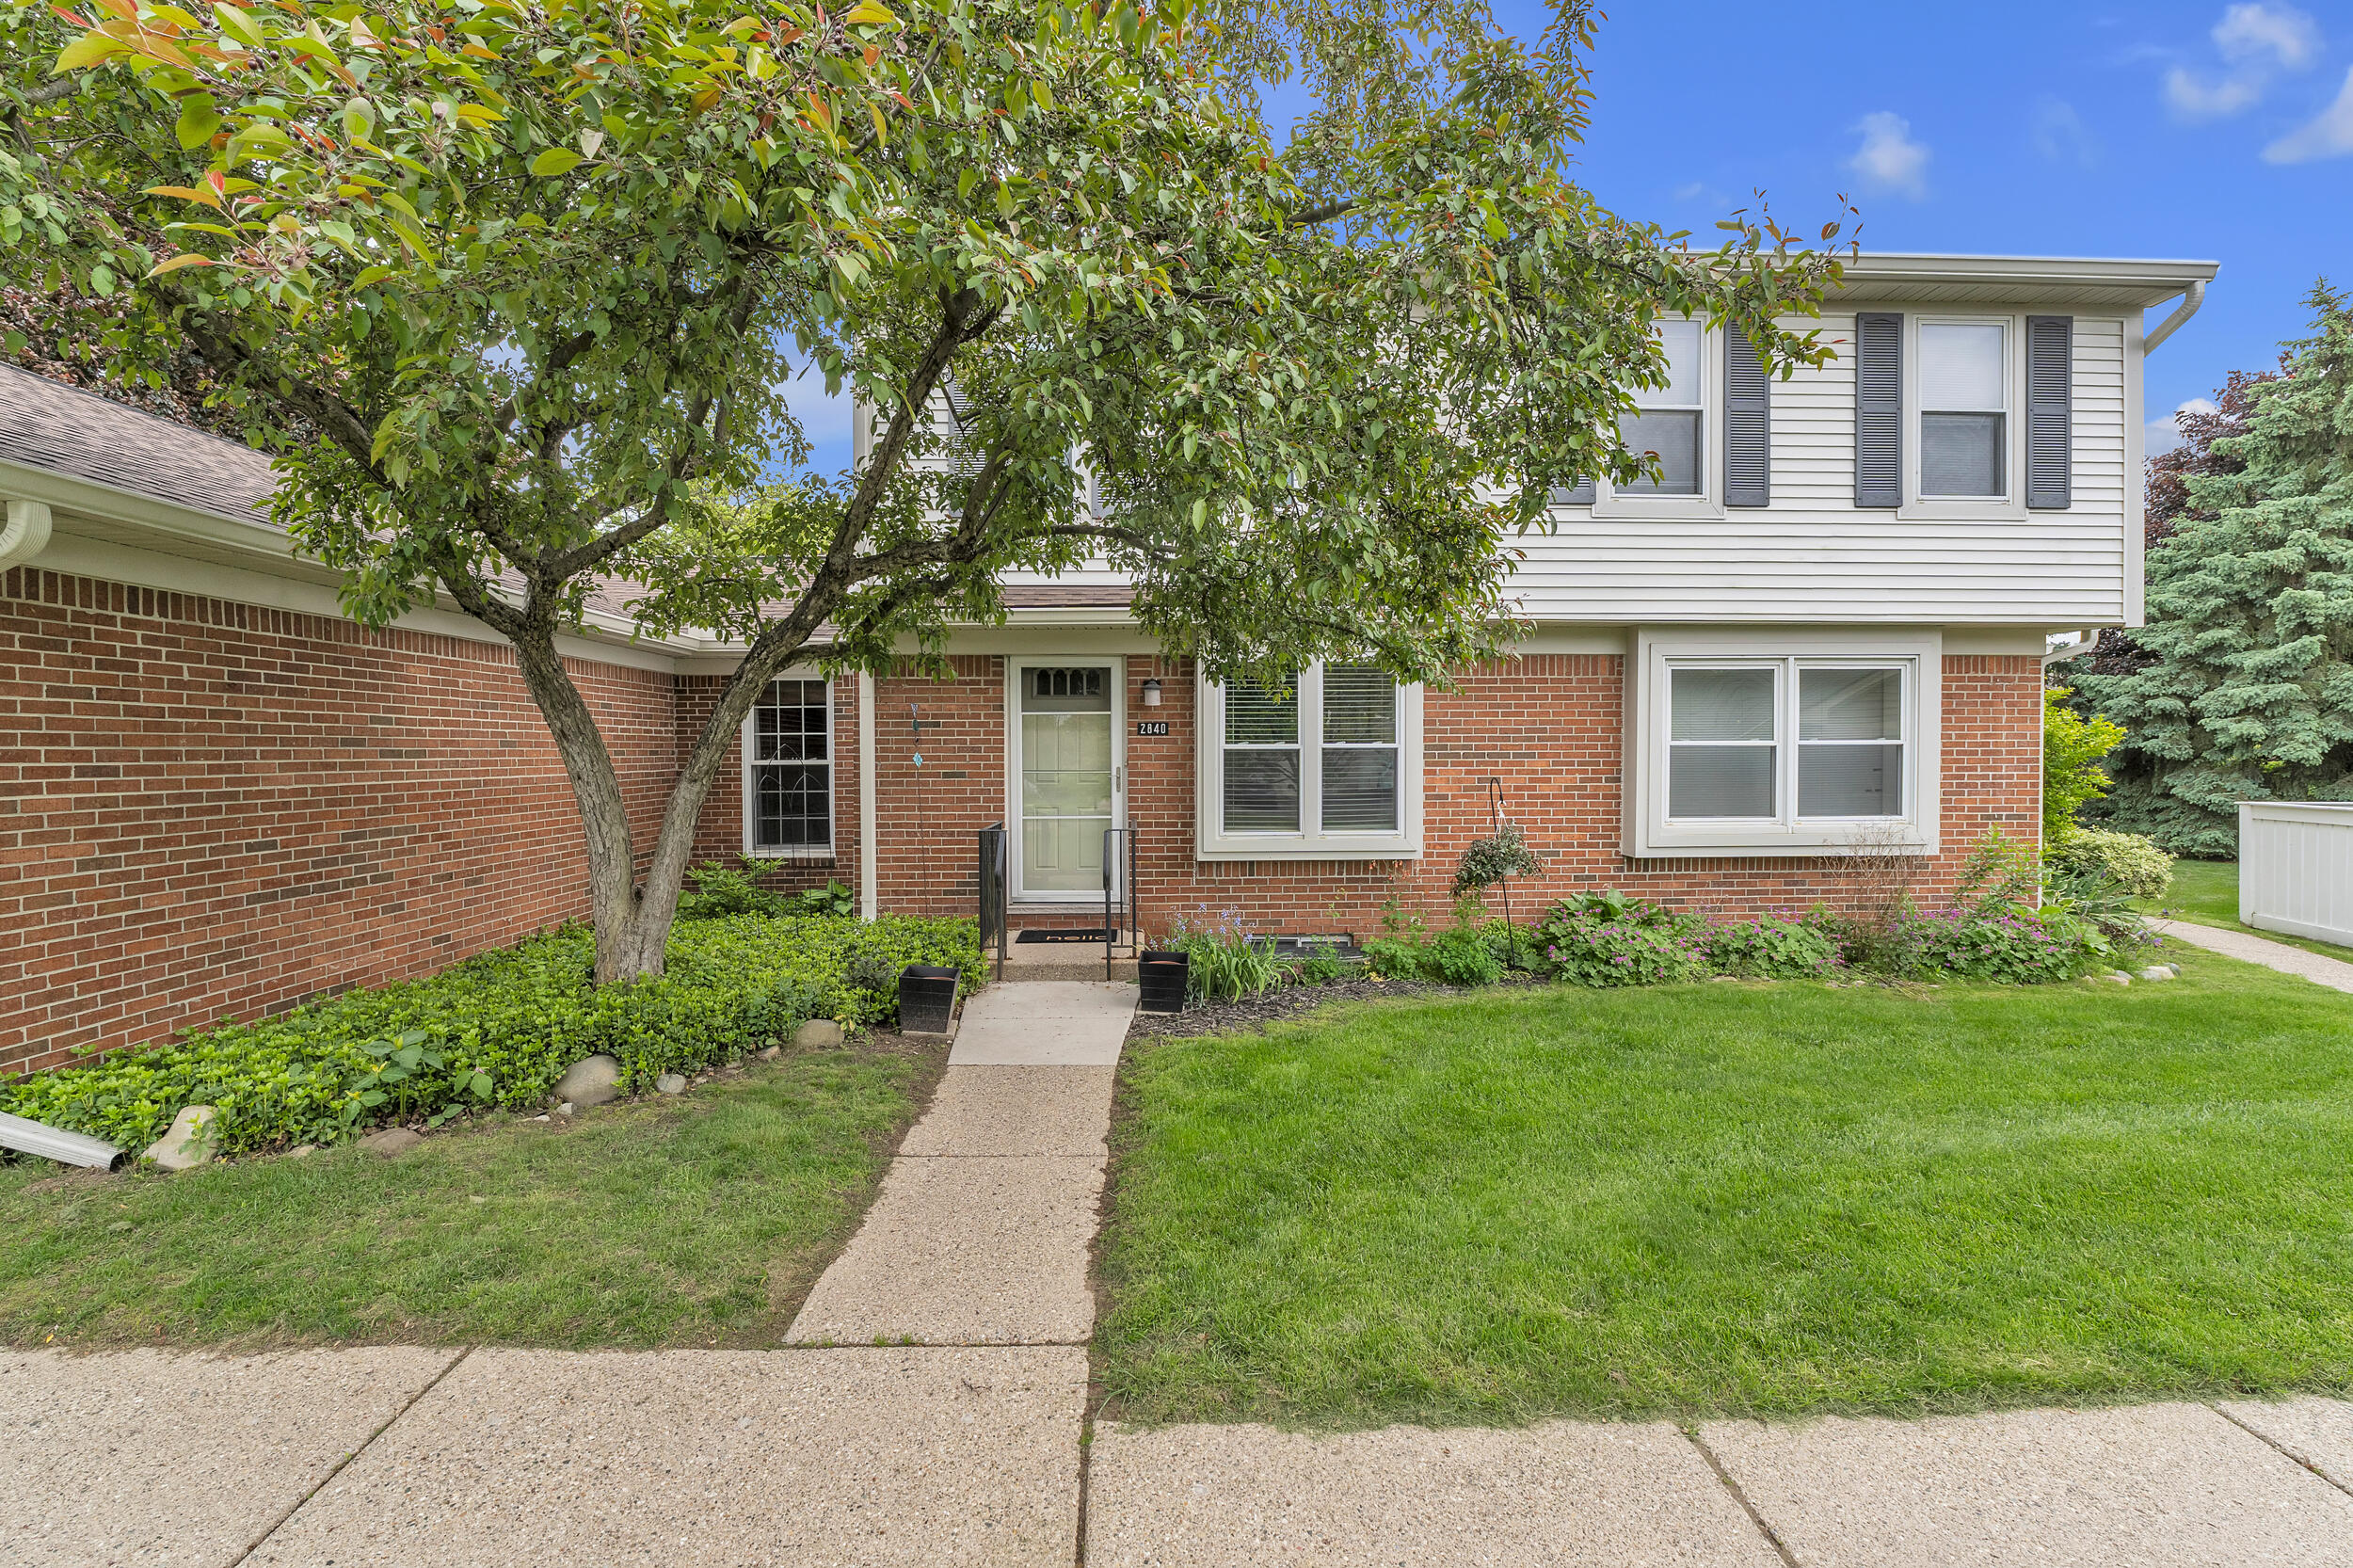
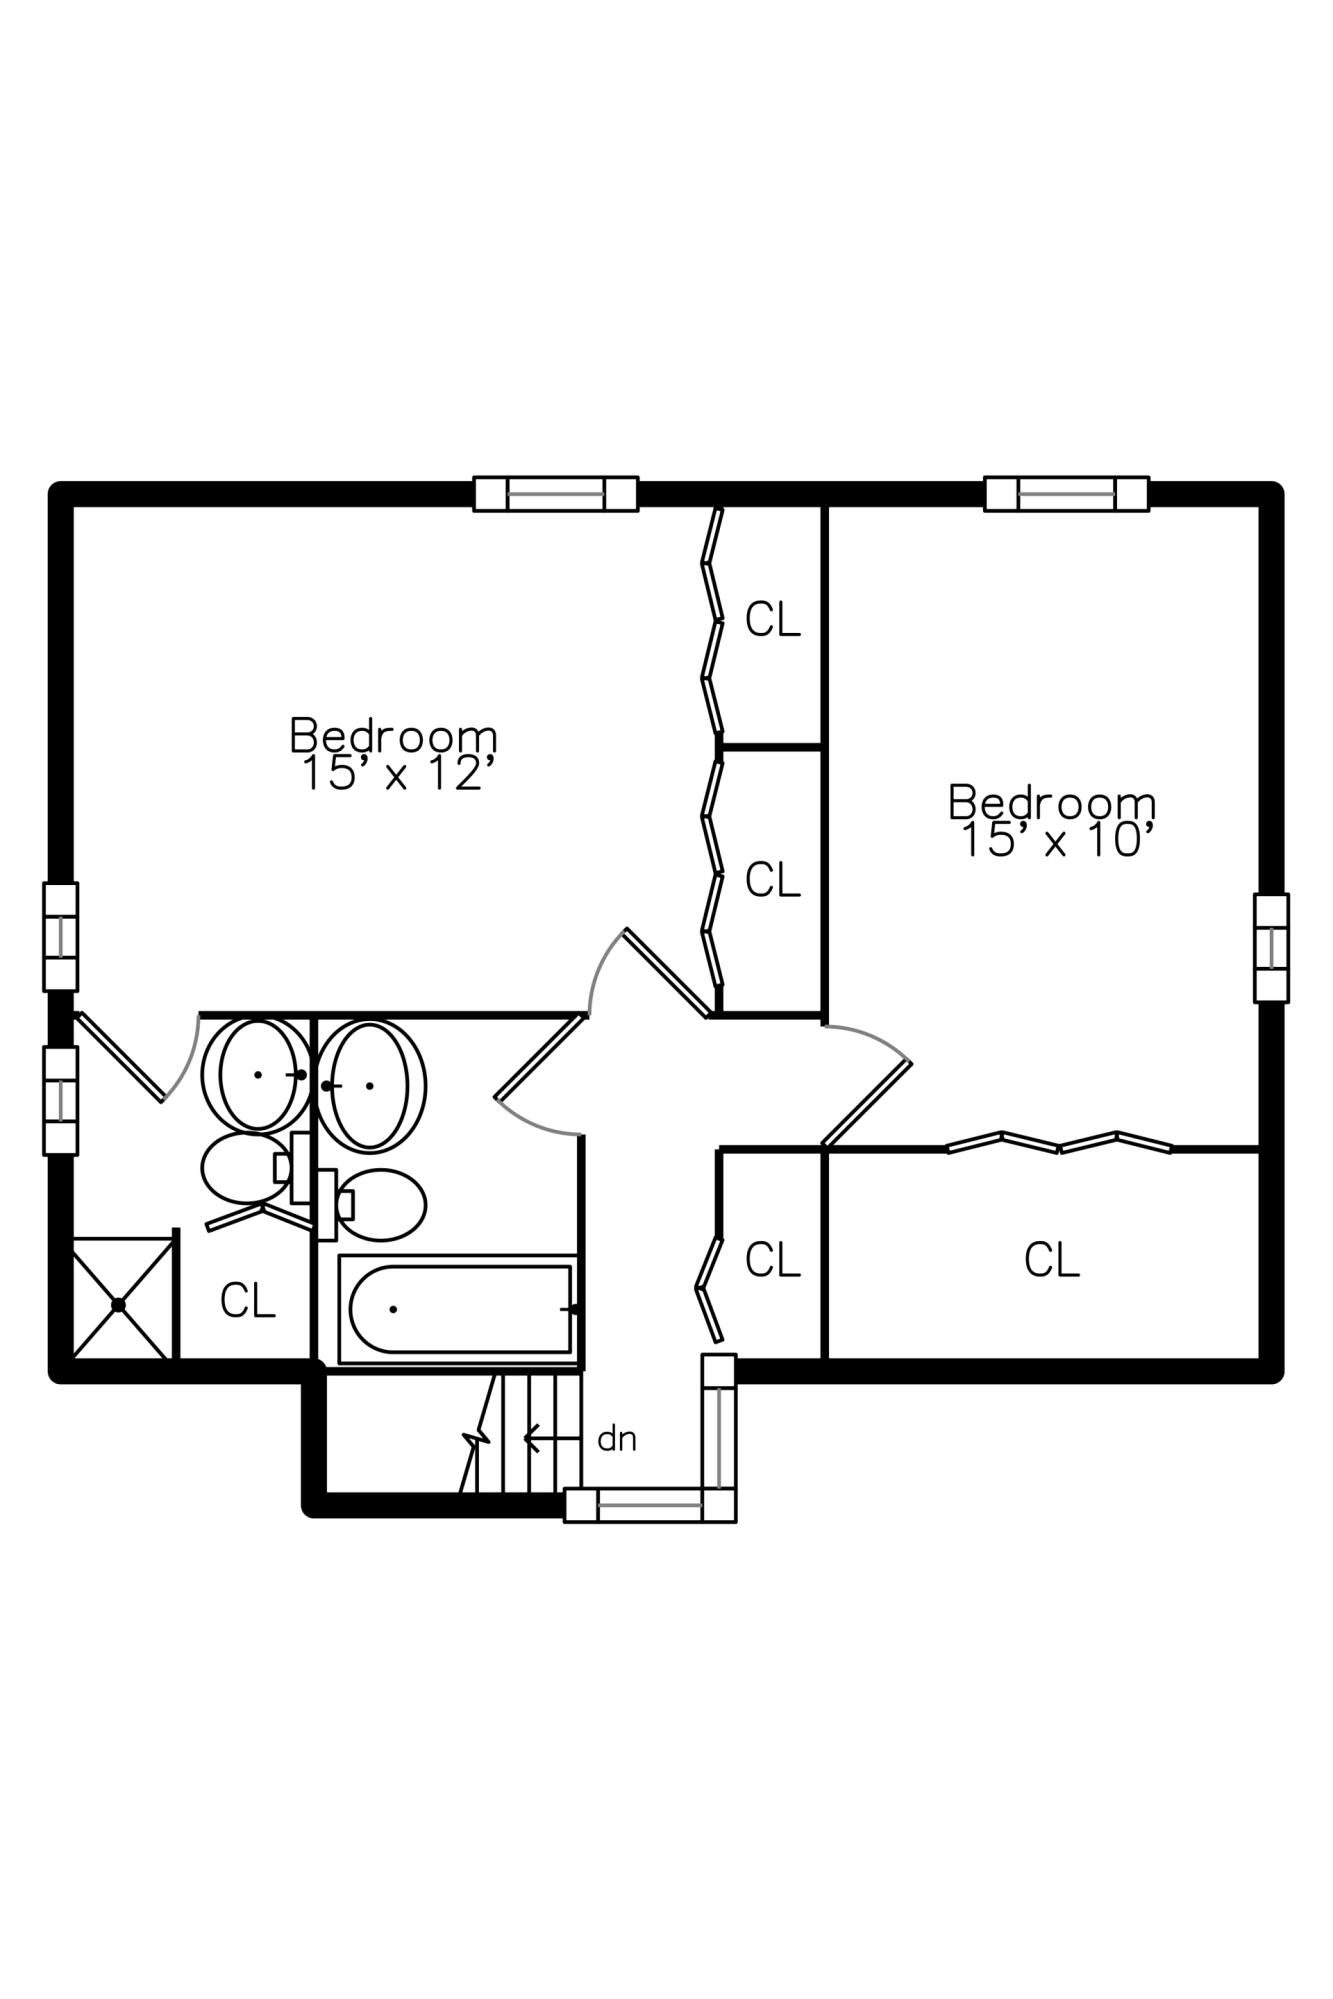
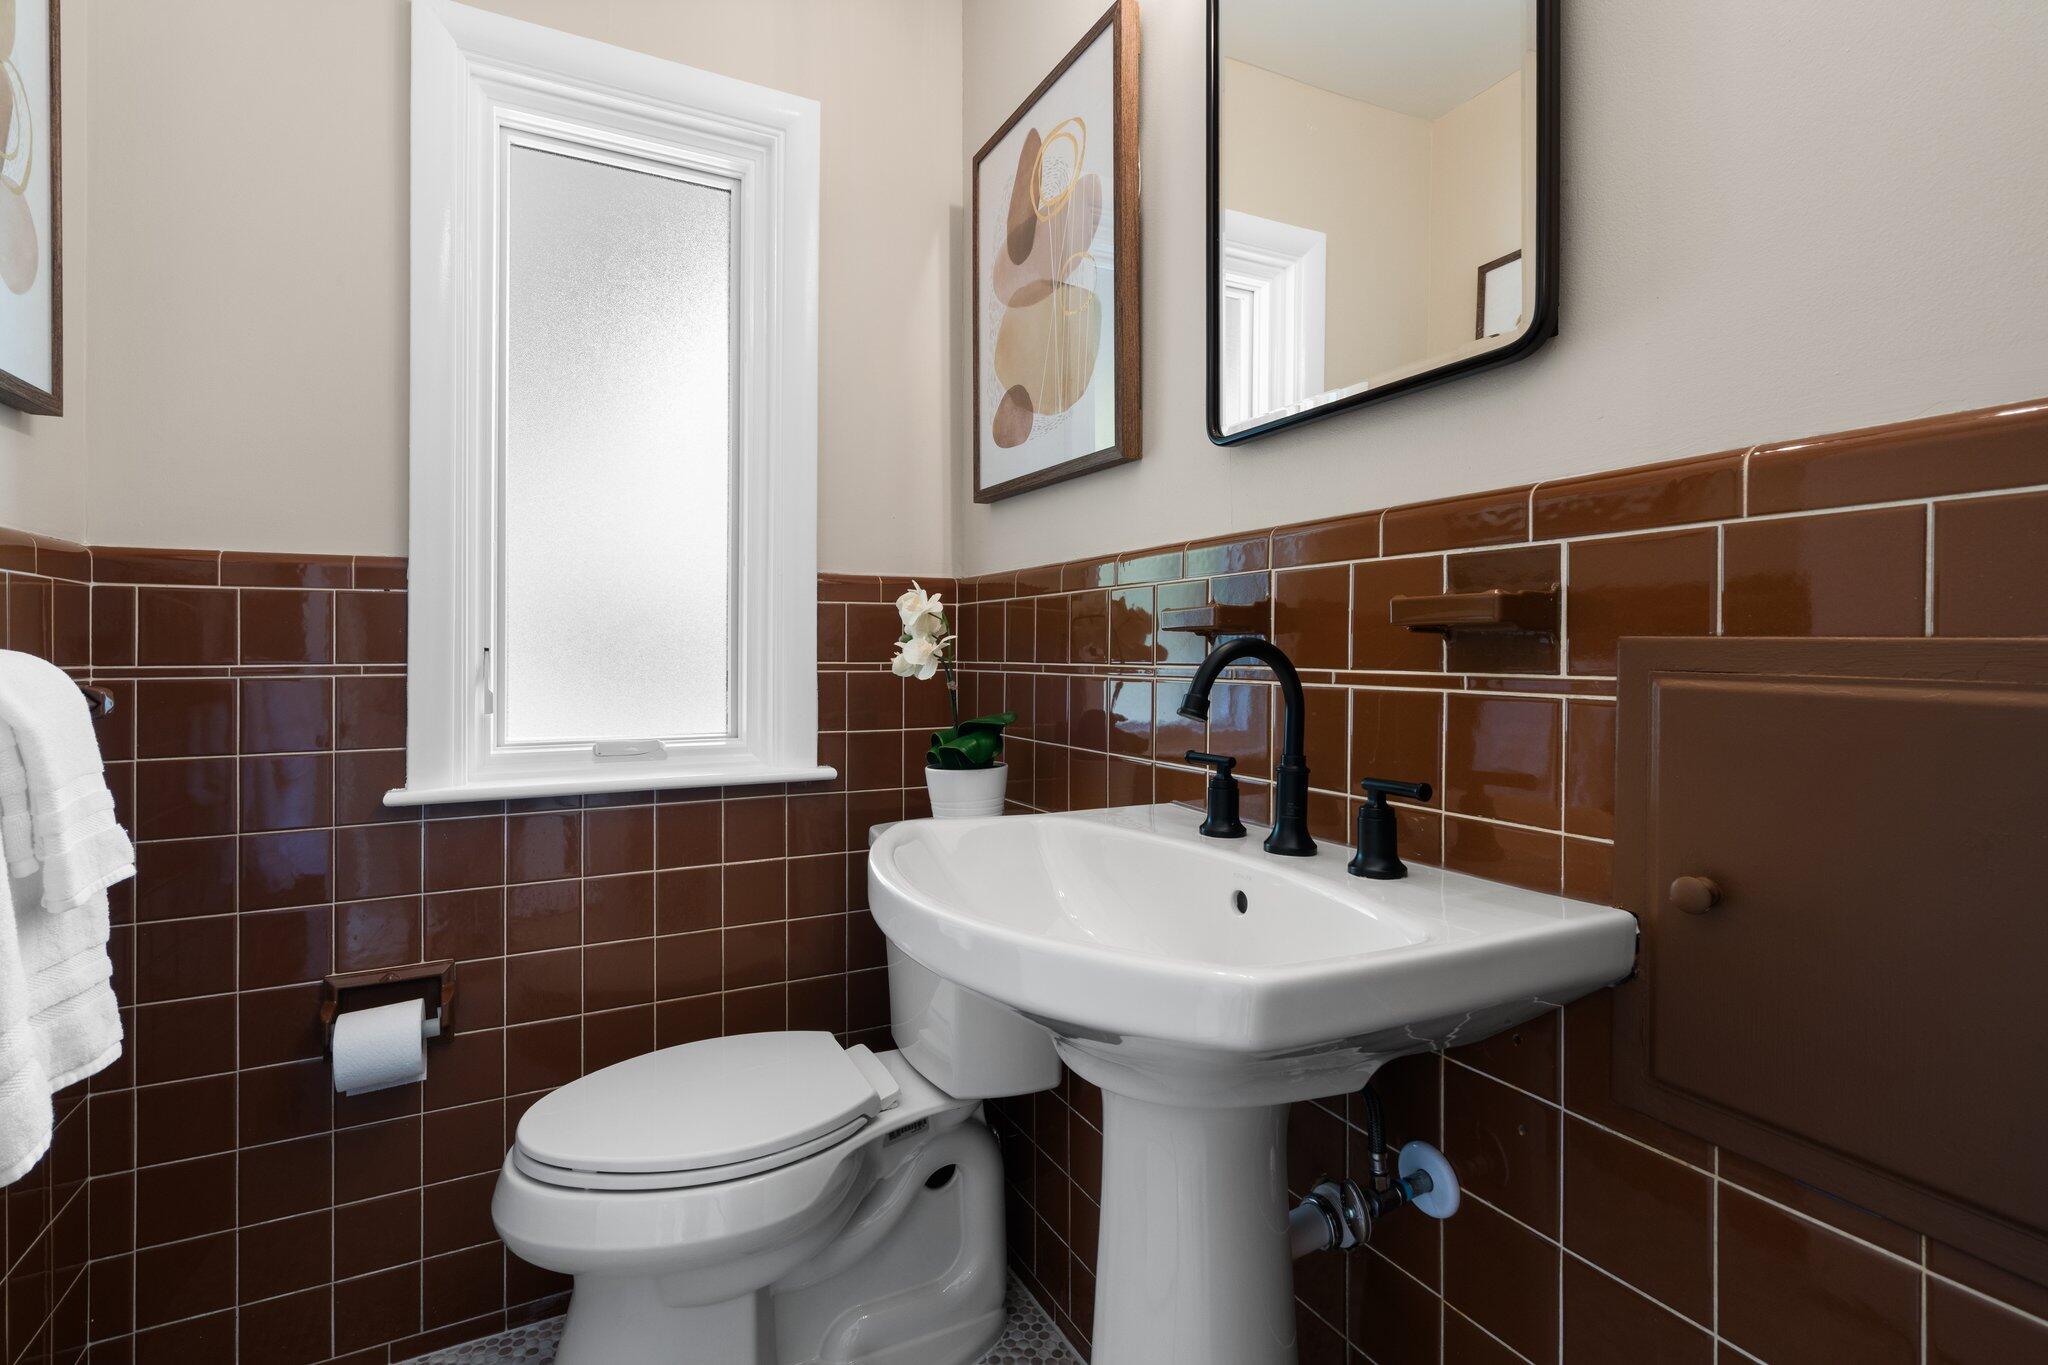
Active
$289,000
2
bds
|
2
ba
|
880
sqft
|
built
1977
2840 Bombridge Ct, Ann Arbor, MI 48104
$-892
Cash flow
-16.1%
Cash-on-Cash Return
2.6%
Cap rate
0.6%
Rent to Value Ratio
Active
$1,275,000
4
bds
|
4
ba
|
2,612
sqft
|
built
1950
2316 Brockman Blvd, Ann Arbor, MI 48104
$-5,786
Cash flow
-23.7%
Cash-on-Cash Return
0.8%
Cap rate
0.3%
Rent to Value Ratio
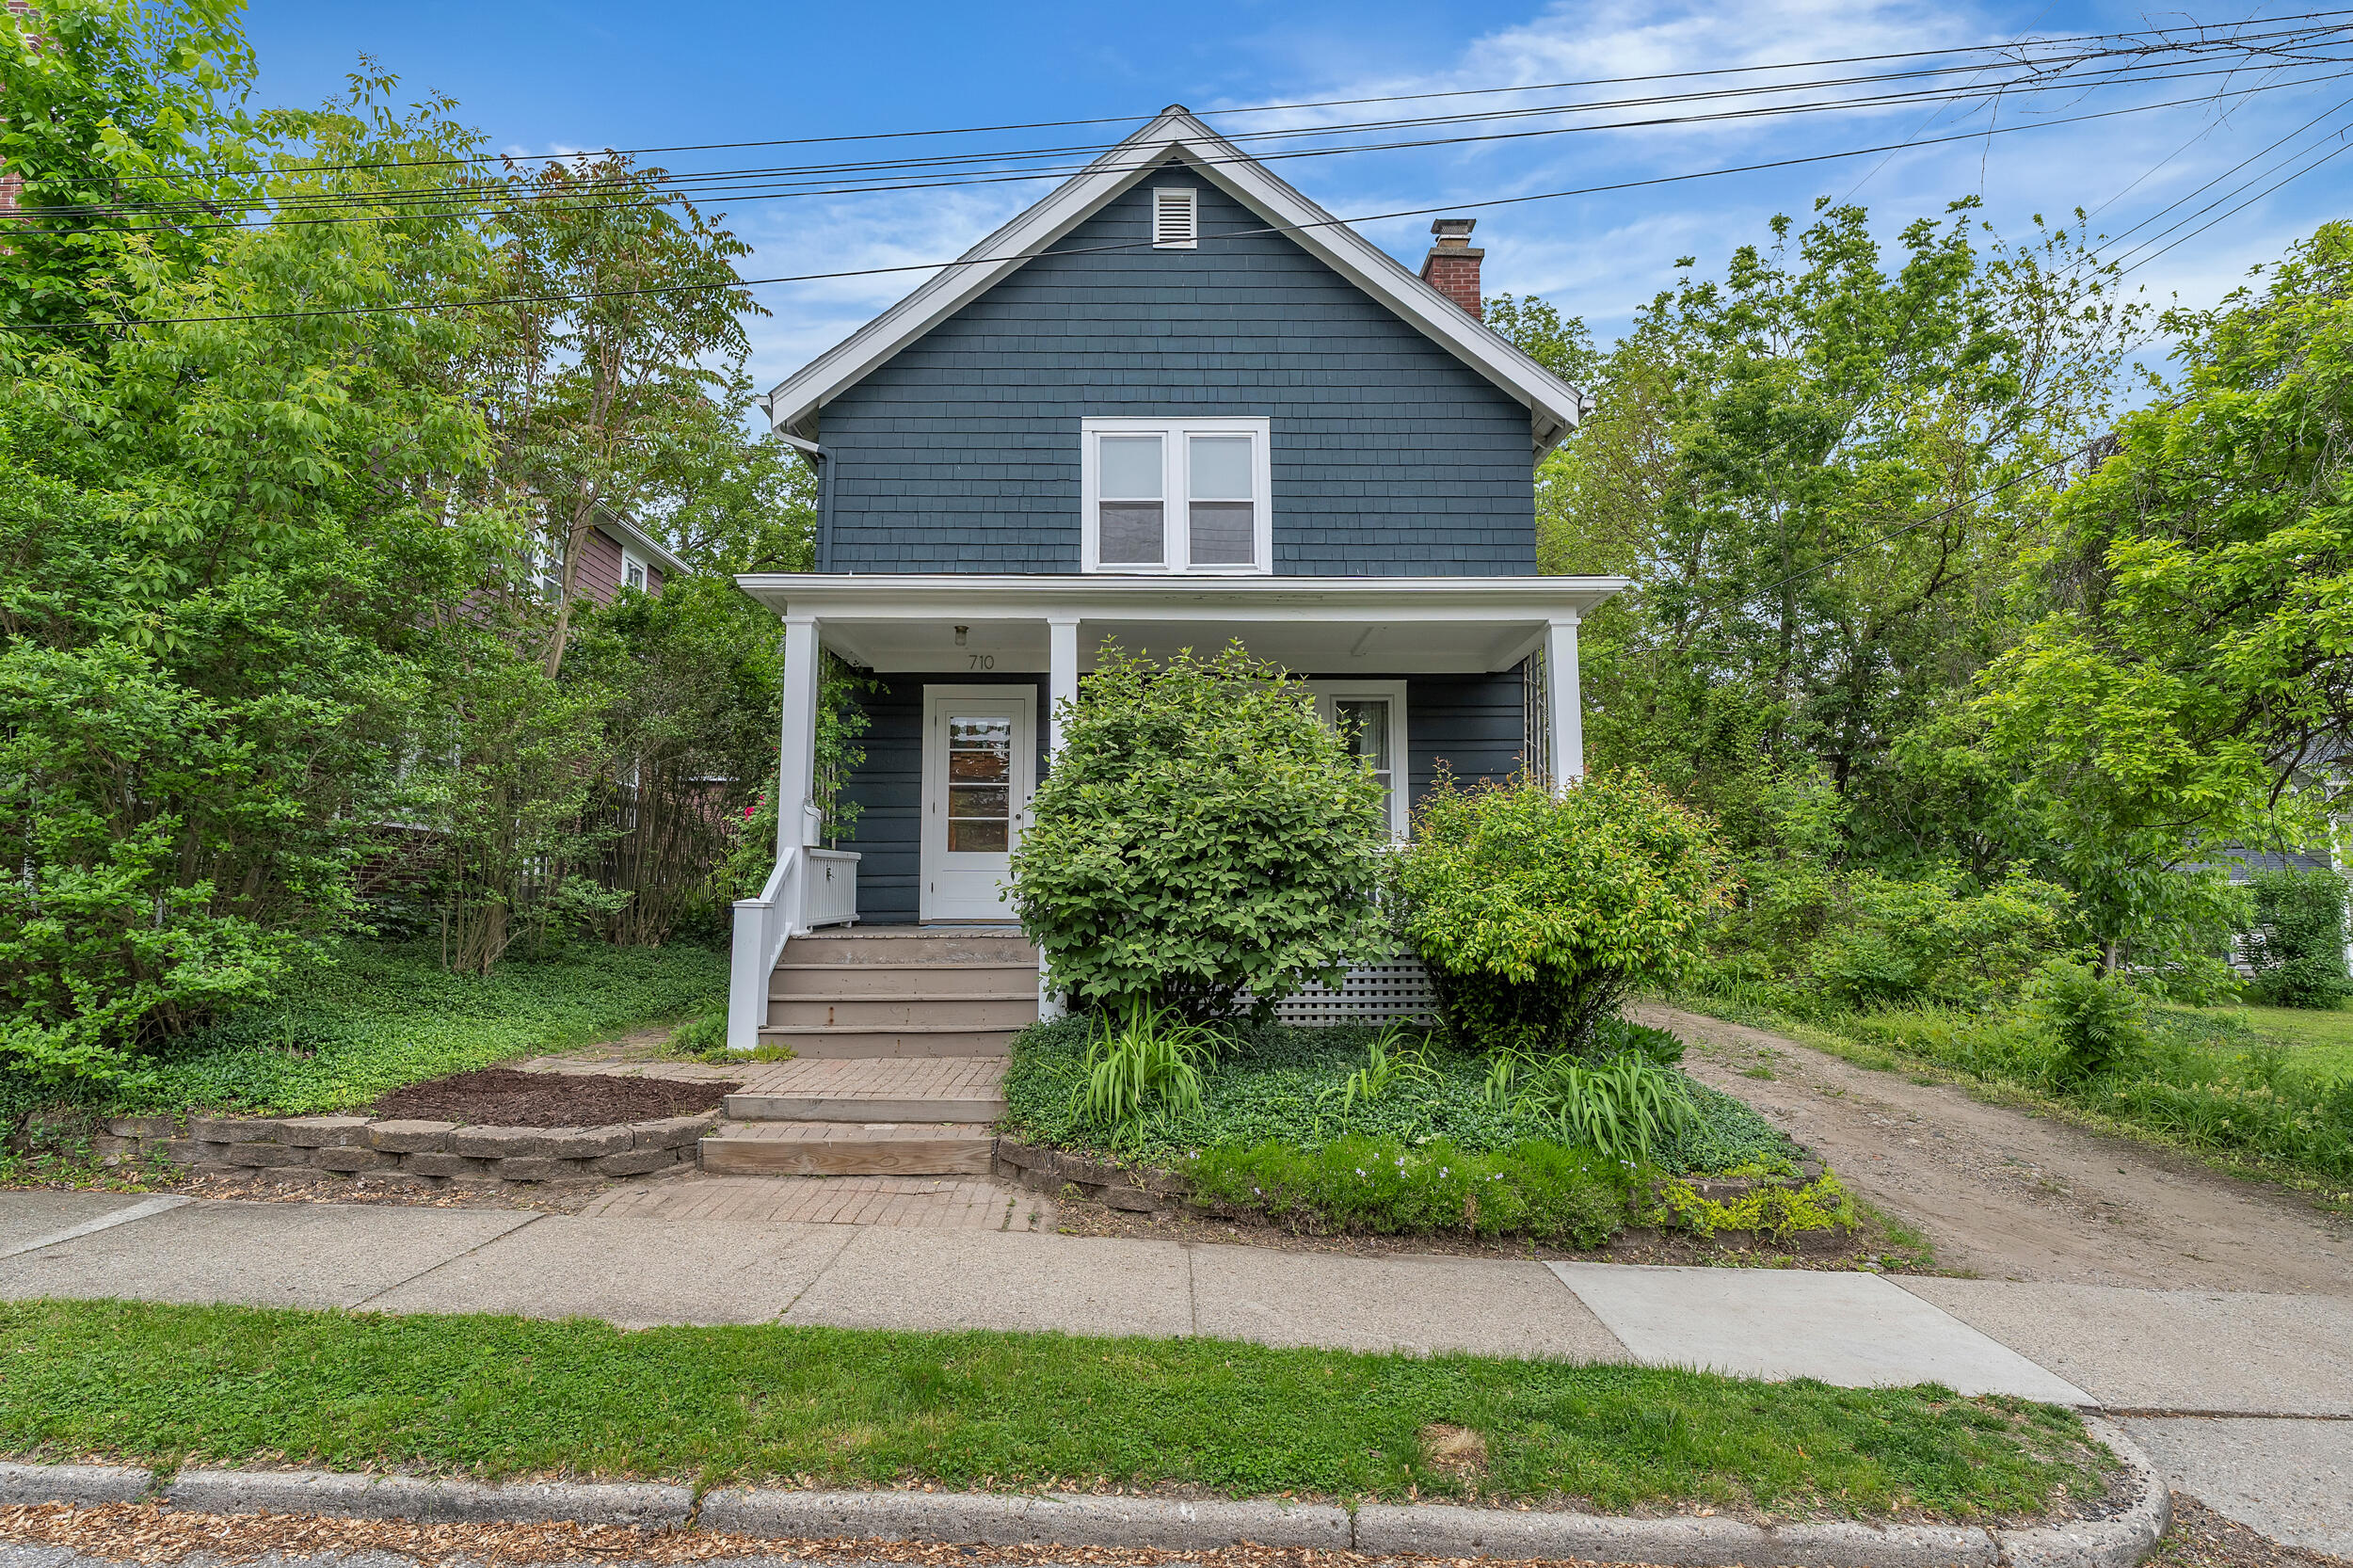
Active
$499,900
2
bds
|
1
ba
|
1,144
sqft
|
built
1922
710 S 1st St, Ann Arbor, MI 48103
$-1,419
Cash flow
-14.8%
Cash-on-Cash Return
2.9%
Cap rate
0.6%
Rent to Value Ratio
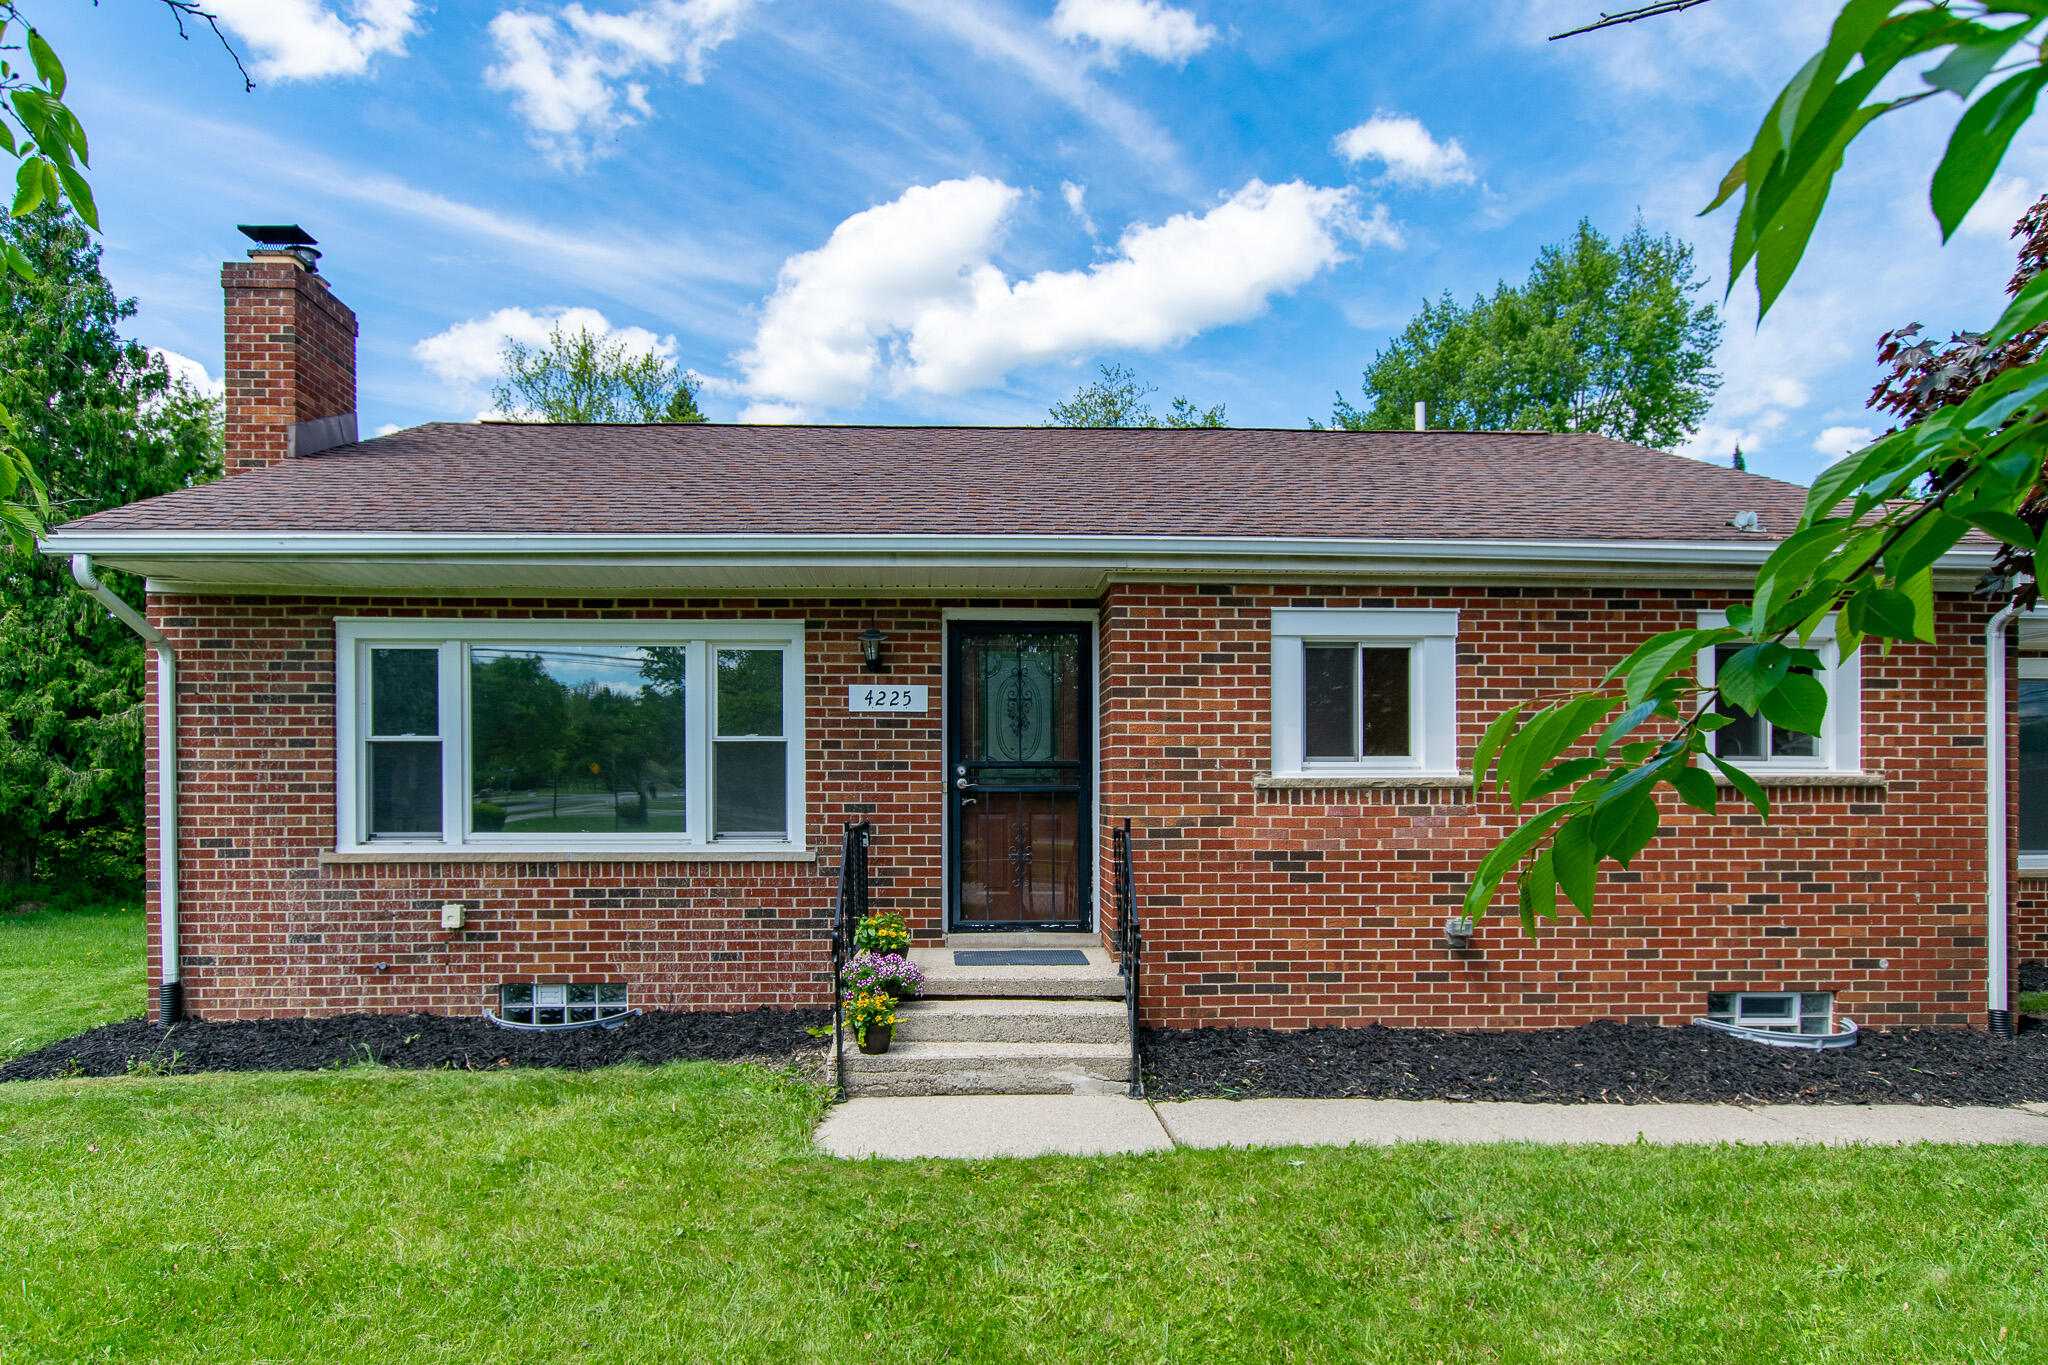
Active
$389,900
3
bds
|
2
ba
|
1,416
sqft
|
built
1958
4225 Central Blvd, Ann Arbor, MI 48108
$-934
Cash flow
-12.5%
Cash-on-Cash Return
3.4%
Cap rate
0.6%
Rent to Value Ratio
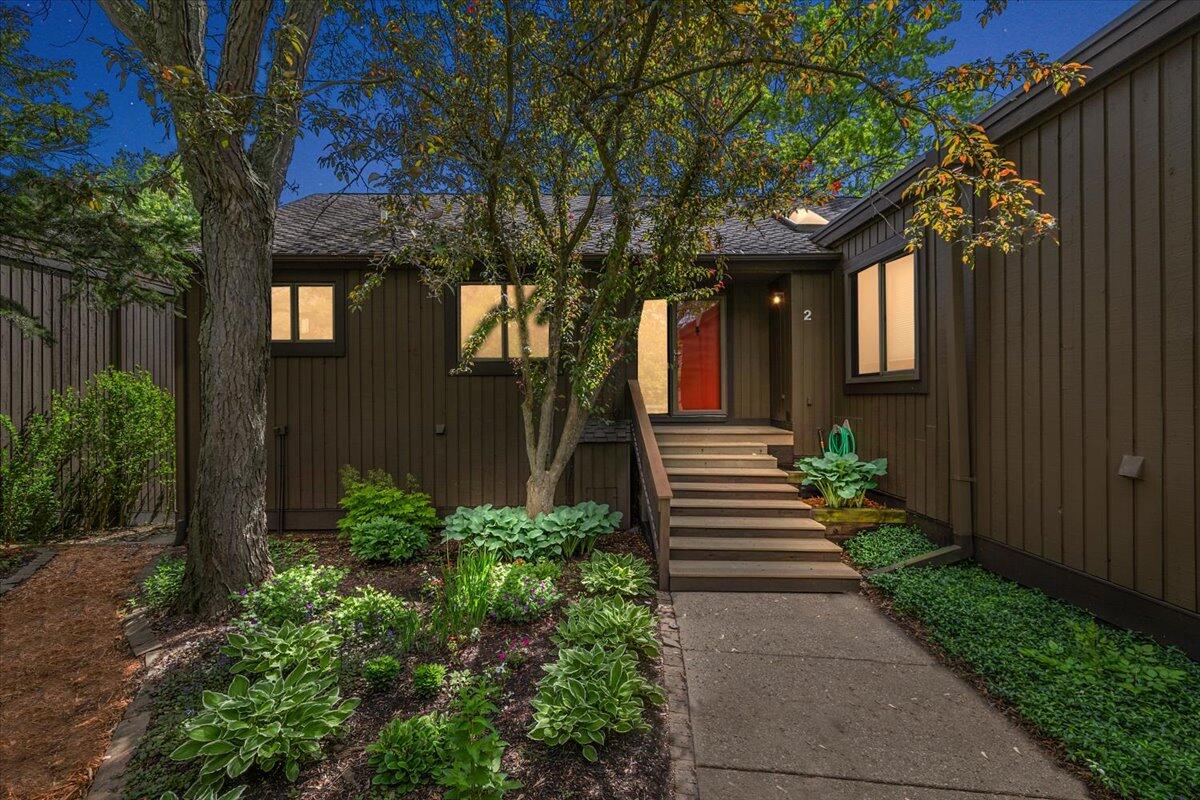
Active
$500,000
4
bds
|
3
ba
|
3,100
sqft
|
built
1980
2 Eastbury Ct, Ann Arbor, MI 48105
$-1,850
Cash flow
-19.3%
Cash-on-Cash Return
1.8%
Cap rate
0.6%
Rent to Value Ratio