Maricopa County Investment Properties for Sale
Browse homes for sale and investment properties in Maricopa County. Refine your search by price, property type, or more.
Best cash flowing properties in Maricopa County
Active
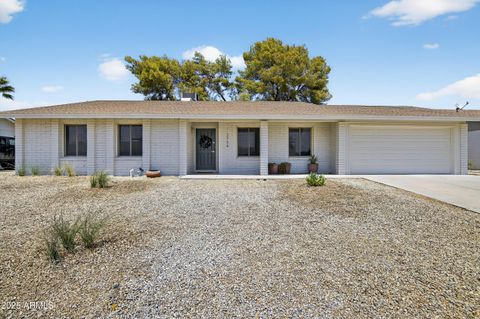
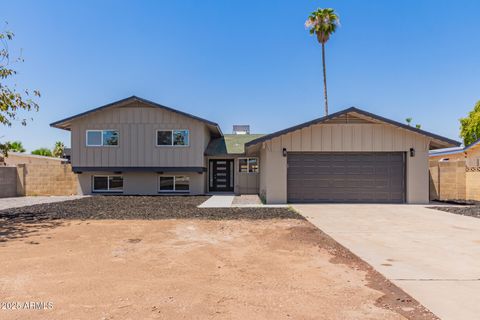
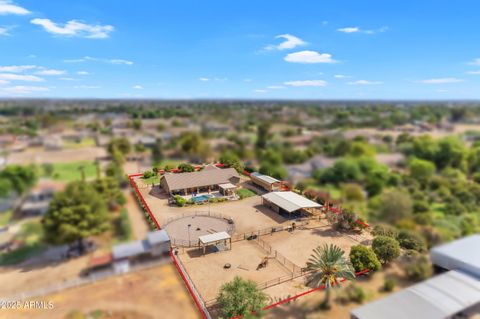
$449,000
4
bds
|
2
ba
|
1,744
sqft
|
built
1976
4502 E Hidalgo Ave, Phoenix, AZ 85040
$-252
Cash flow
-2.9%
Cash-on-Cash Return
5.0%
Cap rate
0.6%
Rent to Value Ratio
Active
$238,000
2
bds
|
1
ba
|
864
sqft
|
built
1954
2917 N 19th Ave, Phoenix, AZ 85015
$-254
Cash flow
-5.6%
Cash-on-Cash Return
4.4%
Cap rate
0.7%
Rent to Value Ratio
9,077 out of 10,507 properties for sale in Maricopa County
Limited Results Shown
Create a free account, or log in to reveal all property listings and enjoy the complete experience.
Active
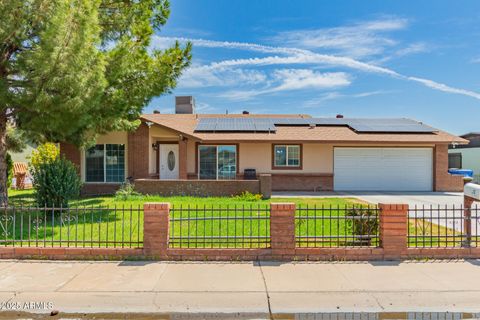
$359,000
3
bds
|
2
ba
|
1,654
sqft
|
built
1950
1741 W Wickieup Ln, Phoenix, AZ 85027
$-389
Cash flow
-5.7%
Cash-on-Cash Return
4.4%
Cap rate
0.6%
Rent to Value Ratio
Active
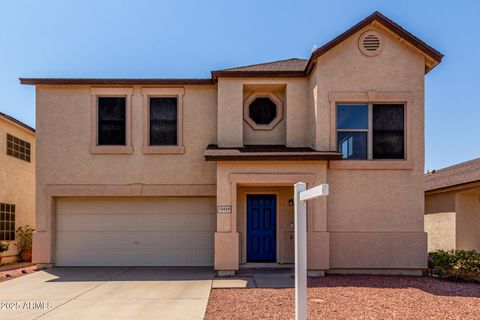
$369,500
3
bds
|
3
ba
|
1,379
sqft
|
built
1988
4114 E Union Hills Dr, Phoenix, AZ 85050
$-688
Cash flow
-9.7%
Cash-on-Cash Return
3.4%
Cap rate
0.5%
Rent to Value Ratio
Active
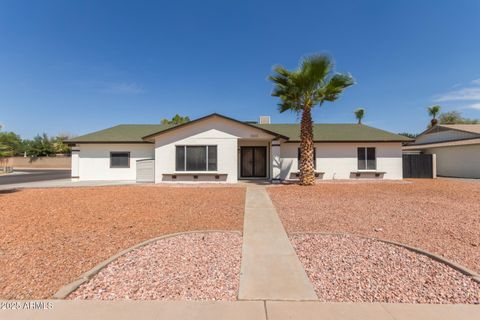
$275,000
1
bds
|
1
ba
|
750
sqft
|
built
1997
16013 S Desert Foothills Pkwy, Phoenix, AZ 85048
$-578
Cash flow
-11.0%
Cash-on-Cash Return
3.2%
Cap rate
0.6%
Rent to Value Ratio
Active
$674,999
4
bds
|
2
ba
|
1,890
sqft
|
built
1976
3754 E Wethersfield Rd, Phoenix, AZ 85032
$-1,674
Cash flow
-12.9%
Cash-on-Cash Return
2.7%
Cap rate
0.4%
Rent to Value Ratio

Active
$1,150,000
6
bds
|
5
ba
|
3,825
sqft
|
built
2015
4436 E Brookhart Way, Cave Creek, AZ 85331
$-2,993
Cash flow
-13.6%
Cash-on-Cash Return
2.6%
Cap rate
0.4%
Rent to Value Ratio

Active
$1,200,000
6
bds
|
5
ba
|
5,045
sqft
|
built
2021
5555 S Del Rancho, Mesa, AZ 85212
$-2,343
Cash flow
-10.2%
Cash-on-Cash Return
3.3%
Cap rate
0.5%
Rent to Value Ratio

Active
$329,500
2
bds
|
2
ba
|
1,044
sqft
|
built
1975
7350 N Via Paseo Del Sur, Scottsdale, AZ 85258
$-766
Cash flow
-12.1%
Cash-on-Cash Return
2.9%
Cap rate
0.6%
Rent to Value Ratio
Active
$450,000
3
bds
|
2
ba
|
1,913
sqft
|
built
1959
5209 N 61st Dr, Glendale, AZ 85301
$-825
Cash flow
-9.6%
Cash-on-Cash Return
3.5%
Cap rate
0.4%
Rent to Value Ratio
Active
$460,000
3
bds
|
2
ba
|
1,523
sqft
|
built
1986
4133 W Grovers Ave, Glendale, AZ 85308
$-726
Cash flow
-8.2%
Cash-on-Cash Return
3.8%
Cap rate
0.5%
Rent to Value Ratio

Active
$299,000
3
bds
|
3
ba
|
1,696
sqft
|
built
1979
3236 W Las Palmaritas Dr, Phoenix, AZ 85051
$-582
Cash flow
-10.2%
Cash-on-Cash Return
3.3%
Cap rate
0.5%
Rent to Value Ratio
Active
$500,000
3
bds
|
3
ba
|
1,832
sqft
|
built
1991
4136 W Fallen Leaf Ln, Glendale, AZ 85310
$-411
Cash flow
-4.3%
Cash-on-Cash Return
4.7%
Cap rate
0.6%
Rent to Value Ratio
Active
$699,999
4
bds
|
3
ba
|
2,807
sqft
|
built
2000
29001 N 51st Pl, Cave Creek, AZ 85331
$-1,052
Cash flow
-7.8%
Cash-on-Cash Return
3.9%
Cap rate
0.5%
Rent to Value Ratio
Active
$549,000
3
bds
|
2
ba
|
1,924
sqft
|
built
1967
2040 W Hazelwood St, Phoenix, AZ 85015
$-789
Cash flow
-7.5%
Cash-on-Cash Return
4.0%
Cap rate
0.5%
Rent to Value Ratio

Active
$2,700,000
4
bds
|
4
ba
|
4,082
sqft
|
built
2001
11540 E Caribbean Ln, Scottsdale, AZ 85255
$-7,361
Cash flow
-14.2%
Cash-on-Cash Return
2.4%
Cap rate
0.3%
Rent to Value Ratio
Active
$329,900
4
bds
|
3
ba
|
1,532
sqft
|
built
2014
7741 W Giles Rd, Phoenix, AZ 85035
$-536
Cash flow
-8.5%
Cash-on-Cash Return
3.7%
Cap rate
0.6%
Rent to Value Ratio
Active
$490,000
4
bds
|
3
ba
|
2,327
sqft
|
built
1968
5524 N 39th Ave, Phoenix, AZ 85019
$-838
Cash flow
-8.9%
Cash-on-Cash Return
3.6%
Cap rate
0.5%
Rent to Value Ratio
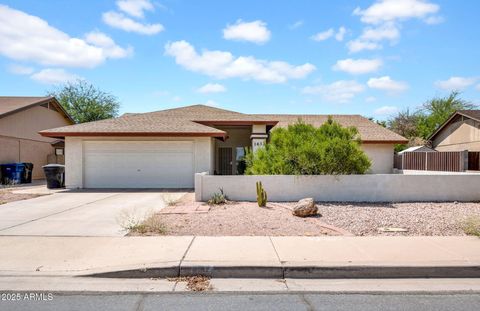
Active
$399,000
3
bds
|
2
ba
|
1,633
sqft
|
built
1986
1632 N Temple St, Mesa, AZ 85203
$-427
Cash flow
-5.6%
Cash-on-Cash Return
4.4%
Cap rate
0.6%
Rent to Value Ratio
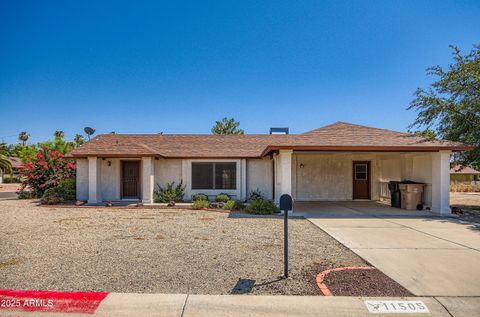
Active
$327,000
2
bds
|
2
ba
|
1,163
sqft
|
built
1985
11505 W Ohio Ave, Youngtown, AZ 85363
$-507
Cash flow
-8.1%
Cash-on-Cash Return
3.8%
Cap rate
0.5%
Rent to Value Ratio
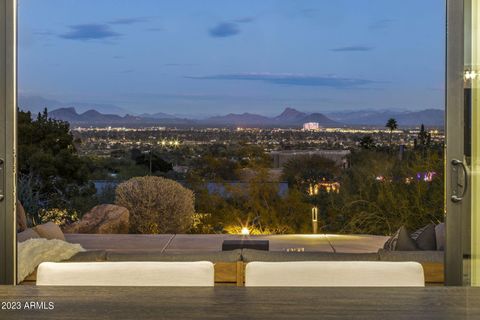
Active
$4,500,000
4
bds
|
3
ba
|
3,040
sqft
|
built
1974
5849 E Hummingbird Ln, Paradise Valley, AZ 85253
$-14,933
Cash flow
-17.3%
Cash-on-Cash Return
1.7%
Cap rate
0.2%
Rent to Value Ratio
Active
$1,200,000
5
bds
|
3
ba
|
3,202
sqft
|
built
2017
17707 E Stacey Rd, Queen Creek, AZ 85142
$-2,936
Cash flow
-12.8%
Cash-on-Cash Return
2.7%
Cap rate
0.4%
Rent to Value Ratio

Active
$415,000
4
bds
|
3
ba
|
2,211
sqft
|
built
2005
5132 W Shumway Farm Rd, Laveen, AZ 85339
$-712
Cash flow
-9.0%
Cash-on-Cash Return
3.6%
Cap rate
0.5%
Rent to Value Ratio
Active
$375,000
4
bds
|
2
ba
|
1,383
sqft
|
built
1978
3107 N 79th Ave, Phoenix, AZ 85033
$-629
Cash flow
-8.8%
Cash-on-Cash Return
3.7%
Cap rate
0.5%
Rent to Value Ratio
Active
$410,000
3
bds
|
3
ba
|
2,191
sqft
|
built
2000
12424 N B St, El Mirage, AZ 85335
$-298
Cash flow
-3.8%
Cash-on-Cash Return
4.8%
Cap rate
0.6%
Rent to Value Ratio
Active
$499,000
4
bds
|
2
ba
|
2,046
sqft
|
built
1973
8419 N 57th Dr, Glendale, AZ 85302
$-934
Cash flow
-9.8%
Cash-on-Cash Return
3.4%
Cap rate
0.5%
Rent to Value Ratio
Active
$525,000
3
bds
|
3
ba
|
1,849
sqft
|
built
1994
2571 W Park Ave, Chandler, AZ 85224
$-969
Cash flow
-9.6%
Cash-on-Cash Return
3.5%
Cap rate
0.5%
Rent to Value Ratio
Active
$1,139,000
4
bds
|
5
ba
|
3,196
sqft
|
built
2021
21874 E Via De Arboles, Queen Creek, AZ 85142
$-3,554
Cash flow
-16.3%
Cash-on-Cash Return
1.9%
Cap rate
0.3%
Rent to Value Ratio
Active
$450,000
3
bds
|
3
ba
|
1,477
sqft
|
built
1989
4334 E Windmere Dr, Phoenix, AZ 85048
$-730
Cash flow
-8.5%
Cash-on-Cash Return
3.7%
Cap rate
0.5%
Rent to Value Ratio
Active
$875,000
4
bds
|
4
ba
|
3,558
sqft
|
built
2021
7028 W Redbird Rd, Peoria, AZ 85383
$-2,054
Cash flow
-12.2%
Cash-on-Cash Return
2.9%
Cap rate
0.4%
Rent to Value Ratio
Active
$370,000
4
bds
|
2
ba
|
1,832
sqft
|
built
2000
12026 W Aster Dr, El Mirage, AZ 85335
$-635
Cash flow
-9.0%
Cash-on-Cash Return
3.6%
Cap rate
0.5%
Rent to Value Ratio
Active
$395,000
3
bds
|
2
ba
|
1,320
sqft
|
built
1983
9903 N 87th Dr, Peoria, AZ 85345
$-551
Cash flow
-7.3%
Cash-on-Cash Return
4.0%
Cap rate
0.5%
Rent to Value Ratio
Active
$975,000
4
bds
|
3
ba
|
3,049
sqft
|
built
1996
6729 W Villa Theresa Dr, Glendale, AZ 85308
$-2,483
Cash flow
-13.3%
Cash-on-Cash Return
2.6%
Cap rate
0.4%
Rent to Value Ratio

Active
$439,900
4
bds
|
2
ba
|
1,756
sqft
|
built
2003
16873 W Post Dr, Surprise, AZ 85388
$-644
Cash flow
-7.6%
Cash-on-Cash Return
3.9%
Cap rate
0.5%
Rent to Value Ratio
Active
$565,000
3
bds
|
3
ba
|
2,536
sqft
|
built
1995
13232 N 12th Pl, Phoenix, AZ 85022
$-892
Cash flow
-8.2%
Cash-on-Cash Return
3.8%
Cap rate
0.5%
Rent to Value Ratio
Active
$464,900
3
bds
|
3
ba
|
2,094
sqft
|
built
2012
4149 E Devon Dr, Gilbert, AZ 85296
$-773
Cash flow
-8.7%
Cash-on-Cash Return
3.7%
Cap rate
0.5%
Rent to Value Ratio
Active
$415,000
3
bds
|
3
ba
|
2,162
sqft
|
built
2023
24406 W Verlea Dr, Buckeye, AZ 85326
$-745
Cash flow
-9.4%
Cash-on-Cash Return
3.5%
Cap rate
0.5%
Rent to Value Ratio
Active
$1,900,000
4
bds
|
3
ba
|
2,729
sqft
|
built
2003
13502 E Jomax Rd, Scottsdale, AZ 85262
$-3,282
Cash flow
-9.0%
Cash-on-Cash Return
3.6%
Cap rate
0.5%
Rent to Value Ratio

Active
$745,000
3
bds
|
2
ba
|
2,181
sqft
|
built
1985
4407 E Le Marche Ave, Phoenix, AZ 85032
$-1,443
Cash flow
-10.1%
Cash-on-Cash Return
3.4%
Cap rate
0.5%
Rent to Value Ratio

Active
$425,000
3
bds
|
2
ba
|
1,593
sqft
|
built
1995
20834 N 1st Dr, Phoenix, AZ 85027
$-780
Cash flow
-9.6%
Cash-on-Cash Return
3.5%
Cap rate
0.5%
Rent to Value Ratio