Maricopa County Investment Properties for Sale
Browse homes for sale and investment properties in Maricopa County. Refine your search by price, property type, or more.
Best cash flowing properties in Maricopa County
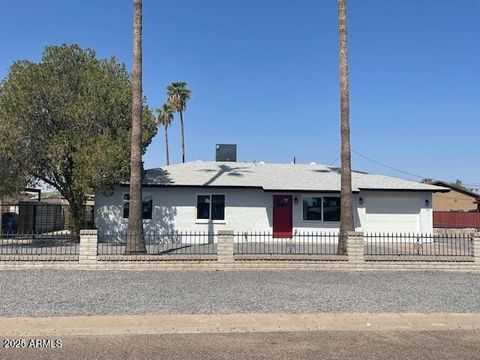
Active
$299,900
3
bds
|
2
ba
|
1,454
sqft
|
built
1964
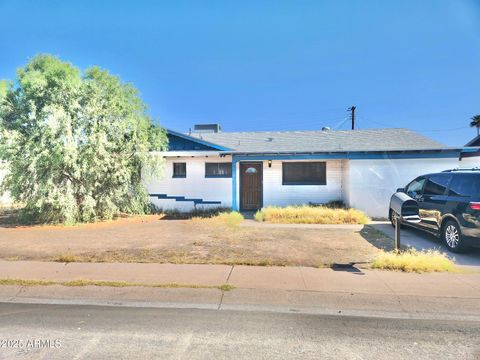
7136 E Bramble Ave, Mesa, AZ 85208
$-249
Cash flow
-4.3%
Cash-on-Cash Return
4.7%
Cap rate
0.6%
Rent to Value Ratio
Active
$203,500
1
bds
|
1
ba
|
702
sqft
|
built
1969
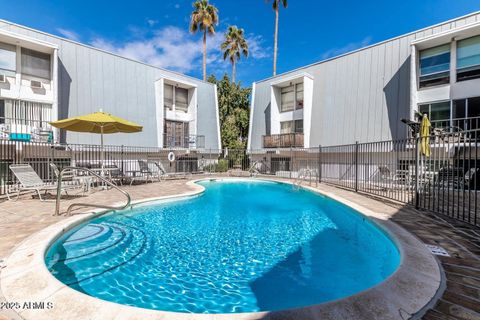
3416 N 44th St, Phoenix, AZ 85018
$-269
Cash flow
-6.9%
Cash-on-Cash Return
4.1%
Cap rate
0.8%
Rent to Value Ratio
8,635 out of 10,016 properties for sale in Maricopa County
Limited Results Shown
Create a free account, or log in to reveal all property listings and enjoy the complete experience.
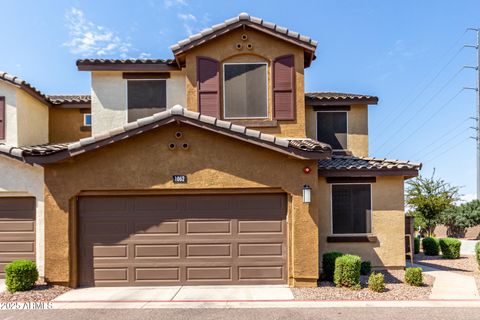
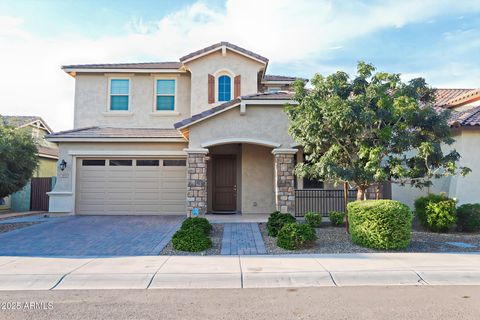
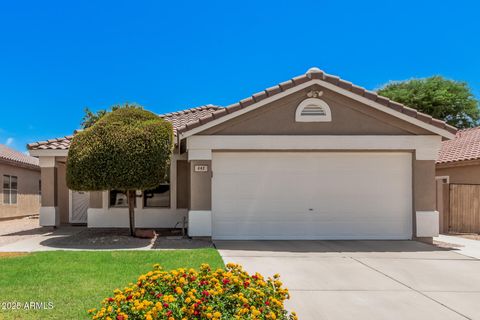
Active
$584,000
4
bds
|
3
ba
|
2,185
sqft
|
built
2022
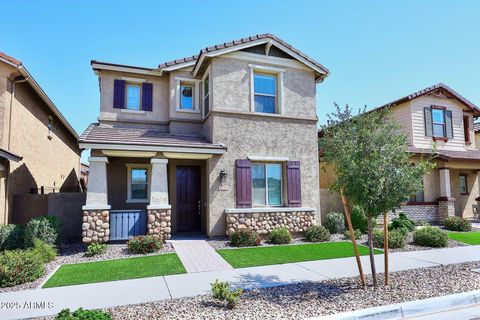
4278 E Jesse St, Gilbert, AZ 85295
$-1,187
Cash flow
-10.6%
Cash-on-Cash Return
3.2%
Cap rate
0.5%
Rent to Value Ratio
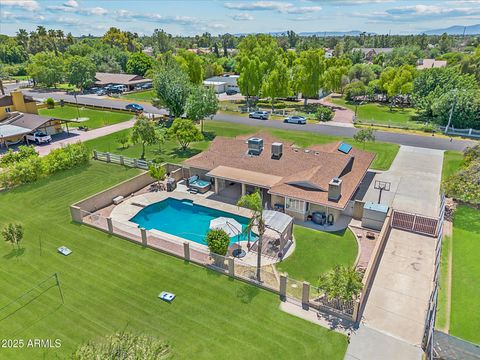
Active
$750,000
5
bds
|
3
ba
|
2,593
sqft
|
built
2004
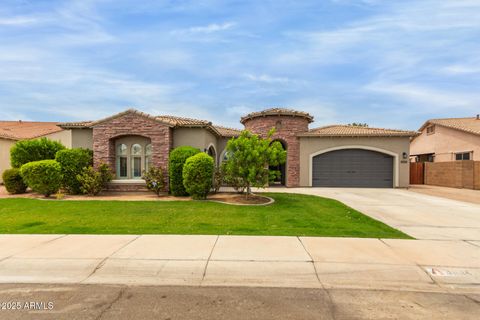
3054 S Colonial St, Gilbert, AZ 85295
$-1,675
Cash flow
-11.7%
Cash-on-Cash Return
3.0%
Cap rate
0.4%
Rent to Value Ratio
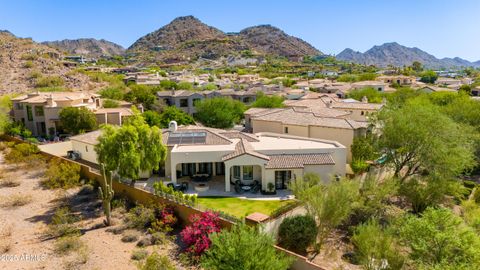
Active
$450,000
3
bds
|
3
ba
|
1,968
sqft
|
built
2020
1255 N Arizona Ave, Chandler, AZ 85225
$-760
Cash flow
-8.8%
Cash-on-Cash Return
3.7%
Cap rate
0.6%
Rent to Value Ratio

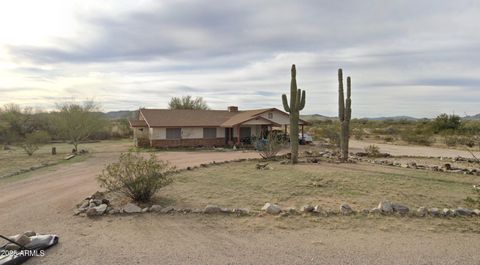
Active
$370,000
4
bds
|
2
ba
|
1,831
sqft
|
built
2004
22052 W Casey Ln, Buckeye, AZ 85326
$-547
Cash flow
-7.7%
Cash-on-Cash Return
3.9%
Cap rate
0.5%
Rent to Value Ratio
Active
$399,000
3
bds
|
2
ba
|
1,644
sqft
|
built
1971
19402 W Lynx Rd, Buckeye, AZ 85326
$-605
Cash flow
-7.9%
Cash-on-Cash Return
3.9%
Cap rate
0.6%
Rent to Value Ratio
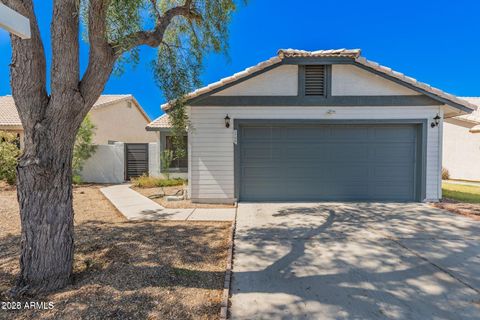
Active
$365,000
3
bds
|
2
ba
|
1,103
sqft
|
built
1992
1706 E Fremont Rd, Phoenix, AZ 85042
$-289
Cash flow
-4.1%
Cash-on-Cash Return
4.7%
Cap rate
0.6%
Rent to Value Ratio
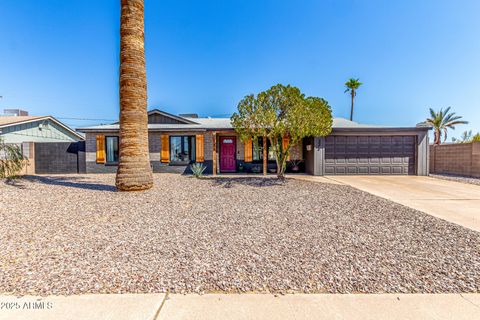
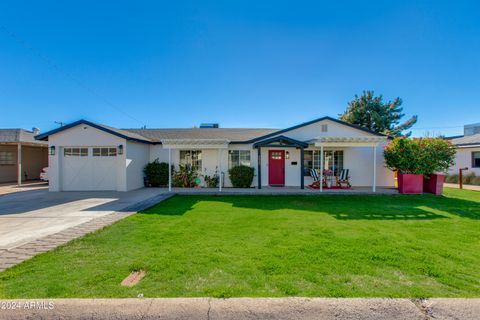
Active
$725,000
3
bds
|
2
ba
|
1,732
sqft
|
built
1960
226 E Mc Kinley St, Tempe, AZ 85288
$-1,085
Cash flow
-7.8%
Cash-on-Cash Return
3.9%
Cap rate
0.5%
Rent to Value Ratio

Active
$1,550,000
5
bds
|
4
ba
|
4,461
sqft
|
built
1999
4537 E Blue Sky Dr, Cave Creek, AZ 85331
$-3,770
Cash flow
-12.7%
Cash-on-Cash Return
2.8%
Cap rate
0.4%
Rent to Value Ratio

Active
$3,850,000
3
bds
|
3
ba
|
3,081
sqft
|
built
2008
18802 N 101st Pl, Scottsdale, AZ 85255
$-14,850
Cash flow
-20.1%
Cash-on-Cash Return
1.1%
Cap rate
0.2%
Rent to Value Ratio

Active
$490,000
6
bds
|
3
ba
|
2,683
sqft
|
built
2001
2338 N 112th Ln, Avondale, AZ 85392
$-1,000
Cash flow
-10.6%
Cash-on-Cash Return
3.2%
Cap rate
0.5%
Rent to Value Ratio
Active
$680,000
3
bds
|
3
ba
|
2,448
sqft
|
built
2016
7229 E Plata Ave, Mesa, AZ 85212
$-1,552
Cash flow
-11.9%
Cash-on-Cash Return
2.9%
Cap rate
0.4%
Rent to Value Ratio
Active
$629,900
4
bds
|
3
ba
|
2,415
sqft
|
built
1980
725 E Mc Nair Dr, Tempe, AZ 85283
$-1,186
Cash flow
-9.8%
Cash-on-Cash Return
3.4%
Cap rate
0.5%
Rent to Value Ratio
Active
$340,000
2
bds
|
2
ba
|
1,190
sqft
|
built
2000
14908 W Acapulco Ln, Surprise, AZ 85379
$-517
Cash flow
-7.9%
Cash-on-Cash Return
3.9%
Cap rate
0.5%
Rent to Value Ratio
Active
$359,000
3
bds
|
3
ba
|
1,262
sqft
|
built
2005
10296 W Sands Dr, Peoria, AZ 85383
$-566
Cash flow
-8.2%
Cash-on-Cash Return
3.8%
Cap rate
0.6%
Rent to Value Ratio

Active
$365,000
3
bds
|
3
ba
|
1,581
sqft
|
built
2013
335 S Travis, Mesa, AZ 85208
$-551
Cash flow
-7.9%
Cash-on-Cash Return
3.9%
Cap rate
0.5%
Rent to Value Ratio
Active
$1,625,000
3
bds
|
3
ba
|
2,638
sqft
|
built
1998
5730 E Cielo Run N, Cave Creek, AZ 85331
$-3,103
Cash flow
-10.0%
Cash-on-Cash Return
3.4%
Cap rate
0.4%
Rent to Value Ratio
Active
$1,250,000
4
bds
|
3
ba
|
3,901
sqft
|
built
1973
1522 E Northern Ave, Phoenix, AZ 85020
$-713
Cash flow
-3.0%
Cash-on-Cash Return
5.0%
Cap rate
0.6%
Rent to Value Ratio
Active
$335,000
2
bds
|
2
ba
|
864
sqft
|
built
1987
17031 E El Lago Blvd, Fountain Hills, AZ 85268
$-710
Cash flow
-11.1%
Cash-on-Cash Return
3.1%
Cap rate
0.5%
Rent to Value Ratio

Active
$1,249,000
5
bds
|
3
ba
|
2,880
sqft
|
built
1998
7370 E Wingspan Way, Scottsdale, AZ 85255
$-2,817
Cash flow
-11.8%
Cash-on-Cash Return
3.0%
Cap rate
0.4%
Rent to Value Ratio

Active
$3,649,000
4
bds
|
5
ba
|
4,181
sqft
|
built
2025
3046 N 45th St, Phoenix, AZ 85018
$-13,159
Cash flow
-18.8%
Cash-on-Cash Return
1.4%
Cap rate
0.2%
Rent to Value Ratio

Active
$595,000
5
bds
|
3
ba
|
2,025
sqft
|
built
2022
22521 E Twilight Dr, Queen Creek, AZ 85142
$-1,413
Cash flow
-12.4%
Cash-on-Cash Return
2.8%
Cap rate
0.4%
Rent to Value Ratio
Active
$519,900
3
bds
|
3
ba
|
1,927
sqft
|
built
1991
1002 S Port Dr, Gilbert, AZ 85233
$-939
Cash flow
-9.4%
Cash-on-Cash Return
3.5%
Cap rate
0.5%
Rent to Value Ratio
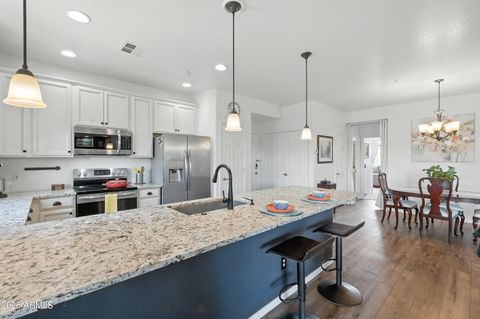
Active
$779,000
4
bds
|
3
ba
|
2,924
sqft
|
built
2019
1954 E Geronimo St, Chandler, AZ 85225
$-1,847
Cash flow
-12.4%
Cash-on-Cash Return
2.8%
Cap rate
0.4%
Rent to Value Ratio
Active
$975,000
3
bds
|
3
ba
|
2,047
sqft
|
built
1950
4035 E Indianola Ave, Phoenix, AZ 85018
$-1,424
Cash flow
-7.6%
Cash-on-Cash Return
3.9%
Cap rate
0.5%
Rent to Value Ratio
Active
$485,000
2
bds
|
2
ba
|
1,306
sqft
|
built
2001
11500 E Cochise Dr, Scottsdale, AZ 85259
$-930
Cash flow
-10.0%
Cash-on-Cash Return
3.4%
Cap rate
0.6%
Rent to Value Ratio
Active
$725,000
4
bds
|
3
ba
|
1,859
sqft
|
built
1983
9466 E Laurel Ln, Scottsdale, AZ 85260
$-477
Cash flow
-3.4%
Cash-on-Cash Return
4.9%
Cap rate
0.6%
Rent to Value Ratio

Active
$640,000
3
bds
|
3
ba
|
2,057
sqft
|
built
2000
22424 N 19th Way, Phoenix, AZ 85024
$-1,339
Cash flow
-10.9%
Cash-on-Cash Return
3.2%
Cap rate
0.4%
Rent to Value Ratio

Active
$1,200,000
4
bds
|
3
ba
|
3,081
sqft
|
built
1985
9878 E Aster Dr, Scottsdale, AZ 85260
$-2,162
Cash flow
-9.4%
Cash-on-Cash Return
3.5%
Cap rate
0.5%
Rent to Value Ratio
Active
$630,000
4
bds
|
2
ba
|
1,910
sqft
|
built
1954
12620 N 22nd Pl, Phoenix, AZ 85022
$-1,385
Cash flow
-11.5%
Cash-on-Cash Return
3.0%
Cap rate
0.4%
Rent to Value Ratio
Active
$465,000
3
bds
|
2
ba
|
1,393
sqft
|
built
1999
643 S Hazel Ct, Gilbert, AZ 85296
$-843
Cash flow
-9.5%
Cash-on-Cash Return
3.5%
Cap rate
0.5%
Rent to Value Ratio
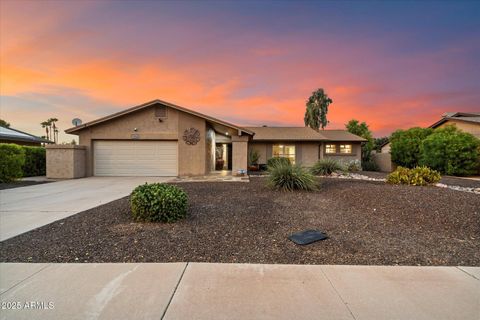
Active
$700,000
3
bds
|
2
ba
|
2,251
sqft
|
built
1973
6602 W Surrey Ave, Glendale, AZ 85304
$-1,113
Cash flow
-8.3%
Cash-on-Cash Return
3.8%
Cap rate
0.5%
Rent to Value Ratio
Active
$3,300,000
3
bds
|
4
ba
|
4,363
sqft
|
built
2012
3905 E Sierra Vista Dr, Paradise Valley, AZ 85253
$-11,439
Cash flow
-18.1%
Cash-on-Cash Return
1.5%
Cap rate
0.3%
Rent to Value Ratio
Active
$1,795,000
4
bds
|
4
ba
|
2,559
sqft
|
built
2020
4222 N 43rd St, Phoenix, AZ 85018
$-4,918
Cash flow
-14.3%
Cash-on-Cash Return
2.4%
Cap rate
0.3%
Rent to Value Ratio

Active
$550,000
4
bds
|
2
ba
|
2,488
sqft
|
built
2005
13259 W Mulberry Dr, Litchfield Park, AZ 85340
$-976
Cash flow
-9.3%
Cash-on-Cash Return
3.5%
Cap rate
0.5%
Rent to Value Ratio
Active
$479,900
4
bds
|
2
ba
|
1,965
sqft
|
built
2021
19642 W Roma Ave, Litchfield Park, AZ 85340
$-839
Cash flow
-9.1%
Cash-on-Cash Return
3.6%
Cap rate
0.5%
Rent to Value Ratio

Active
$975,000
4
bds
|
3
ba
|
3,233
sqft
|
built
1994
11056 E White Feather Ln, Scottsdale, AZ 85262
$-1,446
Cash flow
-7.7%
Cash-on-Cash Return
3.9%
Cap rate
0.5%
Rent to Value Ratio

Active
$375,000
3
bds
|
2
ba
|
1,305
sqft
|
built
1959
5732 N 63rd Dr, Glendale, AZ 85301
$-452
Cash flow
-6.3%
Cash-on-Cash Return
4.2%
Cap rate
0.5%
Rent to Value Ratio
Active
$384,900
3
bds
|
2
ba
|
1,838
sqft
|
built
2015
7134 S 254th Ln, Buckeye, AZ 85326
$-830
Cash flow
-11.3%
Cash-on-Cash Return
3.1%
Cap rate
0.5%
Rent to Value Ratio