Maricopa County Investment Properties for Sale
Browse homes for sale and investment properties in Maricopa County. Refine your search by price, property type, or more.
Best cash flowing properties in Maricopa County
Active
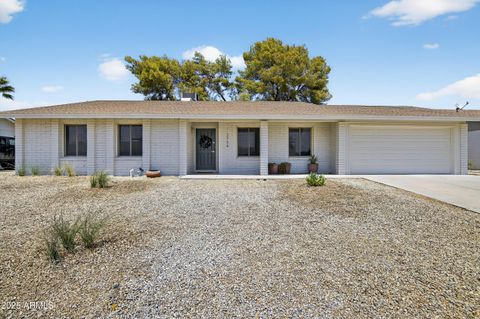
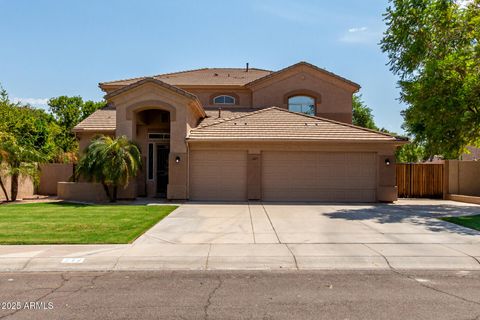
$449,000
4
bds
|
2
ba
|
1,744
sqft
|
built
1976
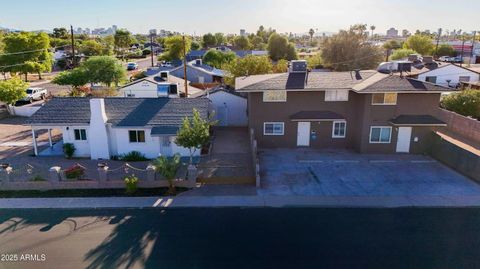
4502 E Hidalgo Ave, Phoenix, AZ 85040
$-252
Cash flow
-2.9%
Cash-on-Cash Return
5.0%
Cap rate
0.6%
Rent to Value Ratio
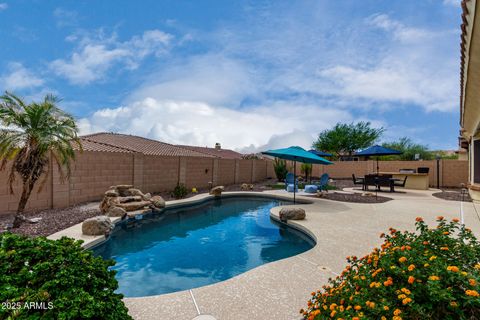
Active
$238,000
2
bds
|
1
ba
|
864
sqft
|
built
1954
2917 N 19th Ave, Phoenix, AZ 85015
$-254
Cash flow
-5.6%
Cash-on-Cash Return
4.4%
Cap rate
0.7%
Rent to Value Ratio
8,457 out of 9,819 properties for sale in Maricopa County
Limited Results Shown
Create a free account, or log in to reveal all property listings and enjoy the complete experience.
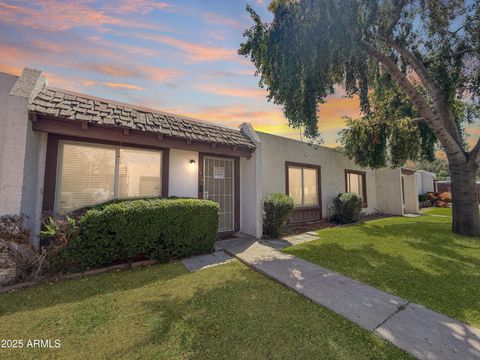
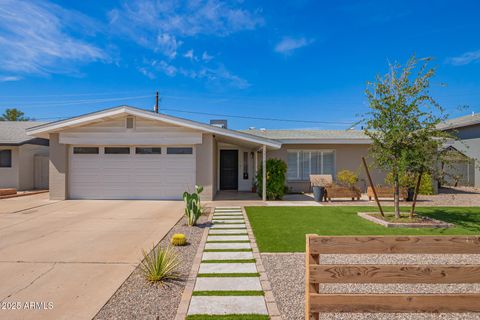
Active
$369,500
3
bds
|
3
ba
|
1,379
sqft
|
built
1988
4114 E Union Hills Dr, Phoenix, AZ 85050
$-688
Cash flow
-9.7%
Cash-on-Cash Return
3.4%
Cap rate
0.5%
Rent to Value Ratio
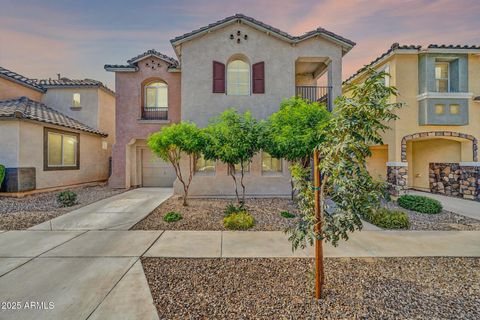
Active
$275,000
1
bds
|
1
ba
|
750
sqft
|
built
1997
16013 S Desert Foothills Pkwy, Phoenix, AZ 85048
$-578
Cash flow
-11.0%
Cash-on-Cash Return
3.2%
Cap rate
0.6%
Rent to Value Ratio
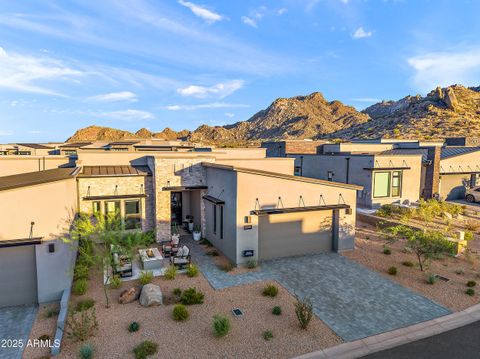
Active
$674,999
4
bds
|
2
ba
|
1,890
sqft
|
built
1976
3754 E Wethersfield Rd, Phoenix, AZ 85032
$-1,674
Cash flow
-12.9%
Cash-on-Cash Return
2.7%
Cap rate
0.4%
Rent to Value Ratio

Active
$1,150,000
6
bds
|
5
ba
|
3,825
sqft
|
built
2015
4436 E Brookhart Way, Cave Creek, AZ 85331
$-2,993
Cash flow
-13.6%
Cash-on-Cash Return
2.6%
Cap rate
0.4%
Rent to Value Ratio
Active
$719,000
5
bds
|
4
ba
|
3,340
sqft
|
built
2005
18135 W Willow Dr, Goodyear, AZ 85338
$-1,756
Cash flow
-12.7%
Cash-on-Cash Return
2.7%
Cap rate
0.4%
Rent to Value Ratio
Active
$240,000
2
bds
|
1
ba
|
924
sqft
|
built
1973
4610 W Desert Crest Dr, Glendale, AZ 85301
$-399
Cash flow
-8.7%
Cash-on-Cash Return
3.7%
Cap rate
0.6%
Rent to Value Ratio
Active
$1,450,000
3
bds
|
3
ba
|
2,390
sqft
|
built
2023
23491 N 125th Pl, Scottsdale, AZ 85255
$-2,159
Cash flow
-7.8%
Cash-on-Cash Return
3.9%
Cap rate
0.6%
Rent to Value Ratio
Active
$1,650,000
5
bds
|
3
ba
|
3,610
sqft
|
built
1999
12061 E Shangri La Rd, Scottsdale, AZ 85259
$-4,422
Cash flow
-14.0%
Cash-on-Cash Return
2.5%
Cap rate
0.3%
Rent to Value Ratio

Active
$544,000
2
bds
|
3
ba
|
1,294
sqft
|
built
2006
9551 E Redfield Rd, Scottsdale, AZ 85260
$-1,267
Cash flow
-12.2%
Cash-on-Cash Return
2.9%
Cap rate
0.5%
Rent to Value Ratio
Active
$925,000
bds
|
0
ba
|
0
sqft
|
built
1965
2646 E Willetta St, Phoenix, AZ 85008
$-2,965
Cash flow
-16.7%
Cash-on-Cash Return
1.8%
Cap rate
0.2%
Rent to Value Ratio
Active
$880,000
4
bds
|
3
ba
|
3,014
sqft
|
built
2009
3591 E Coconino Dr, Chandler, AZ 85249
$-2,432
Cash flow
-14.4%
Cash-on-Cash Return
2.4%
Cap rate
0.4%
Rent to Value Ratio

Active
$594,900
3
bds
|
2
ba
|
1,871
sqft
|
built
2004
3882 S Eucalyptus Pl, Chandler, AZ 85286
$-1,080
Cash flow
-9.5%
Cash-on-Cash Return
3.5%
Cap rate
0.5%
Rent to Value Ratio

Active
$1,950,000
5
bds
|
6
ba
|
5,254
sqft
|
built
1998
9637 W Avenida Del Sol, Peoria, AZ 85383
$-4,825
Cash flow
-12.9%
Cash-on-Cash Return
2.7%
Cap rate
0.4%
Rent to Value Ratio
Active
$425,000
3
bds
|
2
ba
|
1,907
sqft
|
built
2005
4649 W Hasan Dr, Laveen, AZ 85339
$-834
Cash flow
-10.2%
Cash-on-Cash Return
3.3%
Cap rate
0.5%
Rent to Value Ratio

Active
$1,200,000
6
bds
|
5
ba
|
5,045
sqft
|
built
2021
5555 S Del Rancho, Mesa, AZ 85212
$-2,343
Cash flow
-10.2%
Cash-on-Cash Return
3.3%
Cap rate
0.5%
Rent to Value Ratio

Active
$329,500
2
bds
|
2
ba
|
1,044
sqft
|
built
1975
7350 N Via Paseo Del Sur, Scottsdale, AZ 85258
$-766
Cash flow
-12.1%
Cash-on-Cash Return
2.9%
Cap rate
0.6%
Rent to Value Ratio
Active
$450,000
3
bds
|
2
ba
|
1,913
sqft
|
built
1959
5209 N 61st Dr, Glendale, AZ 85301
$-825
Cash flow
-9.6%
Cash-on-Cash Return
3.5%
Cap rate
0.4%
Rent to Value Ratio
Active
$460,000
3
bds
|
2
ba
|
1,523
sqft
|
built
1986
4133 W Grovers Ave, Glendale, AZ 85308
$-726
Cash flow
-8.2%
Cash-on-Cash Return
3.8%
Cap rate
0.5%
Rent to Value Ratio

Active
$299,000
3
bds
|
3
ba
|
1,696
sqft
|
built
1979
3236 W Las Palmaritas Dr, Phoenix, AZ 85051
$-582
Cash flow
-10.2%
Cash-on-Cash Return
3.3%
Cap rate
0.5%
Rent to Value Ratio
Active
$500,000
3
bds
|
3
ba
|
1,832
sqft
|
built
1991
4136 W Fallen Leaf Ln, Glendale, AZ 85310
$-411
Cash flow
-4.3%
Cash-on-Cash Return
4.7%
Cap rate
0.6%
Rent to Value Ratio
Active
$699,999
4
bds
|
3
ba
|
2,807
sqft
|
built
2000
29001 N 51st Pl, Cave Creek, AZ 85331
$-1,052
Cash flow
-7.8%
Cash-on-Cash Return
3.9%
Cap rate
0.5%
Rent to Value Ratio
Active
$1,075,000
3
bds
|
3
ba
|
2,829
sqft
|
built
2013
18550 N 94th St, Scottsdale, AZ 85255
$-2,962
Cash flow
-14.4%
Cash-on-Cash Return
2.4%
Cap rate
0.4%
Rent to Value Ratio

Active
$799,999
5
bds
|
4
ba
|
2,883
sqft
|
built
2010
1947 E Azalea Ct, Gilbert, AZ 85298
$-1,782
Cash flow
-11.6%
Cash-on-Cash Return
3.0%
Cap rate
0.4%
Rent to Value Ratio
Active
$1,499,900
4
bds
|
3
ba
|
2,419
sqft
|
built
1979
9625 N 83rd Way, Scottsdale, AZ 85258
$-4,334
Cash flow
-15.1%
Cash-on-Cash Return
2.2%
Cap rate
0.3%
Rent to Value Ratio

Active
$240,000
1
bds
|
1
ba
|
659
sqft
|
built
1972
8055 E Thomas Rd, Scottsdale, AZ 85251
$-503
Cash flow
-10.9%
Cash-on-Cash Return
3.2%
Cap rate
0.6%
Rent to Value Ratio
Active
$675,000
5
bds
|
2
ba
|
2,288
sqft
|
built
1956
1421 W Orange Dr, Phoenix, AZ 85013
$-1,263
Cash flow
-9.8%
Cash-on-Cash Return
3.4%
Cap rate
0.5%
Rent to Value Ratio

Active
$1,020,000
4
bds
|
3
ba
|
2,595
sqft
|
built
2005
5530 W Yearling Rd, Phoenix, AZ 85083
$-2,857
Cash flow
-14.6%
Cash-on-Cash Return
2.3%
Cap rate
0.4%
Rent to Value Ratio
Active
$370,000
4
bds
|
3
ba
|
2,162
sqft
|
built
2006
7229 W Crown King Rd, Phoenix, AZ 85043
$-450
Cash flow
-6.3%
Cash-on-Cash Return
4.2%
Cap rate
0.6%
Rent to Value Ratio

Active
$630,000
3
bds
|
2
ba
|
1,993
sqft
|
built
1958
6827 E Palm Ln, Scottsdale, AZ 85257
$-1,049
Cash flow
-8.7%
Cash-on-Cash Return
3.7%
Cap rate
0.5%
Rent to Value Ratio
Active
$725,000
5
bds
|
4
ba
|
3,253
sqft
|
built
2006
13670 N 151st Dr, Surprise, AZ 85379
$-1,693
Cash flow
-12.2%
Cash-on-Cash Return
2.9%
Cap rate
0.4%
Rent to Value Ratio
Active
$380,000
1
bds
|
2
ba
|
1,011
sqft
|
built
2021
2511 W Queen Creek Rd, Chandler, AZ 85248
$-646
Cash flow
-8.9%
Cash-on-Cash Return
3.6%
Cap rate
0.7%
Rent to Value Ratio

Active
$360,000
3
bds
|
2
ba
|
1,310
sqft
|
built
2004
3145 W Huntington Dr, Phoenix, AZ 85041
$-515
Cash flow
-7.5%
Cash-on-Cash Return
4.0%
Cap rate
0.6%
Rent to Value Ratio
Active
$850,000
5
bds
|
3
ba
|
3,833
sqft
|
built
1998
483 N Halsted Ct, Chandler, AZ 85225
$-2,018
Cash flow
-12.4%
Cash-on-Cash Return
2.8%
Cap rate
0.4%
Rent to Value Ratio
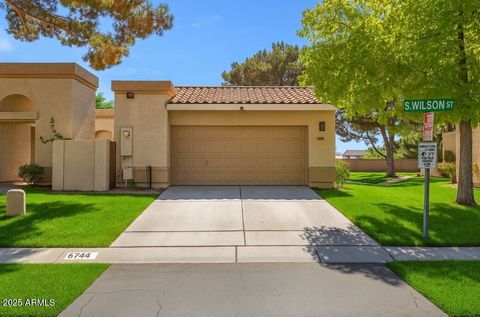
Active
$415,000
3
bds
|
2
ba
|
1,330
sqft
|
built
1989
6744 S Wilson St, Tempe, AZ 85283
$-896
Cash flow
-11.3%
Cash-on-Cash Return
3.1%
Cap rate
0.5%
Rent to Value Ratio
Active
$925,000
4
bds
|
4
ba
|
3,458
sqft
|
built
1996
947 W Ebony Dr, Chandler, AZ 85248
$-2,564
Cash flow
-14.5%
Cash-on-Cash Return
2.4%
Cap rate
0.3%
Rent to Value Ratio
Active
$549,000
3
bds
|
2
ba
|
1,924
sqft
|
built
1967
2040 W Hazelwood St, Phoenix, AZ 85015
$-789
Cash flow
-7.5%
Cash-on-Cash Return
4.0%
Cap rate
0.5%
Rent to Value Ratio

Active
$2,700,000
4
bds
|
4
ba
|
4,082
sqft
|
built
2001
11540 E Caribbean Ln, Scottsdale, AZ 85255
$-7,361
Cash flow
-14.2%
Cash-on-Cash Return
2.4%
Cap rate
0.3%
Rent to Value Ratio
Active
$329,900
4
bds
|
3
ba
|
1,532
sqft
|
built
2014
7741 W Giles Rd, Phoenix, AZ 85035
$-536
Cash flow
-8.5%
Cash-on-Cash Return
3.7%
Cap rate
0.6%
Rent to Value Ratio