Baton Rouge, LA Investment Properties for Sale
Browse homes for sale and investment properties in Baton Rouge, LA. Refine your search by price, property type, or more.
Best cash flowing properties in Baton Rouge, LA
Active
$130,000
2
bds
|
2
ba
|
1,299
sqft
|
built
1977
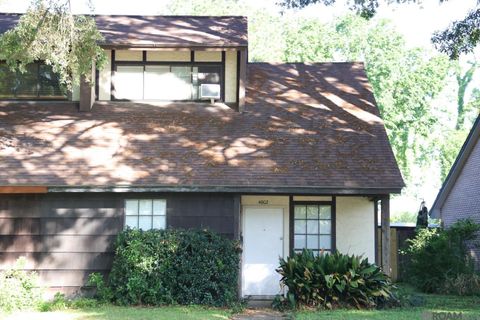
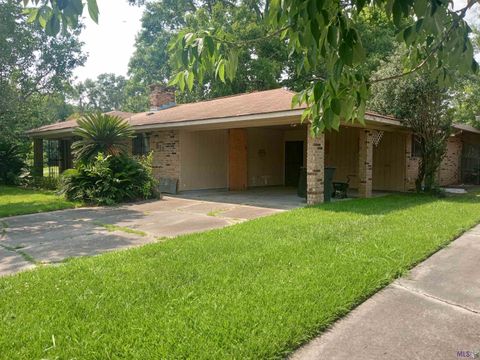
4902 Alvin Dark Ave, Baton Rouge, LA 70820
$489
Cash flow
19.6%
Cash-on-Cash Return
10.2%
Cap rate
1.2%
Rent to Value Ratio

Active
$116,000
2
bds
|
1
ba
|
1,100
sqft
|
built
1970
2034 N 15th St, Baton Rouge, LA 70802
$417
Cash flow
18.8%
Cash-on-Cash Return
10.0%
Cap rate
1.2%
Rent to Value Ratio
905 out of 1,341 properties for sale in Baton Rouge, LA
Limited Results Shown
Create a free account, or log in to reveal all property listings and enjoy the complete experience.

Active
$128,000
3
bds
|
1
ba
|
1,229
sqft
|
built
1923
1223 Convention St, Baton Rouge, LA 70802
$84
Cash flow
3.4%
Cash-on-Cash Return
6.5%
Cap rate
0.8%
Rent to Value Ratio

Active
$415,000
3
bds
|
3
ba
|
2,179
sqft
|
built
2011
13322 Quail Grove Ave, Baton Rouge, LA 70809
$-264
Cash flow
-3.3%
Cash-on-Cash Return
4.9%
Cap rate
0.6%
Rent to Value Ratio
Active
$130,000
2
bds
|
2
ba
|
1,299
sqft
|
built
1977
4902 Alvin Dark Ave, Baton Rouge, LA 70820
$489
Cash flow
19.6%
Cash-on-Cash Return
10.2%
Cap rate
1.2%
Rent to Value Ratio

Active
$349,900
4
bds
|
3
ba
|
2,304
sqft
|
built
1981
10124 Hillsbury Dr, Baton Rouge, LA 70809
$66
Cash flow
1.0%
Cash-on-Cash Return
5.9%
Cap rate
0.7%
Rent to Value Ratio

Active
$999,500
4
bds
|
2
ba
|
2,017
sqft
|
built
1959
6225 Boone Ave, Baton Rouge, LA 70808
$-3,146
Cash flow
-16.4%
Cash-on-Cash Return
1.9%
Cap rate
0.2%
Rent to Value Ratio
Active
$245,900
3
bds
|
2
ba
|
2,466
sqft
|
built
1958
11666 Parkwood Dr, Baton Rouge, LA 70815
$283
Cash flow
6.0%
Cash-on-Cash Return
7.1%
Cap rate
0.9%
Rent to Value Ratio
Active
$245,000
3
bds
|
2
ba
|
2,315
sqft
|
built
1976
1526 Munal Dr, Baton Rouge, LA 70816
$221
Cash flow
4.7%
Cash-on-Cash Return
6.8%
Cap rate
0.8%
Rent to Value Ratio

Active
$240,000
4
bds
|
3
ba
|
1,910
sqft
|
built
1960
3443 Warren Dr, Baton Rouge, LA 70814
$244
Cash flow
5.3%
Cash-on-Cash Return
6.9%
Cap rate
0.8%
Rent to Value Ratio

Active
$539,000
4
bds
|
3
ba
|
2,740
sqft
|
built
2007
3246 Grand Field Ave, Baton Rouge, LA 70810
$134
Cash flow
1.3%
Cash-on-Cash Return
6.0%
Cap rate
0.7%
Rent to Value Ratio

Active
$750,000
4
bds
|
3
ba
|
3,407
sqft
|
built
2005
15412 Campanile Ct, Baton Rouge, LA 70810
$-523
Cash flow
-3.6%
Cash-on-Cash Return
4.8%
Cap rate
0.6%
Rent to Value Ratio

Active
$480,000
4
bds
|
3
ba
|
3,459
sqft
|
built
1970
1338 Oakley Dr, Baton Rouge, LA 70806
$-271
Cash flow
-2.9%
Cash-on-Cash Return
5.0%
Cap rate
0.6%
Rent to Value Ratio

Active
$318,900
3
bds
|
1
ba
|
1,167
sqft
|
built
1956
707 Rapides St, Baton Rouge, LA 70806
$-267
Cash flow
-4.4%
Cash-on-Cash Return
4.7%
Cap rate
0.6%
Rent to Value Ratio

Active
$165,000
3
bds
|
2
ba
|
1,190
sqft
|
built
2010
1859 69th Ave, Baton Rouge, LA 70807
$185
Cash flow
5.8%
Cash-on-Cash Return
7.0%
Cap rate
0.8%
Rent to Value Ratio

Active
$349,500
4
bds
|
3
ba
|
2,818
sqft
|
built
1999
6335 Antioch Blvd, Baton Rouge, LA 70817
$140
Cash flow
2.1%
Cash-on-Cash Return
6.2%
Cap rate
0.7%
Rent to Value Ratio

Active
$685,000
4
bds
|
3
ba
|
2,900
sqft
|
built
1960
735 Dubois Dr, Baton Rouge, LA 70808
$-758
Cash flow
-5.8%
Cash-on-Cash Return
4.4%
Cap rate
0.5%
Rent to Value Ratio

Active
$600,000
3
bds
|
4
ba
|
2,272
sqft
|
built
1945
606 Leeward Dr, Baton Rouge, LA 70808
$-1,462
Cash flow
-12.7%
Cash-on-Cash Return
2.8%
Cap rate
0.3%
Rent to Value Ratio
Active
$399,000
2
bds
|
2
ba
|
2,372
sqft
|
built
1978
3920 Drusilla Dr, Baton Rouge, LA 70809
$-163
Cash flow
-2.1%
Cash-on-Cash Return
5.2%
Cap rate
0.6%
Rent to Value Ratio

Active
$80,000
3
bds
|
1
ba
|
926
sqft
|
built
1955
6824 Autumn Ave, Baton Rouge, LA 70812
$380
Cash flow
24.8%
Cash-on-Cash Return
11.4%
Cap rate
1.4%
Rent to Value Ratio

Active
$264,900
4
bds
|
2
ba
|
1,904
sqft
|
built
1977
7327 Briarplace Dr, Baton Rouge, LA 70817
$-34
Cash flow
-0.7%
Cash-on-Cash Return
5.5%
Cap rate
0.7%
Rent to Value Ratio

Active
$1,025,000
4
bds
|
4
ba
|
3,576
sqft
|
built
2018
7515 Tilton Ct, Baton Rouge, LA 70806
$-999
Cash flow
-5.1%
Cash-on-Cash Return
4.5%
Cap rate
0.6%
Rent to Value Ratio

Active
$639,000
4
bds
|
3
ba
|
2,646
sqft
|
built
2014
6374 Muir St, Baton Rouge, LA 70817
$-375
Cash flow
-3.1%
Cash-on-Cash Return
5.0%
Cap rate
0.6%
Rent to Value Ratio

Active
$199,000
4
bds
|
4
ba
|
2,450
sqft
|
built
1961
824 Princewood Ct, Baton Rouge, LA 70806
$300
Cash flow
7.9%
Cash-on-Cash Return
7.5%
Cap rate
0.9%
Rent to Value Ratio

Active
$285,000
bds
|
0
ba
|
1,536
sqft
|
built
3408 Wilshire Dr, Baton Rouge, LA 70806
$31
Cash flow
0.6%
Cash-on-Cash Return
5.8%
Cap rate
0.7%
Rent to Value Ratio
Active
$137,900
3
bds
|
2
ba
|
1,949
sqft
|
built
1970
211 Lakecrest Ave, Baton Rouge, LA 70807
$313
Cash flow
11.8%
Cash-on-Cash Return
8.4%
Cap rate
1.0%
Rent to Value Ratio

Active
$785,000
4
bds
|
3
ba
|
3,303
sqft
|
built
1980
8311 Oakbrook Dr, Baton Rouge, LA 70810
$-794
Cash flow
-5.3%
Cash-on-Cash Return
4.5%
Cap rate
0.5%
Rent to Value Ratio
Active
$475,000
5
bds
|
3
ba
|
2,967
sqft
|
built
1974
11403 Joor Rd, Baton Rouge, LA 70818
$-40
Cash flow
-0.4%
Cash-on-Cash Return
5.6%
Cap rate
0.7%
Rent to Value Ratio

Active
$749,000
4
bds
|
4
ba
|
4,452
sqft
|
built
1910
540 Drehr Ave, Baton Rouge, LA 70806
$-1,957
Cash flow
-13.6%
Cash-on-Cash Return
2.5%
Cap rate
0.3%
Rent to Value Ratio

Active
$900,000
6
bds
|
5
ba
|
4,481
sqft
|
built
2003
3258 Mc Clendon Ct, Baton Rouge, LA 70810
$-1,683
Cash flow
-9.8%
Cash-on-Cash Return
3.4%
Cap rate
0.4%
Rent to Value Ratio

Active
$165,000
2
bds
|
2
ba
|
1,150
sqft
|
built
1980
1835 Fountain Ave, Baton Rouge, LA 70810
$185
Cash flow
5.8%
Cash-on-Cash Return
7.0%
Cap rate
0.8%
Rent to Value Ratio

Active
$267,500
4
bds
|
2
ba
|
2,592
sqft
|
built
1978
7634 Oakmount Dr, Baton Rouge, LA 70817
$299
Cash flow
5.8%
Cash-on-Cash Return
7.0%
Cap rate
0.9%
Rent to Value Ratio

Active
$223,000
3
bds
|
2
ba
|
1,727
sqft
|
built
1958
2958 Madeira Dr, Baton Rouge, LA 70810
$187
Cash flow
4.4%
Cash-on-Cash Return
6.7%
Cap rate
0.8%
Rent to Value Ratio

Active
$565,000
4
bds
|
3
ba
|
2,856
sqft
|
built
1989
626 Shadow Oak Dr, Baton Rouge, LA 70810
$4
Cash flow
0.0%
Cash-on-Cash Return
5.7%
Cap rate
0.7%
Rent to Value Ratio

Active
$498,000
3
bds
|
2
ba
|
2,557
sqft
|
built
1987
1350 Pickett Ave, Baton Rouge, LA 70808
$-494
Cash flow
-5.2%
Cash-on-Cash Return
4.5%
Cap rate
0.5%
Rent to Value Ratio

Active
$583,000
3
bds
|
3
ba
|
2,205
sqft
|
built
2015
7037 Etage Ct, Baton Rouge, LA 70806
$-726
Cash flow
-6.5%
Cash-on-Cash Return
4.2%
Cap rate
0.5%
Rent to Value Ratio
Active
$314,900
2
bds
|
3
ba
|
1,573
sqft
|
built
2018
5066 Myrtle Trail Dr, Baton Rouge, LA 70820
$-511
Cash flow
-8.5%
Cash-on-Cash Return
3.7%
Cap rate
0.5%
Rent to Value Ratio

Active
$345,000
3
bds
|
3
ba
|
2,216
sqft
|
built
1975
245 Rue De Laplace, Baton Rouge, LA 70810
$88
Cash flow
1.3%
Cash-on-Cash Return
6.0%
Cap rate
0.7%
Rent to Value Ratio

Active
$315,000
3
bds
|
2
ba
|
1,697
sqft
|
built
2016
14034 Arbor Grove Dr, Baton Rouge, LA 70810
$-600
Cash flow
-9.9%
Cash-on-Cash Return
3.4%
Cap rate
0.4%
Rent to Value Ratio

Active
$300,000
3
bds
|
3
ba
|
1,521
sqft
|
built
2016
7131 Kodiak Dr, Baton Rouge, LA 70810
$-84
Cash flow
-1.5%
Cash-on-Cash Return
5.3%
Cap rate
0.7%
Rent to Value Ratio

Active
$355,000
4
bds
|
2
ba
|
2,253
sqft
|
built
2016
17525 Waterloo Dr, Baton Rouge, LA 70817
$13
Cash flow
0.2%
Cash-on-Cash Return
5.7%
Cap rate
0.7%
Rent to Value Ratio
Active
$116,000
2
bds
|
1
ba
|
1,100
sqft
|
built
1970
2034 N 15th St, Baton Rouge, LA 70802
$417
Cash flow
18.8%
Cash-on-Cash Return
10.0%
Cap rate
1.2%
Rent to Value Ratio