Baton Rouge, LA Investment Properties for Sale
Browse homes for sale and investment properties in Baton Rouge, LA. Refine your search by price, property type, or more.
Best cash flowing properties in Baton Rouge, LA

Active
$19,999
3
bds
|
2
ba
|
1,558
sqft
|
built
1970
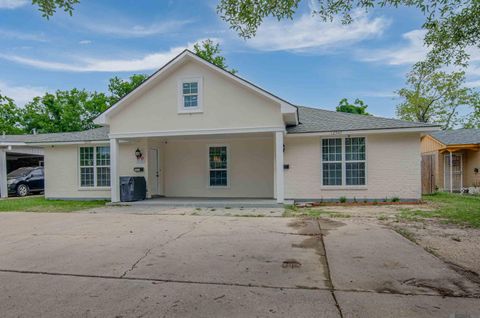
4723 Madison Ave, Baton Rouge, LA 70802
$828
Cash flow
48.2%
Cash-on-Cash Return
49.7%
Cap rate
6.0%
Rent to Value Ratio

Active
$12,500
2
bds
|
1
ba
|
700
sqft
|
built
1974
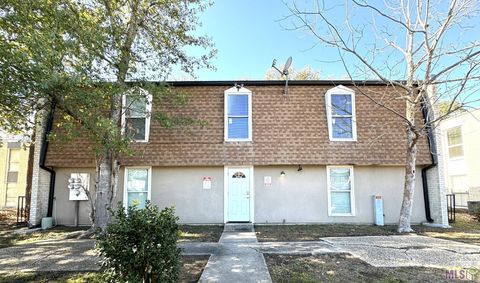
5169 Annette St, Baton Rouge, LA 70805
$759
Cash flow
70.7%
Cash-on-Cash Return
72.9%
Cap rate
8.8%
Rent to Value Ratio
964 out of 1,244 properties for sale in Baton Rouge, LA
Limited Results Shown
Create a free account, or log in to reveal all property listings and enjoy the complete experience.

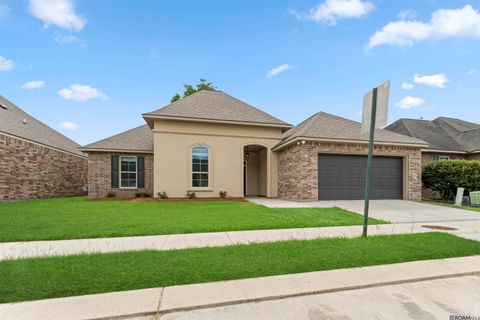
Active
$299,000
3
bds
|
2
ba
|
1,663
sqft
|
built
2012
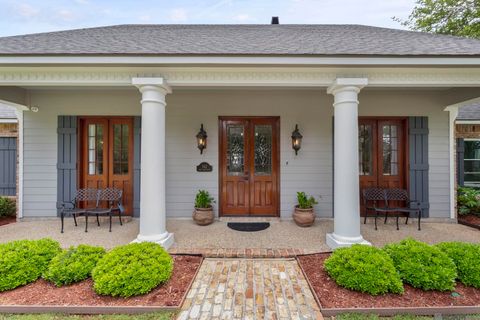
7935 Seville Ct, Baton Rouge, LA 70820
$72
Cash flow
1.3%
Cash-on-Cash Return
6.0%
Cap rate
0.8%
Rent to Value Ratio

Active
$505,000
4
bds
|
3
ba
|
3,288
sqft
|
built
1968
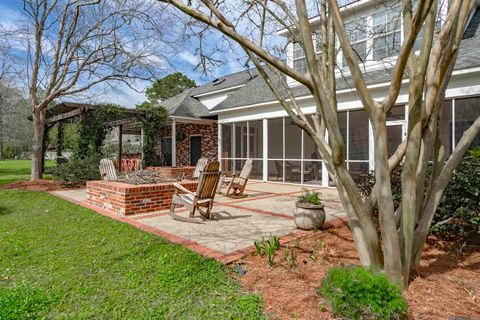
4075 N Bluebonnet Rd, Baton Rouge, LA 70809
$-646
Cash flow
-6.7%
Cash-on-Cash Return
4.1%
Cap rate
0.5%
Rent to Value Ratio

Active
$365,000
6
bds
|
3
ba
|
4,000
sqft
|
built
1965
1044 Sherwood Forest Blvd, Baton Rouge, LA 70815
$205
Cash flow
2.9%
Cash-on-Cash Return
6.4%
Cap rate
0.8%
Rent to Value Ratio
Pending
$260,000
3
bds
|
2
ba
|
1,648
sqft
|
built
2012
6535 Cameren Oaks Dr, Baton Rouge, LA 70817
$117
Cash flow
2.3%
Cash-on-Cash Return
6.2%
Cap rate
0.8%
Rent to Value Ratio

Active
$274,000
3
bds
|
2
ba
|
1,949
sqft
|
built
1998
313 Allan Dr, Baton Rouge, LA 70815
$83
Cash flow
1.6%
Cash-on-Cash Return
6.0%
Cap rate
0.7%
Rent to Value Ratio
Active
$350,000
4
bds
|
3
ba
|
3,485
sqft
|
built
1982
3633 Sessions Dr, Baton Rouge, LA 70816
$470
Cash flow
7.0%
Cash-on-Cash Return
7.3%
Cap rate
0.9%
Rent to Value Ratio

Active
$207,000
2
bds
|
2
ba
|
1,785
sqft
|
built
1981
220 Mc Gehee Dr, Baton Rouge, LA 70815
$-46
Cash flow
-1.2%
Cash-on-Cash Return
5.4%
Cap rate
0.8%
Rent to Value Ratio
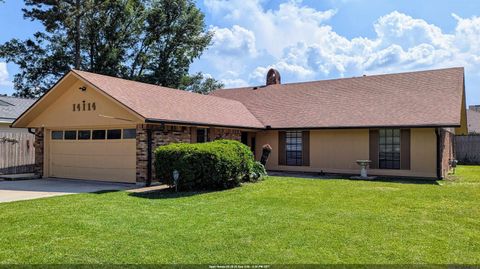
Active
$249,900
3
bds
|
2
ba
|
1,978
sqft
|
built
1978
14114 Pinehurst Ave, Baton Rouge, LA 70817
$175
Cash flow
3.7%
Cash-on-Cash Return
6.5%
Cap rate
0.8%
Rent to Value Ratio

Pending
$59,900
2
bds
|
1
ba
|
985
sqft
|
built
1985
2855 Navajo St, Baton Rouge, LA 70805
$690
Cash flow
13.4%
Cash-on-Cash Return
13.8%
Cap rate
1.7%
Rent to Value Ratio

Active
$165,000
3
bds
|
2
ba
|
1,371
sqft
|
built
1960
2627 Edgewood Dr, Baton Rouge, LA 70802
$-22
Cash flow
-0.7%
Cash-on-Cash Return
5.5%
Cap rate
0.7%
Rent to Value Ratio
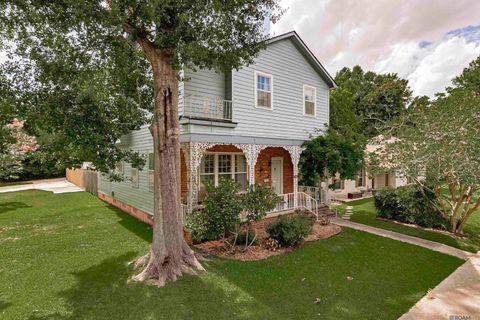
Active
$355,000
5
bds
|
3
ba
|
2,924
sqft
|
built
1910
1040 S Eugene St, Baton Rouge, LA 70806
$-438
Cash flow
-6.4%
Cash-on-Cash Return
4.2%
Cap rate
0.5%
Rent to Value Ratio

Active
$204,900
3
bds
|
2
ba
|
2,143
sqft
|
built
1962
1337 Savanna View Dr, Baton Rouge, LA 70810
$410
Cash flow
10.4%
Cash-on-Cash Return
8.1%
Cap rate
1.0%
Rent to Value Ratio

Active
$310,000
4
bds
|
3
ba
|
2,801
sqft
|
built
1979
4505 Lake Sherwood Ave E, Baton Rouge, LA 70816
$215
Cash flow
3.6%
Cash-on-Cash Return
6.5%
Cap rate
0.8%
Rent to Value Ratio

Pending
$145,000
3
bds
|
2
ba
|
1,477
sqft
|
built
1983
1514 Sharlo Ave, Baton Rouge, LA 70820
$378
Cash flow
13.6%
Cash-on-Cash Return
8.8%
Cap rate
1.1%
Rent to Value Ratio

Active
$835,000
3
bds
|
2
ba
|
2,970
sqft
|
built
2001
14421 Highland Rd, Baton Rouge, LA 70810
$-846
Cash flow
-5.3%
Cash-on-Cash Return
4.5%
Cap rate
0.5%
Rent to Value Ratio
Active
$12,500
2
bds
|
1
ba
|
700
sqft
|
built
1974
5169 Annette St, Baton Rouge, LA 70805
$759
Cash flow
70.7%
Cash-on-Cash Return
72.9%
Cap rate
8.8%
Rent to Value Ratio
Active
$19,999
3
bds
|
2
ba
|
1,558
sqft
|
built
1970
4723 Madison Ave, Baton Rouge, LA 70802
$828
Cash flow
48.2%
Cash-on-Cash Return
49.7%
Cap rate
6.0%
Rent to Value Ratio

Active
$77,900
4
bds
|
1
ba
|
1,552
sqft
|
built
1983
2301 N 20th St, Baton Rouge, LA 70802
$459
Cash flow
30.7%
Cash-on-Cash Return
12.8%
Cap rate
1.5%
Rent to Value Ratio

Active
$389,000
4
bds
|
3
ba
|
3,810
sqft
|
built
1984
6011 Riverbend Blvd, Baton Rouge, LA 70820
$635
Cash flow
8.5%
Cash-on-Cash Return
7.6%
Cap rate
0.9%
Rent to Value Ratio

Active
$229,900
3
bds
|
2
ba
|
1,355
sqft
|
built
1998
5684 Ducros Dr, Baton Rouge, LA 70820
$101
Cash flow
2.3%
Cash-on-Cash Return
6.2%
Cap rate
0.8%
Rent to Value Ratio

Active
$250,000
3
bds
|
2
ba
|
2,617
sqft
|
built
1995
10931 Stanley Aubin Ln, Baton Rouge, LA 70816
$335
Cash flow
7.0%
Cash-on-Cash Return
7.3%
Cap rate
0.9%
Rent to Value Ratio
Active
$814,900
4
bds
|
4
ba
|
3,860
sqft
|
built
1983
542 High Lake Dr, Baton Rouge, LA 70810
$-1,666
Cash flow
-10.7%
Cash-on-Cash Return
3.2%
Cap rate
0.4%
Rent to Value Ratio

Active
$533,000
5
bds
|
3
ba
|
2,921
sqft
|
built
2021
14142 Dew Point Ave, Baton Rouge, LA 70818
$-653
Cash flow
-6.4%
Cash-on-Cash Return
4.2%
Cap rate
0.5%
Rent to Value Ratio
Pending
$220,000
bds
|
0
ba
|
2,281
sqft
|
built
12549 Lorna Ave, Baton Rouge, LA 70815
$-144
Cash flow
-3.4%
Cash-on-Cash Return
4.9%
Cap rate
0.6%
Rent to Value Ratio

Pending
$670,000
4
bds
|
3
ba
|
2,733
sqft
|
built
1986
623 Ursuline Dr, Baton Rouge, LA 70808
$-687
Cash flow
-5.3%
Cash-on-Cash Return
4.4%
Cap rate
0.5%
Rent to Value Ratio

Active
$699,900
4
bds
|
4
ba
|
2,531
sqft
|
built
2015
2063 Rue Venelle, Baton Rouge, LA 70808
$-1,295
Cash flow
-9.7%
Cash-on-Cash Return
3.5%
Cap rate
0.5%
Rent to Value Ratio

Active
$1,660,000
5
bds
|
6
ba
|
5,179
sqft
|
built
2005
2611 Cedar Lodge Dr, Baton Rouge, LA 70809
$-3,165
Cash flow
-9.9%
Cash-on-Cash Return
3.4%
Cap rate
0.4%
Rent to Value Ratio

Active
$519,900
4
bds
|
3
ba
|
2,796
sqft
|
built
2006
3828 Twelve Oaks Ave, Baton Rouge, LA 70820
$-538
Cash flow
-5.4%
Cash-on-Cash Return
4.4%
Cap rate
0.5%
Rent to Value Ratio

Active
$2,449,000
6
bds
|
8
ba
|
5,266
sqft
|
built
1994
19420 N Muirfield Cir, Baton Rouge, LA 70810
$-8,759
Cash flow
-18.7%
Cash-on-Cash Return
1.4%
Cap rate
0.2%
Rent to Value Ratio
Active
$299,000
2
bds
|
0
ba
|
3,648
sqft
|
built
4555 Alvin Dark Ave, Baton Rouge, LA 70820
$-863
Cash flow
-15.1%
Cash-on-Cash Return
2.2%
Cap rate
0.3%
Rent to Value Ratio
Active
$875,000
4
bds
|
5
ba
|
4,550
sqft
|
built
1993
2806 Dakin Ave, Baton Rouge, LA 70820
$-773
Cash flow
-4.6%
Cash-on-Cash Return
4.6%
Cap rate
0.6%
Rent to Value Ratio

Active
$365,000
4
bds
|
3
ba
|
2,828
sqft
|
built
1960
5667 Asphodel Dr, Baton Rouge, LA 70806
$-209
Cash flow
-3.0%
Cash-on-Cash Return
5.0%
Cap rate
0.6%
Rent to Value Ratio

Active
$2,349,000
3
bds
|
3
ba
|
3,186
sqft
|
built
2003
16056 Highland Bluff Ct, Baton Rouge, LA 70810
$-6,790
Cash flow
-15.1%
Cash-on-Cash Return
2.2%
Cap rate
0.3%
Rent to Value Ratio

Active
$995,000
5
bds
|
4
ba
|
4,211
sqft
|
built
2006
6735 Rue Bocage, Baton Rouge, LA 70809
$-545
Cash flow
-2.9%
Cash-on-Cash Return
5.0%
Cap rate
0.6%
Rent to Value Ratio

Active
$1,111,111
4
bds
|
4
ba
|
3,705
sqft
|
built
1985
213 W Woodgate Ct, Baton Rouge, LA 70808
$-3,422
Cash flow
-16.1%
Cash-on-Cash Return
2.0%
Cap rate
0.2%
Rent to Value Ratio

Active
$569,900
4
bds
|
3
ba
|
3,818
sqft
|
built
1952
3343 Hyacinth Ave, Baton Rouge, LA 70808
$-221
Cash flow
-2.0%
Cash-on-Cash Return
5.2%
Cap rate
0.6%
Rent to Value Ratio

Active
$1,285,000
4
bds
|
4
ba
|
4,723
sqft
|
built
1979
8753 W Fairway Dr, Baton Rouge, LA 70809
$-2,286
Cash flow
-9.3%
Cash-on-Cash Return
3.5%
Cap rate
0.4%
Rent to Value Ratio

Pending
$440,000
4
bds
|
3
ba
|
2,488
sqft
|
built
1978
7726 Lew Hoad Ave, Baton Rouge, LA 70810
$-154
Cash flow
-1.8%
Cash-on-Cash Return
5.3%
Cap rate
0.6%
Rent to Value Ratio

Active
$950,000
5
bds
|
5
ba
|
4,038
sqft
|
built
2018
18219 Woodland Cove Dr, Baton Rouge, LA 70817
$-1,157
Cash flow
-6.4%
Cash-on-Cash Return
4.2%
Cap rate
0.5%
Rent to Value Ratio

Active
$45,000
2
bds
|
1
ba
|
781
sqft
|
built
1975
3339 Wenonah St, Baton Rouge, LA 70805
$552
Cash flow
14.3%
Cash-on-Cash Return
14.7%
Cap rate
1.8%
Rent to Value Ratio