Baton Rouge, LA Investment Properties for Sale
Browse homes for sale and investment properties in Baton Rouge, LA. Refine your search by price, property type, or more.
Best cash flowing properties in Baton Rouge, LA

Active
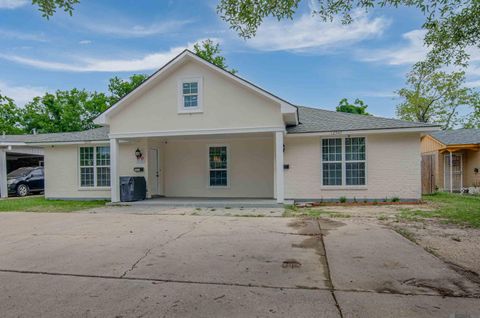
$70,000
2
bds
|
1
ba
|
750
sqft
|
built
1950
3536 Chippewa St, Baton Rouge, LA 70805
$828
Cash flow
13.8%
Cash-on-Cash Return
14.2%
Cap rate
1.7%
Rent to Value Ratio

Active
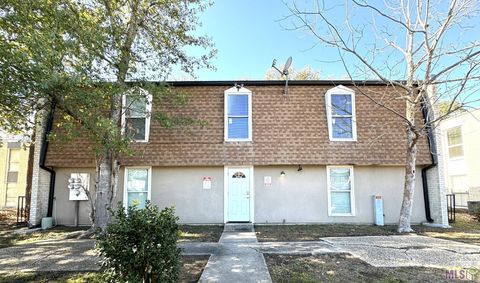
$30,900
2
bds
|
1
ba
|
1,000
sqft
|
built
1973
5176 Enterprise St, Baton Rouge, LA 70805
$621
Cash flow
23.4%
Cash-on-Cash Return
24.1%
Cap rate
2.9%
Rent to Value Ratio
969 out of 1,251 properties for sale in Baton Rouge, LA
Limited Results Shown
Create a free account, or log in to reveal all property listings and enjoy the complete experience.
Pending
$220,000
bds
|
0
ba
|
2,281
sqft
|
built
12549 Lorna Ave, Baton Rouge, LA 70815
$-252
Cash flow
-6.0%
Cash-on-Cash Return
4.9%
Cap rate
0.6%
Rent to Value Ratio

Active
$1,285,000
4
bds
|
4
ba
|
4,723
sqft
|
built
1979
8753 W Fairway Dr, Baton Rouge, LA 70809
$-2,914
Cash flow
-11.8%
Cash-on-Cash Return
3.5%
Cap rate
0.4%
Rent to Value Ratio

Active
$275,000
3
bds
|
2
ba
|
1,654
sqft
|
built
1998
13432 Natchez Ct, Baton Rouge, LA 70810
$-545
Cash flow
-10.3%
Cash-on-Cash Return
3.9%
Cap rate
0.5%
Rent to Value Ratio

Active
$585,000
4
bds
|
4
ba
|
3,911
sqft
|
built
2002
3146 Silver Sand Dr, Baton Rouge, LA 70816
$-396
Cash flow
-3.5%
Cash-on-Cash Return
5.5%
Cap rate
0.7%
Rent to Value Ratio
Active
$299,000
2
bds
|
0
ba
|
3,648
sqft
|
built
4555 Alvin Dark Ave, Baton Rouge, LA 70820
$-1,009
Cash flow
-17.6%
Cash-on-Cash Return
2.2%
Cap rate
0.3%
Rent to Value Ratio

Active
$569,900
4
bds
|
3
ba
|
3,818
sqft
|
built
1952
3343 Hyacinth Ave, Baton Rouge, LA 70808
$-499
Cash flow
-4.6%
Cash-on-Cash Return
5.2%
Cap rate
0.6%
Rent to Value Ratio
Active
$585,000
3
bds
|
3
ba
|
1,956
sqft
|
built
2022
5321 N Pointer Ct, Baton Rouge, LA 70808
$-830
Cash flow
-7.4%
Cash-on-Cash Return
4.6%
Cap rate
0.6%
Rent to Value Ratio

Active
$775,000
4
bds
|
3
ba
|
3,300
sqft
|
built
1994
18030 Cascades Ave, Baton Rouge, LA 70810
$-1,896
Cash flow
-12.8%
Cash-on-Cash Return
3.3%
Cap rate
0.5%
Rent to Value Ratio

Active
$749,900
4
bds
|
4
ba
|
3,424
sqft
|
built
1960
6565 Sevenoaks Ave, Baton Rouge, LA 70806
$-2,190
Cash flow
-15.2%
Cash-on-Cash Return
2.8%
Cap rate
0.3%
Rent to Value Ratio

Active
$499,900
3
bds
|
2
ba
|
2,027
sqft
|
built
1949
418 Kenwood Ave, Baton Rouge, LA 70806
$-816
Cash flow
-8.5%
Cash-on-Cash Return
4.3%
Cap rate
0.5%
Rent to Value Ratio
Active
$350,000
4
bds
|
2
ba
|
1,977
sqft
|
built
1978
17012 Sharpsburg Ave, Baton Rouge, LA 70817
$-450
Cash flow
-6.7%
Cash-on-Cash Return
4.7%
Cap rate
0.6%
Rent to Value Ratio

Active
$4,995,000
6
bds
|
7
ba
|
6,494
sqft
|
built
1953
6326 Highland Rd, Baton Rouge, LA 70808
$-23,387
Cash flow
-24.4%
Cash-on-Cash Return
0.6%
Cap rate
0.1%
Rent to Value Ratio
Active
$735,000
3
bds
|
3
ba
|
2,685
sqft
|
built
1999
1650 Cameron Ave, Baton Rouge, LA 70806
$-1,146
Cash flow
-8.1%
Cash-on-Cash Return
4.4%
Cap rate
0.5%
Rent to Value Ratio
Active
$244,900
3
bds
|
2
ba
|
1,611
sqft
|
built
1975
9741 Buttercup Dr, Baton Rouge, LA 70809
$-37
Cash flow
-0.8%
Cash-on-Cash Return
6.1%
Cap rate
0.7%
Rent to Value Ratio
Active
$749,000
4
bds
|
4
ba
|
3,865
sqft
|
built
1984
931 Woodstone Dr, Baton Rouge, LA 70808
$-1,200
Cash flow
-8.4%
Cash-on-Cash Return
4.3%
Cap rate
0.5%
Rent to Value Ratio
Active
$320,000
4
bds
|
3
ba
|
3,361
sqft
|
built
1974
7711 Tipperary Dr, Baton Rouge, LA 70808
$-84
Cash flow
-1.4%
Cash-on-Cash Return
6.0%
Cap rate
0.7%
Rent to Value Ratio
Active
$425,000
3
bds
|
2
ba
|
2,170
sqft
|
built
1969
3755 Drusilla Dr, Baton Rouge, LA 70809
$-287
Cash flow
-3.5%
Cash-on-Cash Return
5.5%
Cap rate
0.7%
Rent to Value Ratio

Active
$119,000
3
bds
|
2
ba
|
1,020
sqft
|
built
1960
1606 Myrtle Walk, Baton Rouge, LA 70802
$69
Cash flow
3.0%
Cash-on-Cash Return
7.0%
Cap rate
0.8%
Rent to Value Ratio
Pending
$315,000
3
bds
|
2
ba
|
1,723
sqft
|
built
1999
17666 Lake Azalea Dr, Baton Rouge, LA 70817
$-140
Cash flow
-2.3%
Cash-on-Cash Return
5.7%
Cap rate
0.7%
Rent to Value Ratio

Active
$285,000
3
bds
|
2
ba
|
1,615
sqft
|
built
1996
3978 Meadow Ridge Dr, Baton Rouge, LA 70817
$-261
Cash flow
-4.8%
Cash-on-Cash Return
5.2%
Cap rate
0.6%
Rent to Value Ratio
Pending
$299,000
5
bds
|
2
ba
|
1,905
sqft
|
built
1978
1275 Crescent Dr, Baton Rouge, LA 70806
$-181
Cash flow
-3.2%
Cash-on-Cash Return
5.5%
Cap rate
0.7%
Rent to Value Ratio
Active
$235,000
3
bds
|
2
ba
|
1,450
sqft
|
built
1990
17725 Nine Oaks Ave, Baton Rouge, LA 70817
$-123
Cash flow
-2.7%
Cash-on-Cash Return
5.6%
Cap rate
0.7%
Rent to Value Ratio

Active
$165,000
4
bds
|
2
ba
|
1,600
sqft
|
built
1989
1915 Tennessee St, Baton Rouge, LA 70802
$-102
Cash flow
-3.2%
Cash-on-Cash Return
5.5%
Cap rate
0.7%
Rent to Value Ratio
Active
$599,900
4
bds
|
4
ba
|
2,773
sqft
|
built
2007
3005 Rue D Orleans, Baton Rouge, LA 70810
$-865
Cash flow
-7.5%
Cash-on-Cash Return
4.5%
Cap rate
0.6%
Rent to Value Ratio
Active
$30,900
2
bds
|
1
ba
|
1,000
sqft
|
built
1973
5176 Enterprise St, Baton Rouge, LA 70805
$621
Cash flow
23.4%
Cash-on-Cash Return
24.1%
Cap rate
2.9%
Rent to Value Ratio

Active
$230,000
3
bds
|
2
ba
|
2,406
sqft
|
built
1965
11725 Glenhaven Dr, Baton Rouge, LA 70815
$179
Cash flow
4.1%
Cash-on-Cash Return
7.2%
Cap rate
0.9%
Rent to Value Ratio
Active
$272,000
4
bds
|
2
ba
|
2,184
sqft
|
built
1979
1341 S Flannery Rd, Baton Rouge, LA 70816
$-40
Cash flow
-0.8%
Cash-on-Cash Return
6.1%
Cap rate
0.7%
Rent to Value Ratio
Active
$392,500
4
bds
|
4
ba
|
2,069
sqft
|
built
2022
14334 Caroline Way, Baton Rouge, LA 70810
$-1,166
Cash flow
-15.5%
Cash-on-Cash Return
2.7%
Cap rate
0.4%
Rent to Value Ratio
Active
$500,000
4
bds
|
3
ba
|
2,286
sqft
|
built
2006
15505 Espirit Dr, Baton Rouge, LA 70810
$38
Cash flow
0.4%
Cash-on-Cash Return
6.4%
Cap rate
0.8%
Rent to Value Ratio
Active
$519,000
4
bds
|
3
ba
|
2,225
sqft
|
built
2021
245 Marion Dr, Baton Rouge, LA 70806
$-1,882
Cash flow
-18.9%
Cash-on-Cash Return
1.9%
Cap rate
0.2%
Rent to Value Ratio
Active
$479,900
4
bds
|
3
ba
|
2,642
sqft
|
built
1970
5977 Hyacinth Ave, Baton Rouge, LA 70808
$-780
Cash flow
-8.5%
Cash-on-Cash Return
4.3%
Cap rate
0.5%
Rent to Value Ratio

Active
$285,000
2
bds
|
1
ba
|
1,384
sqft
|
built
1920
614 Europe St, Baton Rouge, LA 70802
$-108
Cash flow
-2.0%
Cash-on-Cash Return
5.8%
Cap rate
0.7%
Rent to Value Ratio

Active
$99,900
2
bds
|
1
ba
|
640
sqft
|
built
1950
1351 W Roosevelt St, Baton Rouge, LA 70802
$99
Cash flow
5.2%
Cash-on-Cash Return
7.5%
Cap rate
0.9%
Rent to Value Ratio
Active
$70,000
2
bds
|
1
ba
|
750
sqft
|
built
1950
3536 Chippewa St, Baton Rouge, LA 70805
$828
Cash flow
13.8%
Cash-on-Cash Return
14.2%
Cap rate
1.7%
Rent to Value Ratio
Active
$145,000
3
bds
|
1
ba
|
1,075
sqft
|
built
1968
4111 Convention St, Baton Rouge, LA 70806
$209
Cash flow
7.5%
Cash-on-Cash Return
8.0%
Cap rate
1.0%
Rent to Value Ratio

Active
$225,000
3
bds
|
2
ba
|
1,536
sqft
|
built
1981
11843 Sage Dr, Baton Rouge, LA 70818
$67
Cash flow
1.6%
Cash-on-Cash Return
6.6%
Cap rate
0.8%
Rent to Value Ratio
Active
$425,000
4
bds
|
3
ba
|
2,954
sqft
|
built
1980
16039 Haynes Bluff Ave, Baton Rouge, LA 70817
$-83
Cash flow
-1.0%
Cash-on-Cash Return
6.0%
Cap rate
0.7%
Rent to Value Ratio
Active
$589,000
3
bds
|
4
ba
|
2,690
sqft
|
built
1930
2174 Wisteria St, Baton Rouge, LA 70806
$-867
Cash flow
-7.7%
Cash-on-Cash Return
4.5%
Cap rate
0.5%
Rent to Value Ratio

Pending
$325,000
3
bds
|
2
ba
|
1,810
sqft
|
built
2020
9036 Stonecroft Ave, Baton Rouge, LA 70810
$-14
Cash flow
-0.2%
Cash-on-Cash Return
6.2%
Cap rate
0.8%
Rent to Value Ratio
Active
$240,000
3
bds
|
2
ba
|
1,550
sqft
|
built
1980
2128 Elkwood Ave, Baton Rouge, LA 70816
$-149
Cash flow
-3.2%
Cash-on-Cash Return
5.5%
Cap rate
0.7%
Rent to Value Ratio