Benton, AR Investment Properties for Sale
Browse homes for sale and investment properties in Benton, AR. Refine your search by price, property type, or more.
Best cash flowing properties in Benton, AR
Active
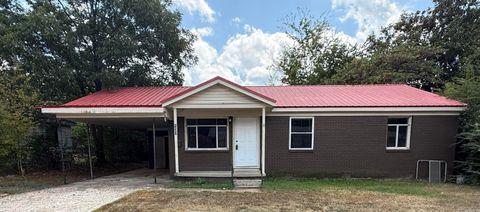
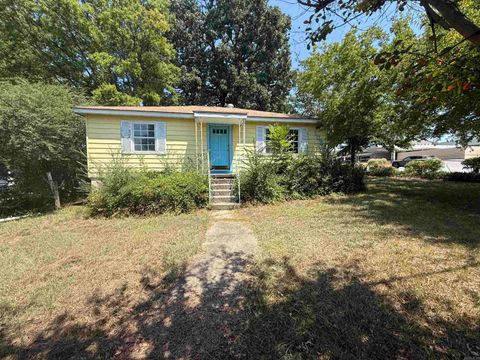
$135,000
3
bds
|
1
ba
|
1,026
sqft
|
built
1964
1007 Montclair St, Benton, AR 72015
$141
Cash flow
5.4%
Cash-on-Cash Return
6.9%
Cap rate
0.9%
Rent to Value Ratio

Active
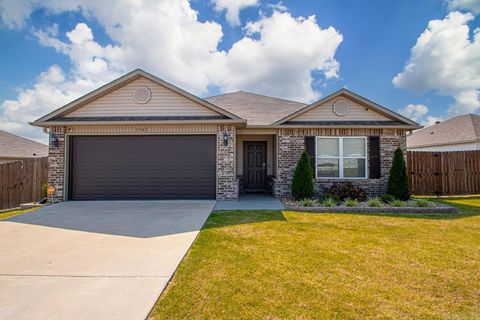
$203,700
3
bds
|
2
ba
|
1,619
sqft
|
built
2004
2016 U St, Benton, AR 72015
$140
Cash flow
3.6%
Cash-on-Cash Return
6.5%
Cap rate
0.8%
Rent to Value Ratio
96 out of 151 properties for sale in Benton, AR
Limited Results Shown
Create a free account, or log in to reveal all property listings and enjoy the complete experience.
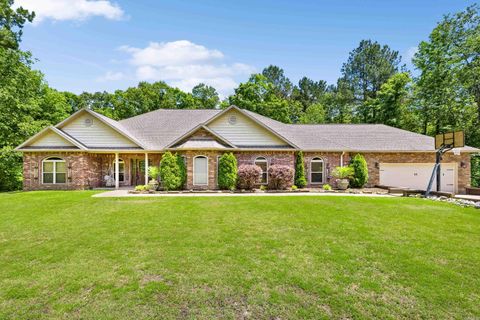
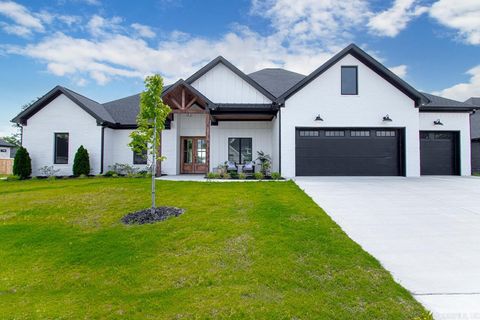
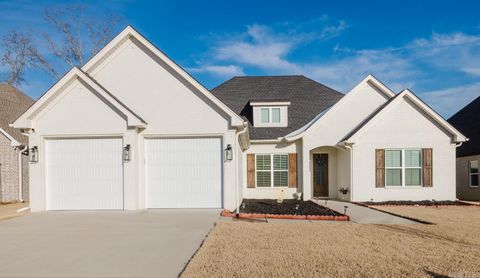
Active
$512,400
4
bds
|
3
ba
|
2,906
sqft
|
built
2012
402 Demuth Ln, Benton, AR 72019
$-974
Cash flow
-9.9%
Cash-on-Cash Return
3.4%
Cap rate
0.5%
Rent to Value Ratio
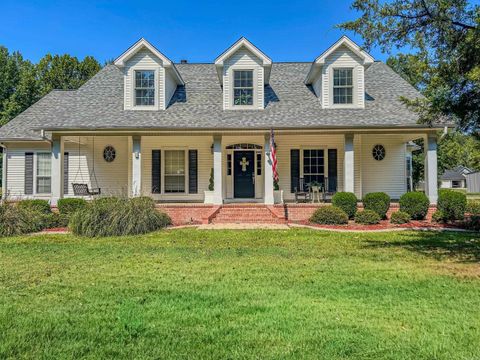
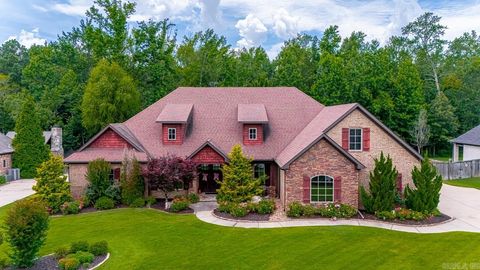
Active
$525,000
4
bds
|
4
ba
|
3,047
sqft
|
built
2002
8900 Hinkson Rd, Benton, AR 72019
$-1,234
Cash flow
-12.3%
Cash-on-Cash Return
2.9%
Cap rate
0.4%
Rent to Value Ratio
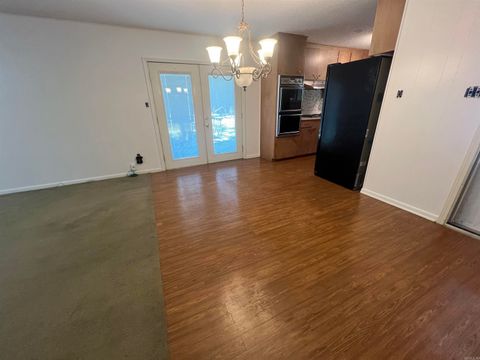
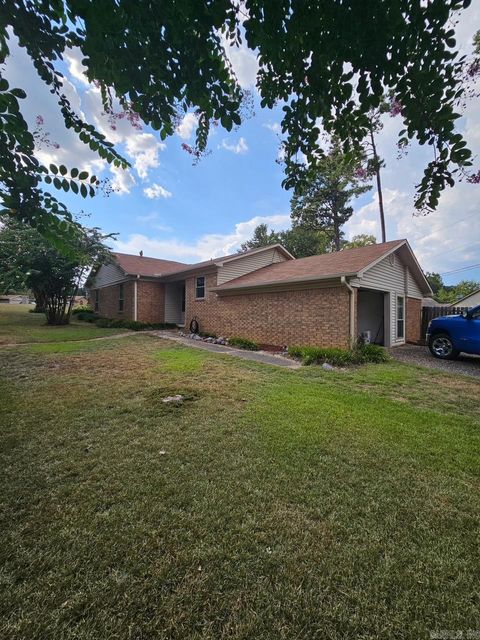
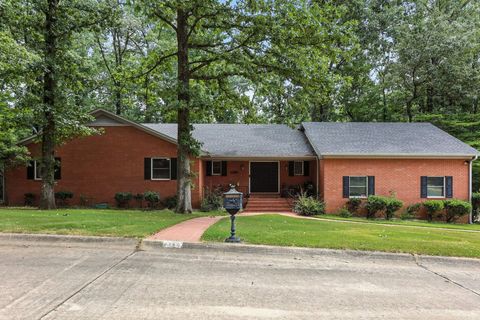
Active
$225,000
3
bds
|
2
ba
|
1,460
sqft
|
built
1964
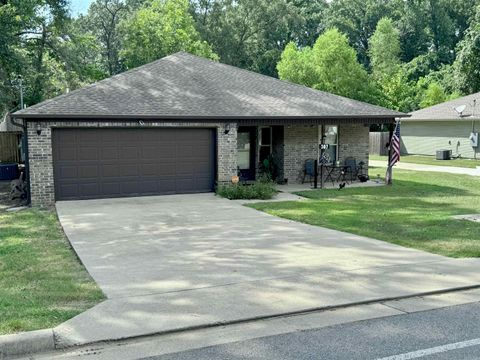
1522 Chris Dr, Benton, AR 72015
$-214
Cash flow
-5.0%
Cash-on-Cash Return
4.5%
Cap rate
0.6%
Rent to Value Ratio
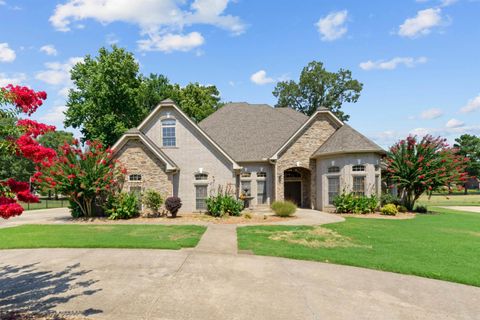
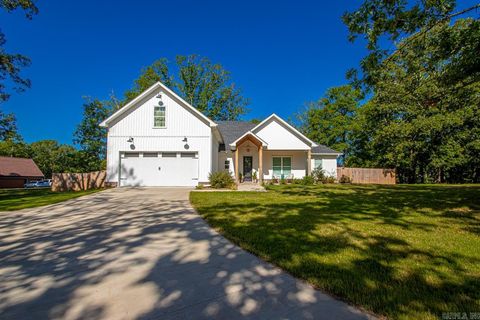
Active
$630,000
4
bds
|
4
ba
|
3,352
sqft
|
built
2023
4917 Lake Vista Dr, Benton, AR 72019
$-1,065
Cash flow
-8.8%
Cash-on-Cash Return
3.6%
Cap rate
0.6%
Rent to Value Ratio
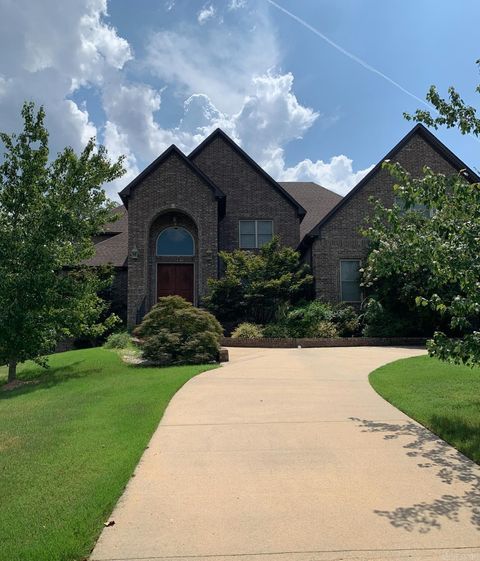
Active
$680,000
4
bds
|
5
ba
|
3,809
sqft
|
built
2013
6579 Westminster, Benton, AR 72019
$-1,352
Cash flow
-10.4%
Cash-on-Cash Return
3.3%
Cap rate
0.5%
Rent to Value Ratio
Active
$224,900
4
bds
|
2
ba
|
1,671
sqft
|
built
1976
1910 Harmon Dr, Benton, AR 72015
$-124
Cash flow
-2.9%
Cash-on-Cash Return
5.0%
Cap rate
0.7%
Rent to Value Ratio
Active
$550,000
5
bds
|
5
ba
|
3,689
sqft
|
built
2005
2816 Shadow Creek Dr, Benton, AR 72019
$-1,240
Cash flow
-11.8%
Cash-on-Cash Return
3.0%
Cap rate
0.5%
Rent to Value Ratio
Active
$260,000
4
bds
|
2
ba
|
1,647
sqft
|
built
2018
307 S Shady Ln, Benton, AR 72015
$-249
Cash flow
-5.0%
Cash-on-Cash Return
4.5%
Cap rate
0.6%
Rent to Value Ratio

Active
$215,000
3
bds
|
2
ba
|
1,363
sqft
|
built
2001
816 Coral Cv, Benton, AR 72015
$-12
Cash flow
-0.3%
Cash-on-Cash Return
5.6%
Cap rate
0.7%
Rent to Value Ratio
Active
$389,900
3
bds
|
2
ba
|
2,191
sqft
|
built
2022
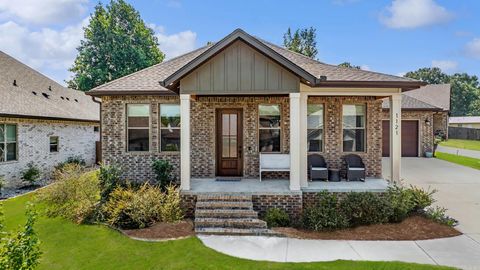
1121 Essex Dr, Benton, AR 72019
$-352
Cash flow
-4.7%
Cash-on-Cash Return
4.6%
Cap rate
0.7%
Rent to Value Ratio
Active
$210,000
3
bds
|
2
ba
|
1,620
sqft
|
built
1976
7967 Cindy Dr, Benton, AR 72019
$-15
Cash flow
-0.4%
Cash-on-Cash Return
5.6%
Cap rate
0.8%
Rent to Value Ratio
Active
$315,000
3
bds
|
3
ba
|
1,860
sqft
|
built
1991
7035 Point View Rd, Benton, AR 72015
$-471
Cash flow
-7.8%
Cash-on-Cash Return
3.9%
Cap rate
0.5%
Rent to Value Ratio
Active
$444,900
4
bds
|
3
ba
|
2,639
sqft
|
built
2022
7901 S Shoreline Blvd, Benton, AR 72019
$-539
Cash flow
-6.3%
Cash-on-Cash Return
4.2%
Cap rate
0.6%
Rent to Value Ratio
Active
$559,900
4
bds
|
3
ba
|
2,970
sqft
|
built
2022
4924 Lake Vista Dr, Benton, AR 72019
$-713
Cash flow
-6.6%
Cash-on-Cash Return
4.2%
Cap rate
0.6%
Rent to Value Ratio
Active
$165,000
3
bds
|
2
ba
|
1,148
sqft
|
built
1972
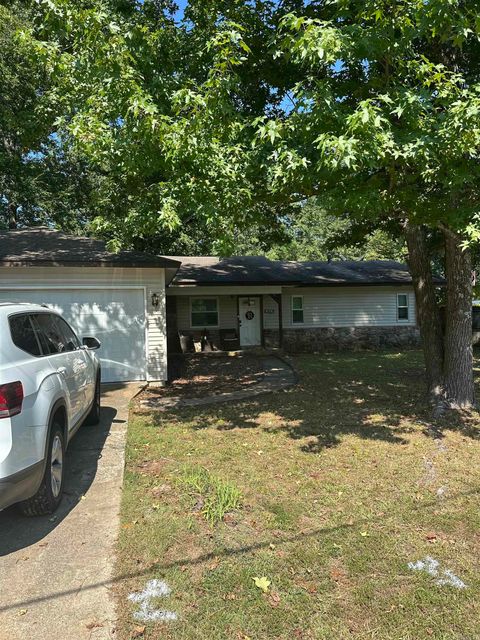
2725 Burchwood Dr, Benton, AR 72019
$129
Cash flow
4.1%
Cash-on-Cash Return
6.6%
Cap rate
0.8%
Rent to Value Ratio
Active
$174,900
3
bds
|
1
ba
|
1,754
sqft
|
built
1954
1109 Hester, Benton, AR 72015
$19
Cash flow
0.6%
Cash-on-Cash Return
5.8%
Cap rate
0.8%
Rent to Value Ratio
Active
$210,000
3
bds
|
2
ba
|
1,355
sqft
|
built
2021
3341 Wilshire Blvd, Benton, AR 72019
$-9
Cash flow
-0.2%
Cash-on-Cash Return
5.6%
Cap rate
0.8%
Rent to Value Ratio
Active
$179,000
3
bds
|
2
ba
|
1,368
sqft
|
built
1954
1022 E Sevier St, Benton, AR 72015
$53
Cash flow
1.5%
Cash-on-Cash Return
6.0%
Cap rate
0.8%
Rent to Value Ratio
Active
$229,000
3
bds
|
2
ba
|
1,516
sqft
|
built
2003
228 Sharron Oaks Ct, Benton, AR 72019
$-75
Cash flow
-1.7%
Cash-on-Cash Return
5.3%
Cap rate
0.7%
Rent to Value Ratio
Active
$259,000
3
bds
|
2
ba
|
1,588
sqft
|
built
1978
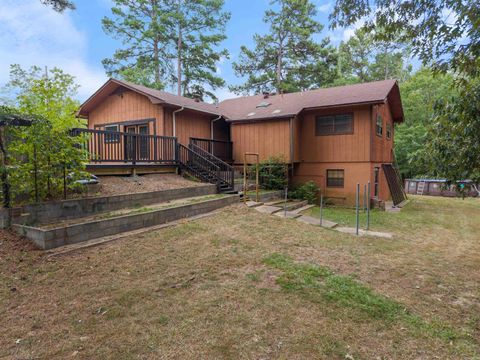
715 Rosewood Dr, Benton, AR 72015
$-304
Cash flow
-6.1%
Cash-on-Cash Return
4.3%
Cap rate
0.6%
Rent to Value Ratio
Active
$418,600
4
bds
|
3
ba
|
2,300
sqft
|
built
2022
7424 Northwood Dr, Benton, AR 72019
$-254
Cash flow
-3.2%
Cash-on-Cash Return
5.0%
Cap rate
0.6%
Rent to Value Ratio
Active
$370,000
3
bds
|
3
ba
|
2,654
sqft
|
built
1987
1190 Cambridge Cir, Benton, AR 72019
$-641
Cash flow
-9.0%
Cash-on-Cash Return
3.6%
Cap rate
0.5%
Rent to Value Ratio

Active
$223,000
3
bds
|
2
ba
|
1,284
sqft
|
built
2011
109 Riveria Cv, Benton, AR 72015
$-107
Cash flow
-2.5%
Cash-on-Cash Return
5.1%
Cap rate
0.7%
Rent to Value Ratio

Active
$255,000
3
bds
|
3
ba
|
1,704
sqft
|
built
2008
419 Sharron Oaks Ct, Benton, AR 72019
$-258
Cash flow
-5.3%
Cash-on-Cash Return
4.5%
Cap rate
0.6%
Rent to Value Ratio

Active
$335,000
4
bds
|
3
ba
|
2,300
sqft
|
built
2006
105 Valderrama Dr, Benton, AR 72015
$-455
Cash flow
-7.1%
Cash-on-Cash Return
4.0%
Cap rate
0.6%
Rent to Value Ratio

Active
$245,000
3
bds
|
3
ba
|
1,643
sqft
|
built
1944
506 W Conway St, Benton, AR 72015
$127
Cash flow
2.7%
Cash-on-Cash Return
6.3%
Cap rate
0.8%
Rent to Value Ratio

Active
$225,000
3
bds
|
2
ba
|
1,633
sqft
|
built
2023
1936 Auburn Hills Dr, Benton, AR 72015
$-188
Cash flow
-4.4%
Cash-on-Cash Return
4.7%
Cap rate
0.7%
Rent to Value Ratio
Active
$495,000
4
bds
|
3
ba
|
2,533
sqft
|
built
2023
5947 Beth Ln, Benton, AR 72019
$-672
Cash flow
-7.1%
Cash-on-Cash Return
4.0%
Cap rate
0.6%
Rent to Value Ratio
Active
$565,000
5
bds
|
4
ba
|
4,445
sqft
|
built
2013
7206 Worth Ave E, Benton, AR 72019
$-1,412
Cash flow
-13.0%
Cash-on-Cash Return
2.7%
Cap rate
0.4%
Rent to Value Ratio
Active
$219,950
3
bds
|
2
ba
|
1,581
sqft
|
built
2007
4321 Glenda Ln, Benton, AR 72019
$63
Cash flow
1.5%
Cash-on-Cash Return
6.0%
Cap rate
0.7%
Rent to Value Ratio
Active
$1,300,000
5
bds
|
6
ba
|
6,000
sqft
|
built
2023
6560 Westminster, Benton, AR 72019
$-5,182
Cash flow
-20.8%
Cash-on-Cash Return
0.9%
Cap rate
0.2%
Rent to Value Ratio
Active
$319,900
4
bds
|
3
ba
|
2,480
sqft
|
built
2004
1306 Oxford Ave, Benton, AR 72019
$-314
Cash flow
-5.1%
Cash-on-Cash Return
4.5%
Cap rate
0.6%
Rent to Value Ratio
Active
$252,500
4
bds
|
2
ba
|
1,670
sqft
|
built
2019
1009 Heritage Way, Benton, AR 72019
$-130
Cash flow
-2.7%
Cash-on-Cash Return
5.1%
Cap rate
0.7%
Rent to Value Ratio
Active
$563,000
4
bds
|
3
ba
|
2,925
sqft
|
built
2022
7400 Northwood Dr, Benton, AR 72019
$-862
Cash flow
-8.0%
Cash-on-Cash Return
3.8%
Cap rate
0.6%
Rent to Value Ratio

Active
$265,000
4
bds
|
3
ba
|
1,893
sqft
|
built
2001
3712 Hazelwood Dr, Benton, AR 72015
$-175
Cash flow
-3.4%
Cash-on-Cash Return
4.9%
Cap rate
0.7%
Rent to Value Ratio

Active
$279,000
4
bds
|
2
ba
|
1,917
sqft
|
built
2022
3002 Sue St, Benton, AR 72015
$-172
Cash flow
-3.2%
Cash-on-Cash Return
4.9%
Cap rate
0.7%
Rent to Value Ratio
Active
$284,500
4
bds
|
2
ba
|
1,742
sqft
|
built
2018
3168 Haley Ct, Benton, AR 72019
$-271
Cash flow
-5.0%
Cash-on-Cash Return
4.5%
Cap rate
0.6%
Rent to Value Ratio
Active
$249,900
3
bds
|
2
ba
|
1,502
sqft
|
built
2007
1641 White Oak Cir, Benton, AR 72019
$-225
Cash flow
-4.7%
Cash-on-Cash Return
4.6%
Cap rate
0.6%
Rent to Value Ratio