Memphis, TN Investment Properties for Sale
Browse homes for sale and investment properties in Memphis, TN. Refine your search by price, property type, or more.
Best cash flowing properties in Memphis, TN
Active
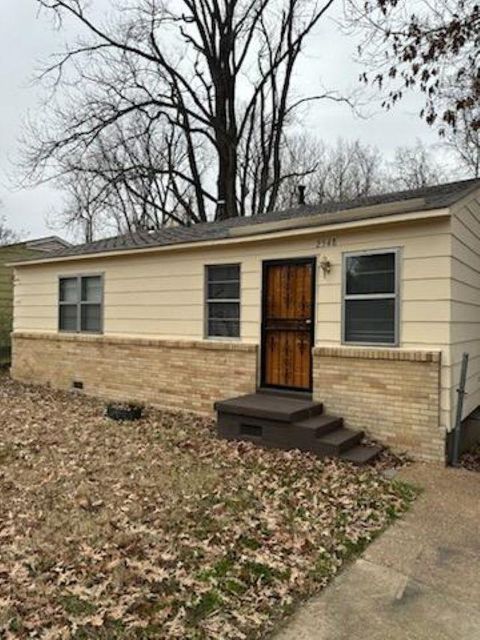
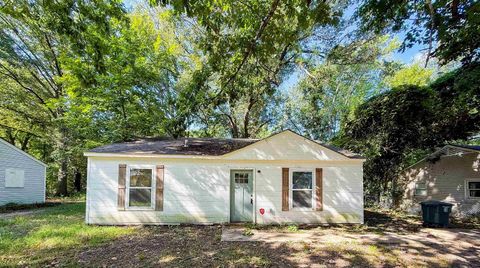
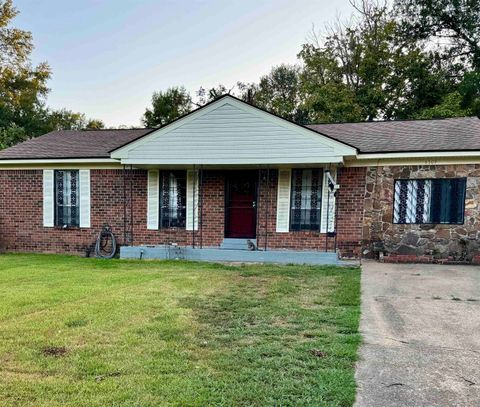
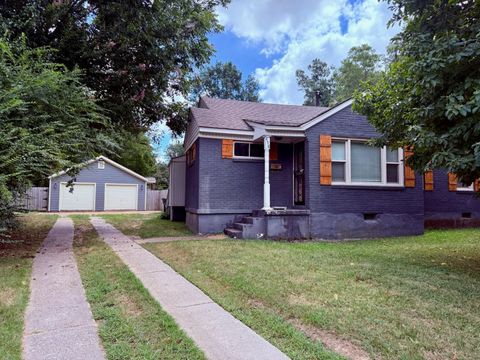
$67,850
3
bds
|
1
ba
|
0
sqft
|
built
1959
2548 Sunny Hill Dr, Memphis, TN 38127
$711
Cash flow
12.2%
Cash-on-Cash Return
12.6%
Cap rate
1.6%
Rent to Value Ratio
Active
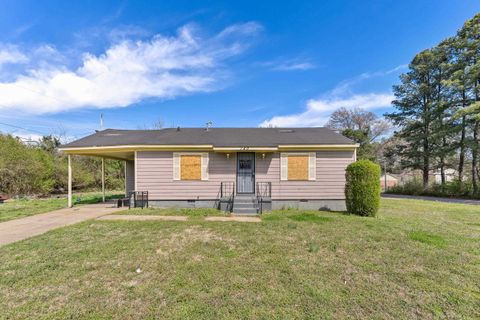
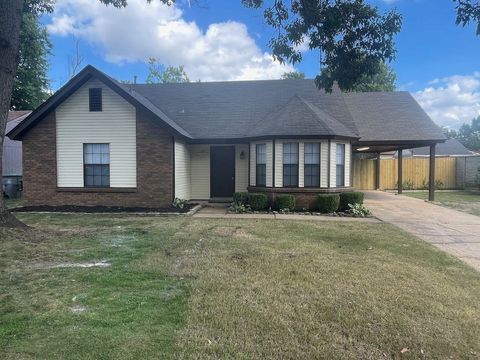
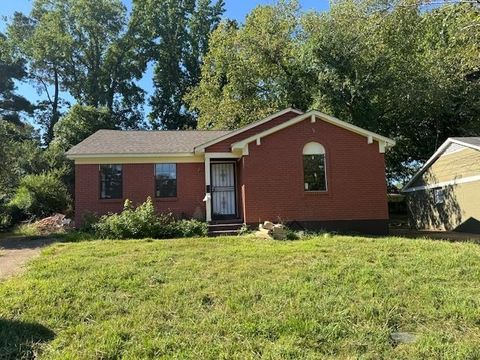
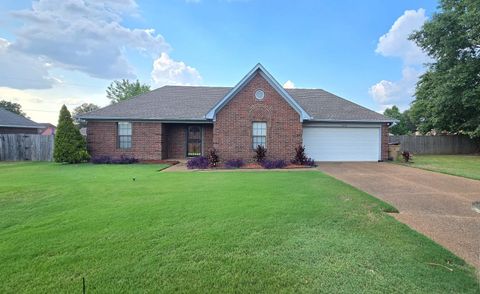
$80,000
3
bds
|
1
ba
|
0
sqft
|
built
1961
140 E Shelby Dr, Memphis, TN 38109
$433
Cash flow
28.2%
Cash-on-Cash Return
12.2%
Cap rate
1.6%
Rent to Value Ratio
1,370 out of 1,471 properties for sale in Memphis, TN
Limited Results Shown
Create a free account, or log in to reveal all property listings and enjoy the complete experience.
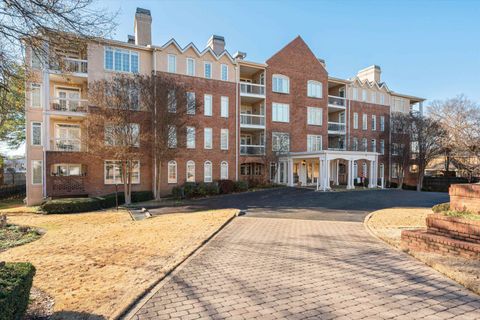
Active
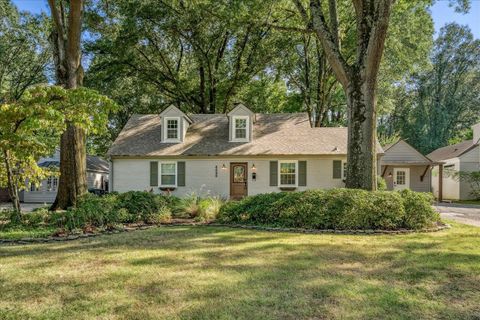
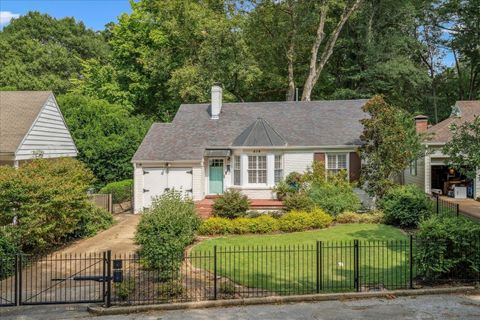
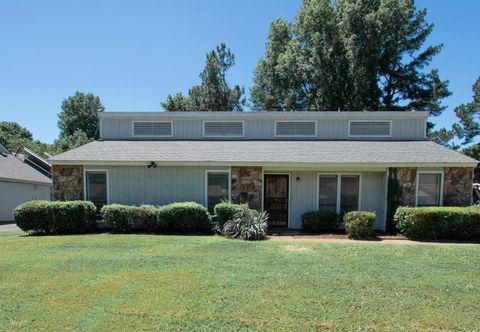
$565,000
4
bds
|
3
ba
|
0
sqft
|
built
1953
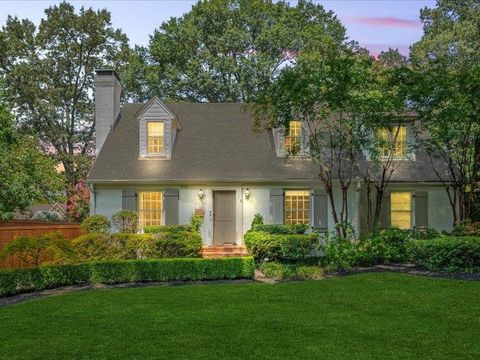
4525 Sequoia Ave, Memphis, TN 38117
$-445
Cash flow
-4.1%
Cash-on-Cash Return
4.7%
Cap rate
0.7%
Rent to Value Ratio
Active
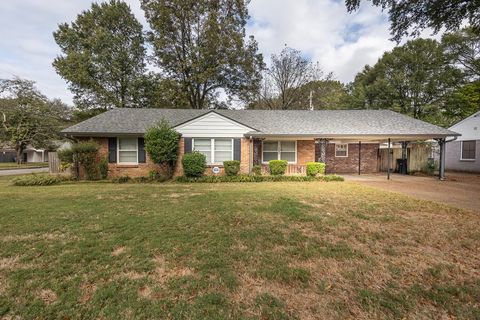
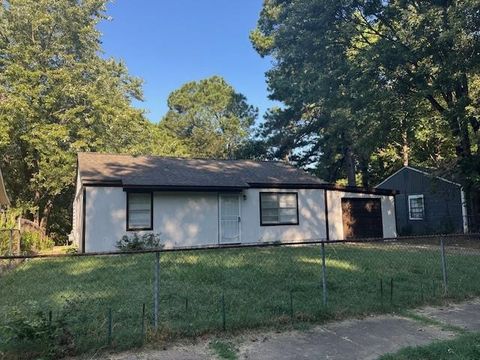
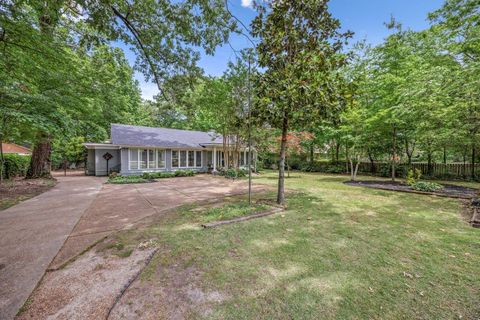
$279,900
3
bds
|
2
ba
|
0
sqft
|
built
1955
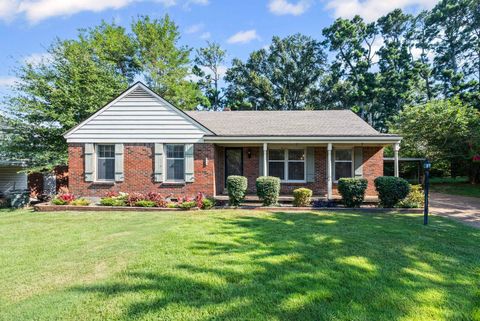
4888 Dee Rd, Memphis, TN 38117
$-281
Cash flow
-5.2%
Cash-on-Cash Return
4.5%
Cap rate
0.7%
Rent to Value Ratio
Active
$109,000
1
bds
|
1
ba
|
0
sqft
|
built
2006
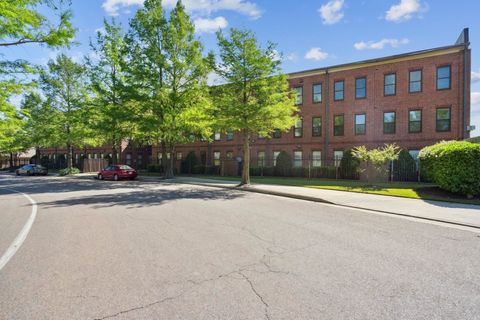
720 Litty Ct, Memphis, TN 38103
$68
Cash flow
3.3%
Cash-on-Cash Return
6.4%
Cap rate
1.0%
Rent to Value Ratio
Active
$245,000
4
bds
|
2
ba
|
0
sqft
|
built
1975
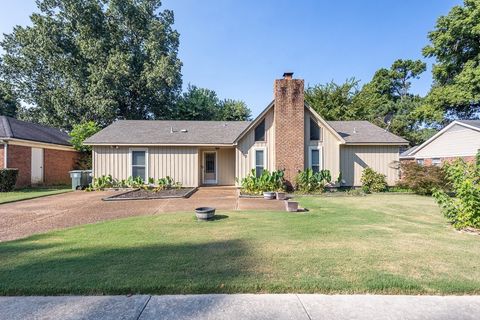
7153 Tulip Trail Dr, Memphis, TN 38133
$-233
Cash flow
-5.0%
Cash-on-Cash Return
4.5%
Cap rate
0.7%
Rent to Value Ratio
Active
$300,000
3
bds
|
3
ba
|
0
sqft
|
built
1955
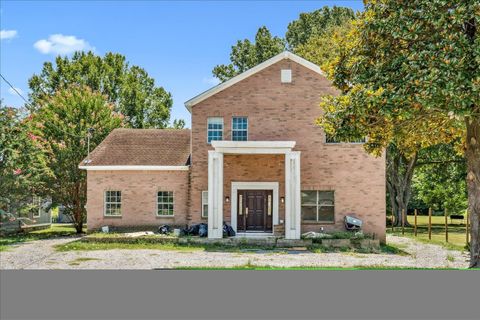
7723 Reese Rd, Memphis, TN 38133
$-336
Cash flow
-5.8%
Cash-on-Cash Return
4.3%
Cap rate
0.6%
Rent to Value Ratio
Active
$390,000
4
bds
|
3.1
ba
|
0
sqft
|
built
2006
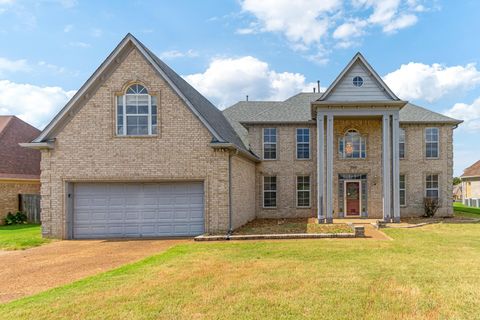
7548 Easterly Ln, Memphis, TN 38125
$-371
Cash flow
-5.0%
Cash-on-Cash Return
4.5%
Cap rate
0.6%
Rent to Value Ratio
Active
$98,000
3
bds
|
1
ba
|
0
sqft
|
built
1952
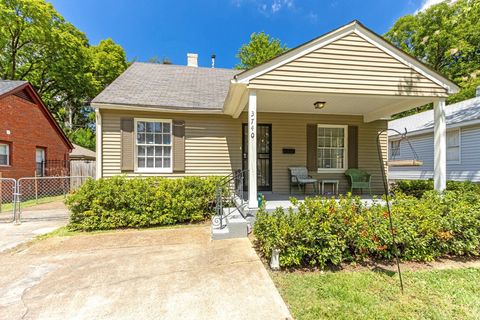
891 Par Ave, Memphis, TN 38127
$181
Cash flow
9.6%
Cash-on-Cash Return
7.9%
Cap rate
1.0%
Rent to Value Ratio
Active
$325,000
2
bds
|
2
ba
|
0
sqft
|
built
1944
414 Holmes Cir, Memphis, TN 38111
$-496
Cash flow
-8.0%
Cash-on-Cash Return
3.8%
Cap rate
0.6%
Rent to Value Ratio
Active
$224,500
3
bds
|
2
ba
|
0
sqft
|
built
1982
7270 Rose Trail Dr, Memphis, TN 38133
$-115
Cash flow
-2.7%
Cash-on-Cash Return
5.1%
Cap rate
0.7%
Rent to Value Ratio
Active
$95,000
4
bds
|
1
ba
|
0
sqft
|
built
1955
3603 Sunrise St, Memphis, TN 38127
$318
Cash flow
17.5%
Cash-on-Cash Return
9.7%
Cap rate
1.3%
Rent to Value Ratio
Active
$99,900
3
bds
|
1
ba
|
0
sqft
|
built
1968
4951 Shayne Ln, Memphis, TN 38109
$272
Cash flow
14.2%
Cash-on-Cash Return
8.9%
Cap rate
1.2%
Rent to Value Ratio
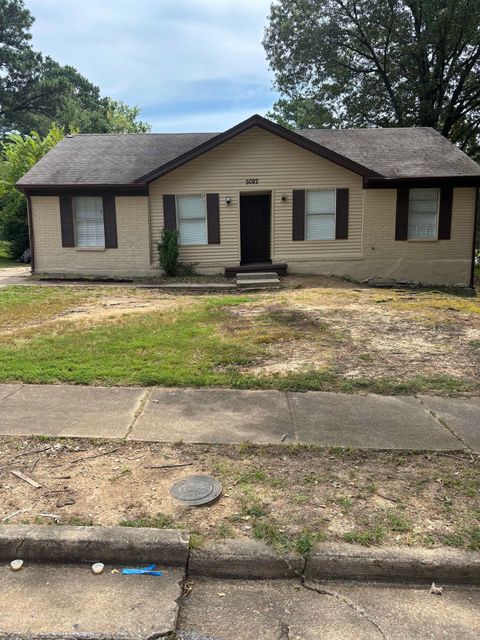
Active
$162,000
3
bds
|
2
ba
|
0
sqft
|
built
1972
5082 Golden Oaks Dr, Memphis, TN 38118
$-71
Cash flow
-2.3%
Cash-on-Cash Return
5.2%
Cap rate
0.7%
Rent to Value Ratio
Active
$225,000
3
bds
|
1
ba
|
0
sqft
|
built
1954
5067 Wingdale Rd, Memphis, TN 38117
$-174
Cash flow
-4.0%
Cash-on-Cash Return
4.8%
Cap rate
0.7%
Rent to Value Ratio
Active
$360,000
4
bds
|
2.1
ba
|
0
sqft
|
built
1969
2093 Hickory Crest Dr, Memphis, TN 38119
$-402
Cash flow
-5.8%
Cash-on-Cash Return
4.3%
Cap rate
0.7%
Rent to Value Ratio
Active
$159,000
3
bds
|
1
ba
|
0
sqft
|
built
1942
3740 Marion Ave, Memphis, TN 38111
$190
Cash flow
6.2%
Cash-on-Cash Return
7.1%
Cap rate
1.0%
Rent to Value Ratio
Active
$625,000
5
bds
|
3
ba
|
0
sqft
|
built
1952
4126 Kriter Ln, Memphis, TN 38117
$-832
Cash flow
-6.9%
Cash-on-Cash Return
4.1%
Cap rate
0.6%
Rent to Value Ratio
Active
$335,000
3
bds
|
2
ba
|
0
sqft
|
built
1956
446 Rosser Rd, Memphis, TN 38120
$-286
Cash flow
-4.5%
Cash-on-Cash Return
4.7%
Cap rate
0.7%
Rent to Value Ratio
Active
$185,000
1
bds
|
1
ba
|
0
sqft
|
built
1912
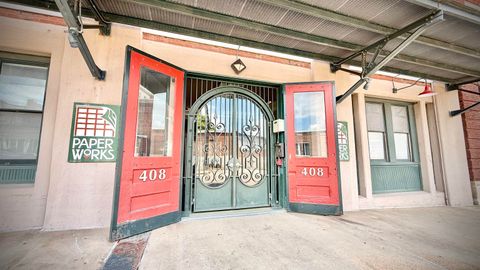
408 S Front St, Memphis, TN 38103
$-101
Cash flow
-2.8%
Cash-on-Cash Return
5.0%
Cap rate
0.8%
Rent to Value Ratio
Active
$110,000
3
bds
|
1
ba
|
0
sqft
|
built
1970
4509 Double Tree Rd, Memphis, TN 38109
$209
Cash flow
9.9%
Cash-on-Cash Return
8.0%
Cap rate
1.1%
Rent to Value Ratio
Active
$79,900
3
bds
|
1
ba
|
0
sqft
|
built
1971
3245 Abbottsford Ave, Memphis, TN 38128
$368
Cash flow
24.0%
Cash-on-Cash Return
11.2%
Cap rate
1.5%
Rent to Value Ratio
Active
$350,000
2
bds
|
2
ba
|
0
sqft
|
built
1990
405 S Perkins Rd, Memphis, TN 38117
$-542
Cash flow
-8.1%
Cash-on-Cash Return
3.8%
Cap rate
0.6%
Rent to Value Ratio
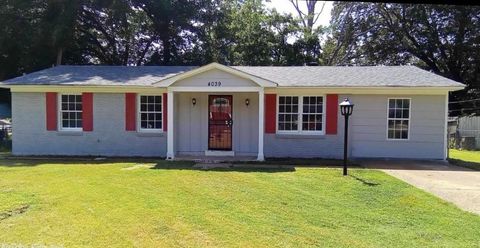
Active
$129,000
3
bds
|
1
ba
|
0
sqft
|
built
1962
4039 Trevathan Cir, Memphis, TN 38109
$267
Cash flow
10.8%
Cash-on-Cash Return
8.2%
Cap rate
1.1%
Rent to Value Ratio
Active
$165,000
1
bds
|
1
ba
|
0
sqft
|
built
1909
245 Madison Ave, Memphis, TN 38103
$109
Cash flow
3.4%
Cash-on-Cash Return
6.5%
Cap rate
1.0%
Rent to Value Ratio
Active
$275,000
4
bds
|
2
ba
|
0
sqft
|
built
1930
949 University St, Memphis, TN 38107
$-208
Cash flow
-3.9%
Cash-on-Cash Return
4.8%
Cap rate
0.7%
Rent to Value Ratio
Active
$155,000
3
bds
|
1.1
ba
|
0
sqft
|
built
1961
2230 Wellons Ave, Memphis, TN 38127
$176
Cash flow
5.9%
Cash-on-Cash Return
7.0%
Cap rate
1.0%
Rent to Value Ratio
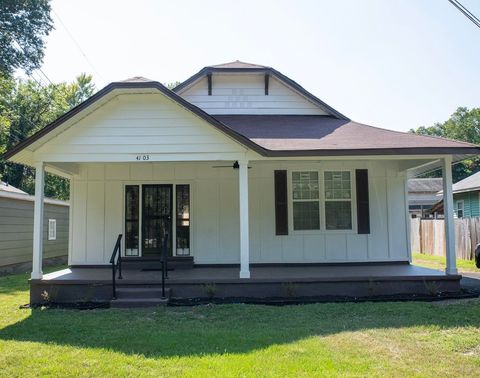
Active
$175,000
3
bds
|
2
ba
|
0
sqft
|
built
1910
4103 Orleans Rd, Memphis, TN 38116
$-10,934
Cash flow
-326.0%
Cash-on-Cash Return
-69.3%
Cap rate
0.7%
Rent to Value Ratio
Active
$274,900
4
bds
|
2
ba
|
0
sqft
|
built
1950
458 Gerald Rd, Memphis, TN 38122
$-234
Cash flow
-4.4%
Cash-on-Cash Return
4.7%
Cap rate
0.7%
Rent to Value Ratio
Active
$234,400
3
bds
|
2
ba
|
0
sqft
|
built
1992
6696 Autumn Wood Cv, Memphis, TN 38141
$17
Cash flow
0.4%
Cash-on-Cash Return
5.8%
Cap rate
0.8%
Rent to Value Ratio
Active
$165,000
3
bds
|
2
ba
|
0
sqft
|
built
1978
6167 Afternoon Ln, Memphis, TN 38141
$-37
Cash flow
-1.2%
Cash-on-Cash Return
5.4%
Cap rate
0.8%
Rent to Value Ratio

Active
$159,900
3
bds
|
2
ba
|
0
sqft
|
built
2004
4693 Waterfront Oak Dr, Memphis, TN 38128
$285
Cash flow
9.3%
Cash-on-Cash Return
7.8%
Cap rate
1.0%
Rent to Value Ratio
Active
$370,000
3
bds
|
3
ba
|
0
sqft
|
built
1954
5068 Walnut Grove Rd, Memphis, TN 38117
$-480
Cash flow
-6.8%
Cash-on-Cash Return
4.1%
Cap rate
0.7%
Rent to Value Ratio
Active
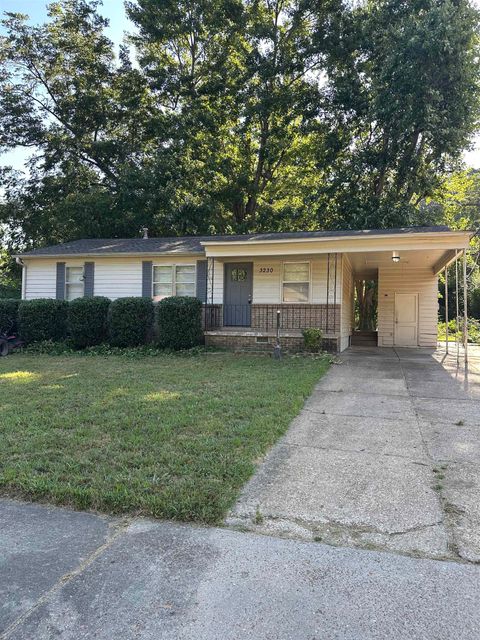
$89,900
3
bds
|
1
ba
|
0
sqft
|
built
1959
3230 Ardmore St, Memphis, TN 38127
$304
Cash flow
17.6%
Cash-on-Cash Return
9.7%
Cap rate
1.3%
Rent to Value Ratio
Active
$399,900
3
bds
|
2
ba
|
0
sqft
|
built
1944
200 Alexander St, Memphis, TN 38111
$-878
Cash flow
-11.5%
Cash-on-Cash Return
3.0%
Cap rate
0.5%
Rent to Value Ratio
Active
$390,000
3
bds
|
2
ba
|
0
sqft
|
built
1922
2082 Oliver Ave, Memphis, TN 38104
$-350
Cash flow
-4.7%
Cash-on-Cash Return
4.6%
Cap rate
0.7%
Rent to Value Ratio
Active
$129,900
4
bds
|
2
ba
|
0
sqft
|
built
1953
1947 Tulsa Ave, Memphis, TN 38127
$112
Cash flow
4.5%
Cash-on-Cash Return
6.7%
Cap rate
0.9%
Rent to Value Ratio
Active
$169,000
2
bds
|
2
ba
|
0
sqft
|
built
2007
3931 Old Allen Rd, Memphis, TN 38128
$-248
Cash flow
-7.7%
Cash-on-Cash Return
3.9%
Cap rate
0.6%
Rent to Value Ratio
Active
$859,000
4
bds
|
4
ba
|
0
sqft
|
built
1940
4209 Woodmere Cv, Memphis, TN 38117
$-1,407
Cash flow
-8.5%
Cash-on-Cash Return
3.7%
Cap rate
0.6%
Rent to Value Ratio
Active
$268,000
5
bds
|
2
ba
|
0
sqft
|
built
1944
781 S Graham St, Memphis, TN 38111
$-478
Cash flow
-9.3%
Cash-on-Cash Return
3.5%
Cap rate
0.5%
Rent to Value Ratio