Birmingham, AL Investment Properties for Sale
Browse homes for sale and investment properties in Birmingham, AL. Refine your search by price, property type, or more.
Best cash flowing properties in Birmingham, AL
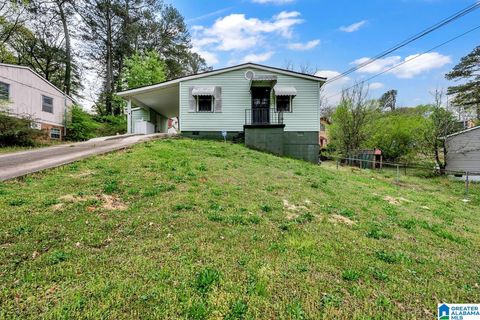
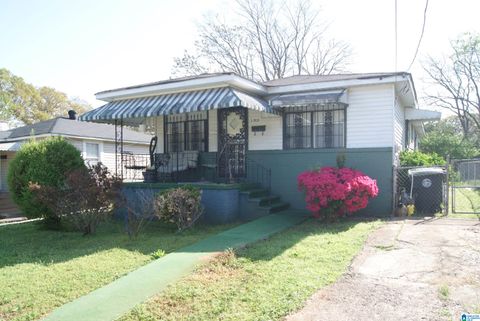
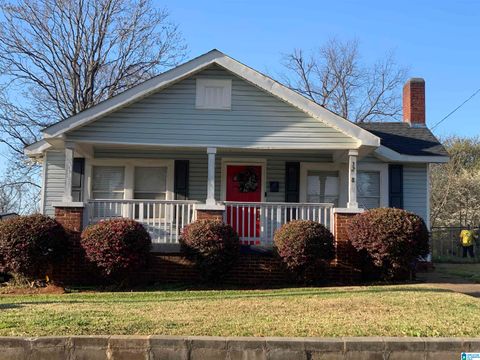
Active
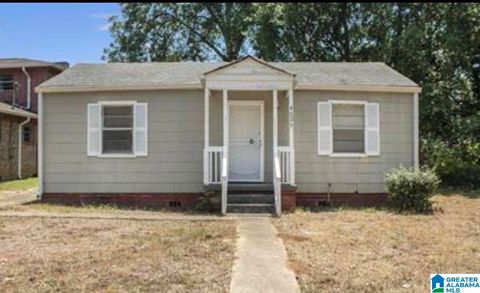
$56,900
3
bds
|
0
ba
|
1,332
sqft
|
built
1955
508 Rollingwood Rd, Birmingham, AL 35235
$966
Cash flow
19.8%
Cash-on-Cash Return
20.4%
Cap rate
2.5%
Rent to Value Ratio

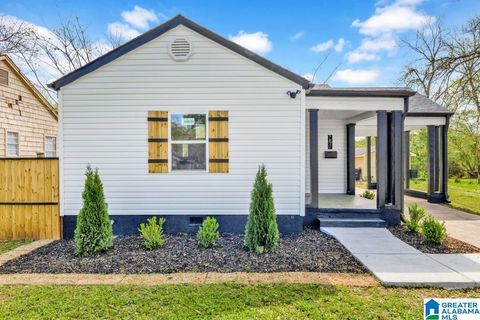
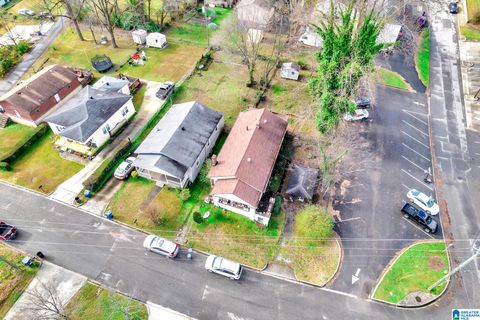
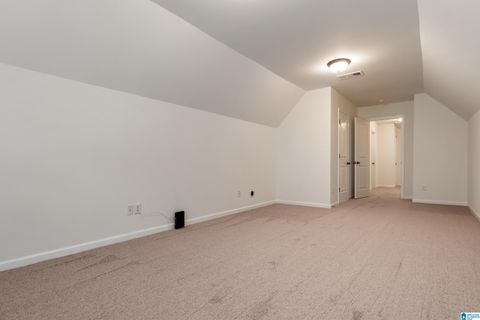
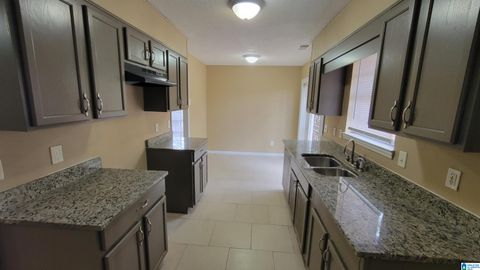
Active
$50,000
2
bds
|
0
ba
|
728
sqft
|
built
1948
4701 40th Pl N, Birmingham, AL 35217
$690
Cash flow
16.1%
Cash-on-Cash Return
16.6%
Cap rate
2.0%
Rent to Value Ratio
843 out of 968 properties for sale in Birmingham, AL
Limited Results Shown
Create a free account, or log in to reveal all property listings and enjoy the complete experience.
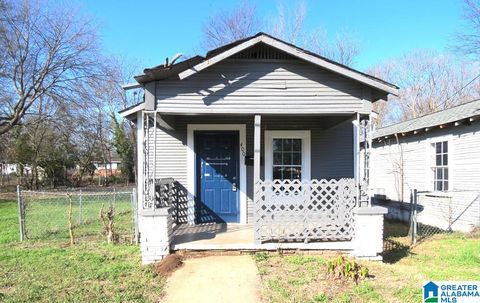
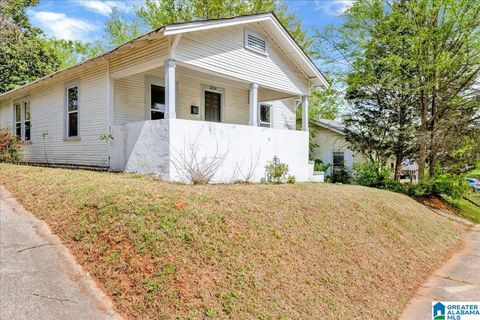
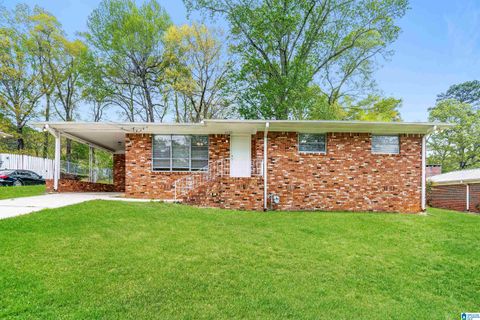
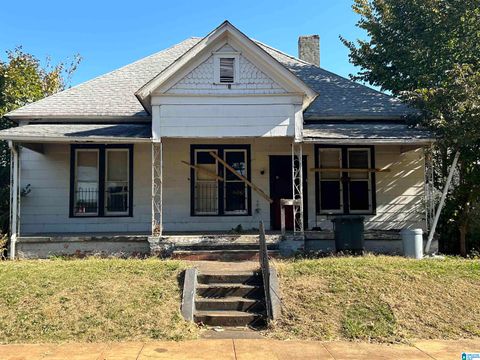
Active
$194,900
3
bds
|
0
ba
|
1,692
sqft
|
built
1974
1700 Maralyn Dr, Birmingham, AL 35235
$86
Cash flow
2.3%
Cash-on-Cash Return
6.8%
Cap rate
0.8%
Rent to Value Ratio
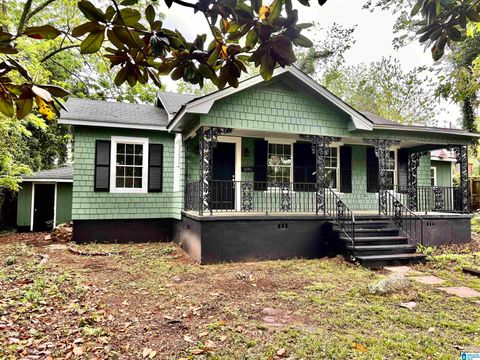
Active
$339,000
3
bds
|
0
ba
|
1,389
sqft
|
built
1925
3008 13th Ave S, Birmingham, AL 35205
$-45
Cash flow
-0.7%
Cash-on-Cash Return
6.1%
Cap rate
0.7%
Rent to Value Ratio
Active
$170,000
4
bds
|
0
ba
|
1,209
sqft
|
built
1984
1503 Wilderness Ln, Birmingham, AL 35235
$78
Cash flow
2.4%
Cash-on-Cash Return
6.8%
Cap rate
0.8%
Rent to Value Ratio
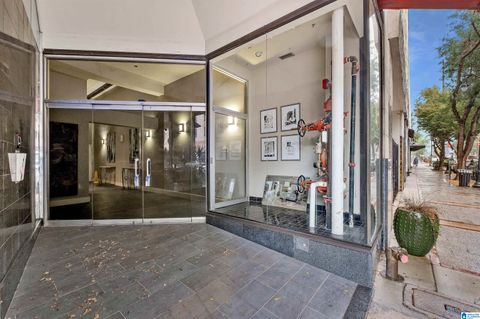
Active
$384,900
2
bds
|
0
ba
|
1,170
sqft
|
built
1887
2015 1st Ave N, Birmingham, AL 35203
$-146
Cash flow
-2.0%
Cash-on-Cash Return
5.8%
Cap rate
0.7%
Rent to Value Ratio
Active
$79,500
3
bds
|
0
ba
|
1,275
sqft
|
built
1961
2404 Ishkooda Rd SW, Birmingham, AL 35211
$413
Cash flow
27.1%
Cash-on-Cash Return
12.5%
Cap rate
1.5%
Rent to Value Ratio

Active
$89,400
4
bds
|
0
ba
|
0
sqft
|
built
1910
7424 Division Ave, Birmingham, AL 35206
$361
Cash flow
21.1%
Cash-on-Cash Return
11.1%
Cap rate
1.3%
Rent to Value Ratio
Active
$179,000
2
bds
|
0
ba
|
911
sqft
|
built
1945
7821 4th Ave N, Birmingham, AL 35206
$-176
Cash flow
-5.1%
Cash-on-Cash Return
5.1%
Cap rate
0.6%
Rent to Value Ratio

Active
$1,599,900
3
bds
|
0
ba
|
3,370
sqft
|
built
1930
4603 Clairmont Ave S, Birmingham, AL 35222
$-5,593
Cash flow
-18.2%
Cash-on-Cash Return
2.1%
Cap rate
0.3%
Rent to Value Ratio
Active
$62,900
1
bds
|
0
ba
|
612
sqft
|
built
1920
400 Beta St S, Birmingham, AL 35205
$621
Cash flow
11.5%
Cash-on-Cash Return
11.8%
Cap rate
1.4%
Rent to Value Ratio
Active
$85,000
2
bds
|
0
ba
|
1,320
sqft
|
built
1950
4625 Grasselli Blvd SW, Birmingham, AL 35221
$108
Cash flow
6.6%
Cash-on-Cash Return
7.8%
Cap rate
0.9%
Rent to Value Ratio

Active
$734,900
4
bds
|
0
ba
|
2,448
sqft
|
built
1930
849 42nd St S, Birmingham, AL 35222
$-2,112
Cash flow
-15.0%
Cash-on-Cash Return
2.8%
Cap rate
0.3%
Rent to Value Ratio
Active
$300,000
3
bds
|
0
ba
|
1,311
sqft
|
built
1930
2534 19th St S, Birmingham, AL 35209
$-324
Cash flow
-5.6%
Cash-on-Cash Return
5.0%
Cap rate
0.6%
Rent to Value Ratio
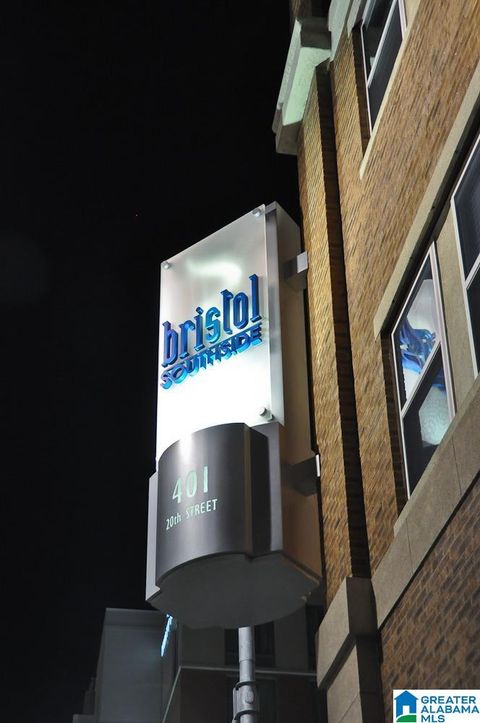
Active
$234,000
1
bds
|
0
ba
|
799
sqft
|
built
2007
401 20th St S, Birmingham, AL 35233
$-771
Cash flow
-17.2%
Cash-on-Cash Return
2.3%
Cap rate
0.6%
Rent to Value Ratio
Active
$120,000
3
bds
|
0
ba
|
1,400
sqft
|
built
1920
8234 4th Ave S, Birmingham, AL 35206
$133
Cash flow
5.8%
Cash-on-Cash Return
7.6%
Cap rate
0.9%
Rent to Value Ratio
Active
$230,000
1
bds
|
0
ba
|
792
sqft
|
built
1937
1914 3rd Ave N, Birmingham, AL 35203
$-28
Cash flow
-0.6%
Cash-on-Cash Return
6.1%
Cap rate
0.7%
Rent to Value Ratio

Active
$89,900
3
bds
|
0
ba
|
1,062
sqft
|
built
1958
1432 Brighton Rd, Birmingham, AL 35228
$428
Cash flow
24.8%
Cash-on-Cash Return
12.0%
Cap rate
1.4%
Rent to Value Ratio
Active
$160,000
3
bds
|
0
ba
|
1,507
sqft
|
built
1962
1625 Mann Dr, Birmingham, AL 35214
$200
Cash flow
6.5%
Cash-on-Cash Return
7.8%
Cap rate
0.9%
Rent to Value Ratio
Active
$84,900
4
bds
|
0
ba
|
1,126
sqft
|
built
1963
1513 20th Pl SW, Birmingham, AL 35211
$316
Cash flow
19.4%
Cash-on-Cash Return
10.7%
Cap rate
1.3%
Rent to Value Ratio
Active
$499,900
3
bds
|
0
ba
|
2,732
sqft
|
built
2006
4074 Highland Ridge Rd, Birmingham, AL 35242
$-721
Cash flow
-7.5%
Cash-on-Cash Return
4.5%
Cap rate
0.6%
Rent to Value Ratio
Active
$999,995
5
bds
|
0
ba
|
4,862
sqft
|
built
2006
164 Bridge Dr, Birmingham, AL 35242
$-2,551
Cash flow
-13.3%
Cash-on-Cash Return
3.2%
Cap rate
0.4%
Rent to Value Ratio
Active
$100,000
4
bds
|
0
ba
|
2,104
sqft
|
built
1930
219 10th Ct N, Birmingham, AL 35204
$582
Cash flow
30.4%
Cash-on-Cash Return
13.2%
Cap rate
1.6%
Rent to Value Ratio
Active
$225,000
1
bds
|
0
ba
|
657
sqft
|
built
2007
401 20th St S, Birmingham, AL 35233
$-209
Cash flow
-4.8%
Cash-on-Cash Return
5.2%
Cap rate
0.6%
Rent to Value Ratio
Active
$140,000
4
bds
|
0
ba
|
3,877
sqft
|
built
1930
1231 32nd St N, Birmingham, AL 35234
$235
Cash flow
8.8%
Cash-on-Cash Return
8.3%
Cap rate
1.0%
Rent to Value Ratio
Active
$130,000
3
bds
|
0
ba
|
1,304
sqft
|
built
1946
8321 Vassar Ave, Birmingham, AL 35206
$218
Cash flow
8.7%
Cash-on-Cash Return
8.3%
Cap rate
1.0%
Rent to Value Ratio

Active
$238,999
3
bds
|
0
ba
|
1,861
sqft
|
built
1975
102 Cambrian Way, Birmingham, AL 35242
$-279
Cash flow
-6.1%
Cash-on-Cash Return
4.9%
Cap rate
0.8%
Rent to Value Ratio
Active
$165,000
4
bds
|
0
ba
|
2,044
sqft
|
built
1956
1216 Graymont Ave W, Birmingham, AL 35208
$105
Cash flow
3.3%
Cash-on-Cash Return
7.0%
Cap rate
0.8%
Rent to Value Ratio

Active
$2,295,000
4
bds
|
0
ba
|
5,711
sqft
|
built
2002
3219 Karl Daly Rd, Birmingham, AL 35210
$-8,877
Cash flow
-20.2%
Cash-on-Cash Return
1.6%
Cap rate
0.2%
Rent to Value Ratio
Active
$625,000
3
bds
|
0
ba
|
1,736
sqft
|
built
1924
2250 Highland Avenue S, Birmingham, AL 35205
$0
Cash flow
n/a
Cash-on-Cash Return
n/a
Cap rate
n/a
Rent to Value Ratio
Active
$109,000
3
bds
|
0
ba
|
1,388
sqft
|
built
1920
544 Perry St, Birmingham, AL 35214
$397
Cash flow
19.0%
Cash-on-Cash Return
10.6%
Cap rate
1.3%
Rent to Value Ratio

Active
$77,500
3
bds
|
0
ba
|
1,100
sqft
|
built
1947
2101 Fulton Ave SW, Birmingham, AL 35211
$354
Cash flow
23.8%
Cash-on-Cash Return
11.8%
Cap rate
1.4%
Rent to Value Ratio
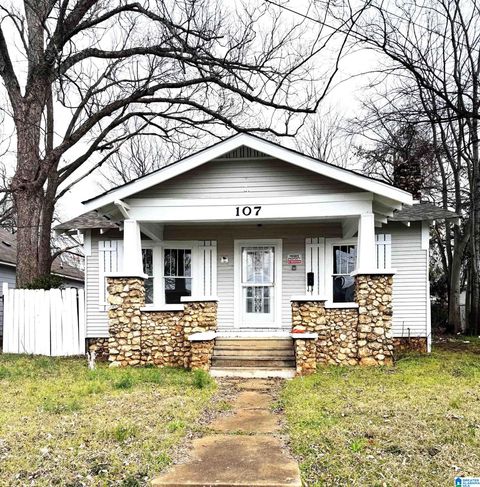
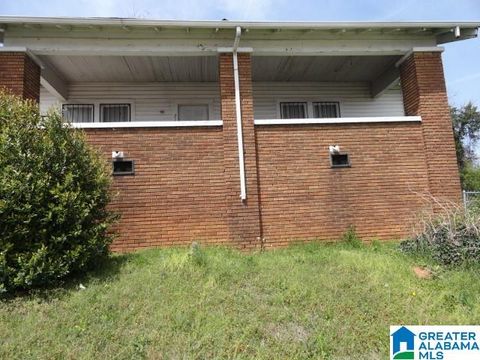
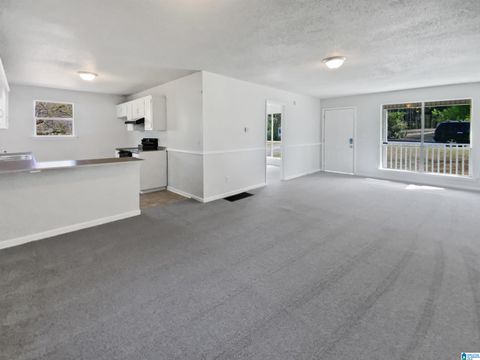
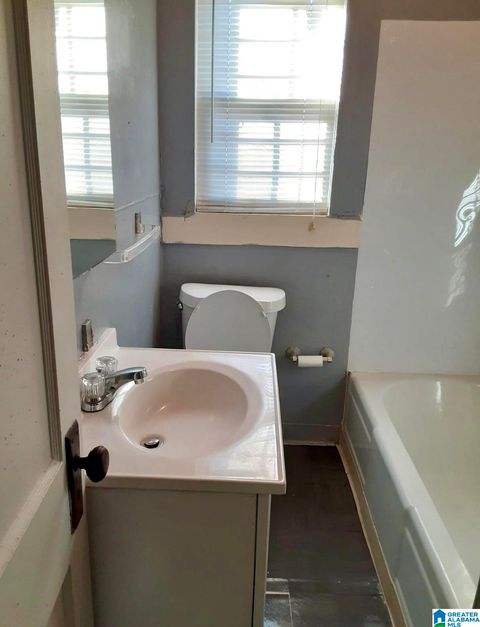
Active
$80,000
3
bds
|
0
ba
|
1,104
sqft
|
built
1930
107 71st Street N, Birmingham, AL 35206
$0
Cash flow
n/a
Cash-on-Cash Return
n/a
Cap rate
n/a
Rent to Value Ratio
Active
$80,000
3
bds
|
0
ba
|
1,720
sqft
|
built
1917
2116 Warrior Rd, Birmingham, AL 35208
$617
Cash flow
40.2%
Cash-on-Cash Return
15.5%
Cap rate
1.9%
Rent to Value Ratio
Active
$138,000
3
bds
|
0
ba
|
1,157
sqft
|
built
1981
616 15th Ave NW, Birmingham, AL 35215
$177
Cash flow
6.7%
Cash-on-Cash Return
7.8%
Cap rate
0.9%
Rent to Value Ratio
Active
$80,000
2
bds
|
0
ba
|
1,008
sqft
|
built
1948
61 17th Ct S, Birmingham, AL 35205
$272
Cash flow
17.7%
Cash-on-Cash Return
10.4%
Cap rate
1.3%
Rent to Value Ratio
Active
$89,500
3
bds
|
0
ba
|
1,232
sqft
|
built
1934
3208 Cedar Ave SW, Birmingham, AL 35221
$223
Cash flow
13.0%
Cash-on-Cash Return
9.3%
Cap rate
1.1%
Rent to Value Ratio
Active
$174,000
4
bds
|
0
ba
|
1,740
sqft
|
built
1975
434 Westchester Dr, Birmingham, AL 35215
$196
Cash flow
5.9%
Cash-on-Cash Return
7.6%
Cap rate
0.9%
Rent to Value Ratio
Active
$80,000
3
bds
|
0
ba
|
1,448
sqft
|
built
1910
229 73rd St N, Birmingham, AL 35206
$341
Cash flow
22.2%
Cash-on-Cash Return
11.4%
Cap rate
1.4%
Rent to Value Ratio
Active
$93,900
3
bds
|
0
ba
|
1,156
sqft
|
built
1930
2016 26th Street Ensley, Birmingham, AL 35218
$269
Cash flow
14.9%
Cash-on-Cash Return
9.7%
Cap rate
1.2%
Rent to Value Ratio