Birmingham, AL Investment Properties for Sale
Browse homes for sale and investment properties in Birmingham, AL. Refine your search by price, property type, or more.
Best cash flowing properties in Birmingham, AL
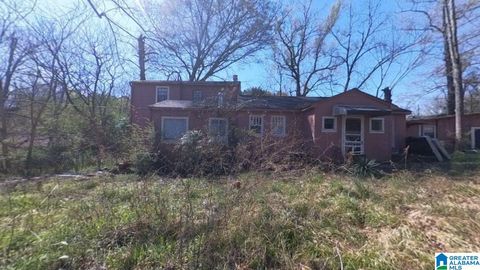
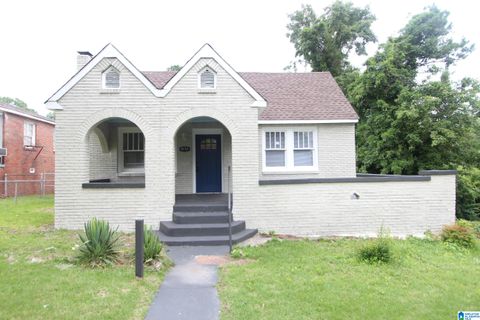
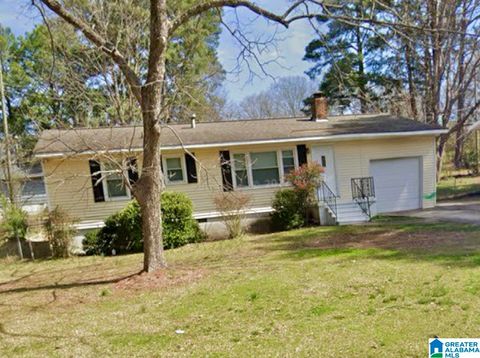
Active
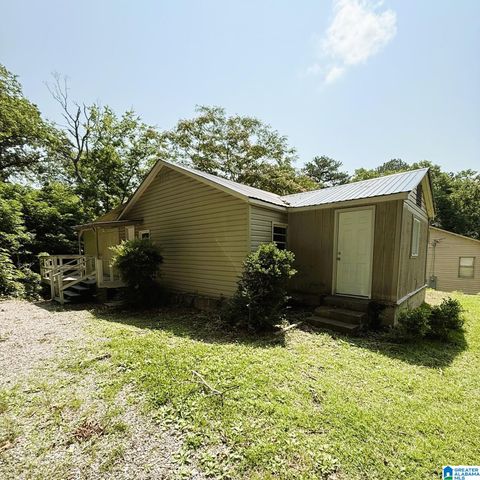
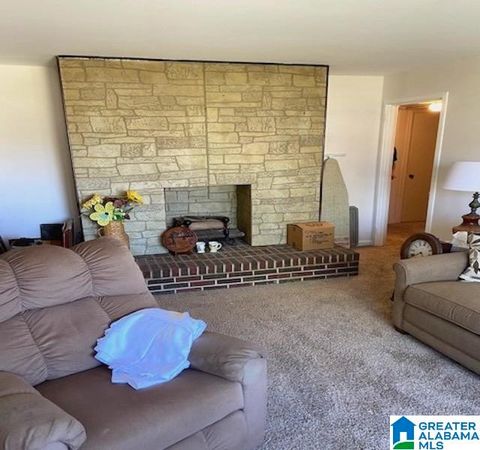
$39,900
3
bds
|
0
ba
|
1,460
sqft
|
built
1955
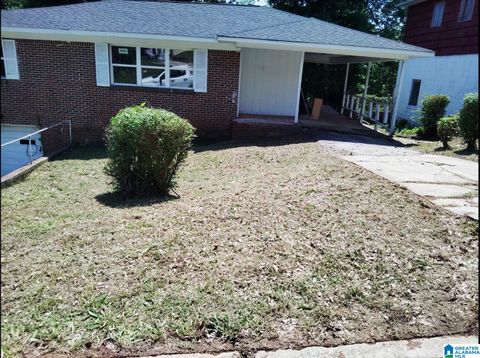
113 Mulberry Rd, Birmingham, AL 35214
$1,104
Cash flow
32.2%
Cash-on-Cash Return
33.2%
Cap rate
4.0%
Rent to Value Ratio

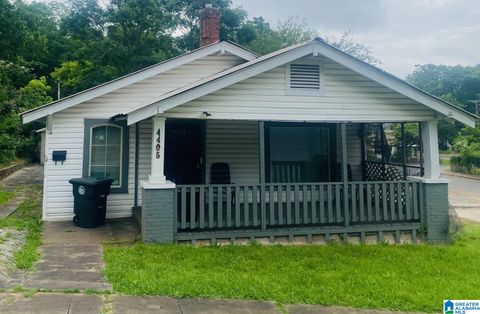
Active
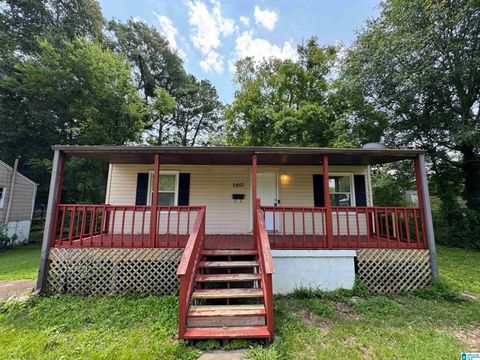
$36,000
3
bds
|
0
ba
|
1,368
sqft
|
built
1940
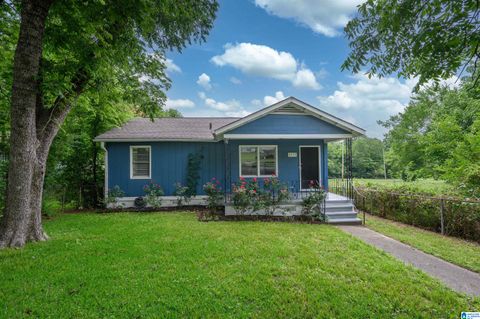
2308 17th Street Ensley, Birmingham, AL 35208
$897
Cash flow
29.0%
Cash-on-Cash Return
29.9%
Cap rate
3.6%
Rent to Value Ratio
836 out of 957 properties for sale in Birmingham, AL
Limited Results Shown
Create a free account, or log in to reveal all property listings and enjoy the complete experience.

Active
$305,000
4
bds
|
0
ba
|
3,672
sqft
|
built
1979
908 18th Ave NW, Birmingham, AL 35215
$-212
Cash flow
-3.6%
Cash-on-Cash Return
5.4%
Cap rate
0.7%
Rent to Value Ratio

Active
$154,999
3
bds
|
0
ba
|
1,604
sqft
|
built
1972
7212 Oporto Madrid Blvd S, Birmingham, AL 35206
$433
Cash flow
14.6%
Cash-on-Cash Return
9.6%
Cap rate
1.2%
Rent to Value Ratio

Active
$84,900
3
bds
|
0
ba
|
1,232
sqft
|
built
1940
8405 3rd Ave S, Birmingham, AL 35206
$454
Cash flow
27.9%
Cash-on-Cash Return
12.7%
Cap rate
1.5%
Rent to Value Ratio

Active
$369,000
4
bds
|
0
ba
|
2,728
sqft
|
built
1952
507 Green Springs Ave S, Birmingham, AL 35205
$-546
Cash flow
-7.7%
Cash-on-Cash Return
4.5%
Cap rate
0.5%
Rent to Value Ratio
Active
$119,900
2
bds
|
0
ba
|
1,064
sqft
|
built
1930
4405 41st Way N, Birmingham, AL 35217
$271
Cash flow
11.8%
Cash-on-Cash Return
9.0%
Cap rate
1.1%
Rent to Value Ratio
Active
$279,900
4
bds
|
0
ba
|
2,002
sqft
|
built
1987
1340 Americana Dr, Birmingham, AL 35215
$-288
Cash flow
-5.4%
Cash-on-Cash Return
5.0%
Cap rate
0.6%
Rent to Value Ratio

Active
$79,900
3
bds
|
0
ba
|
1,102
sqft
|
built
1952
933 49th Street Ensley, Birmingham, AL 35208
$480
Cash flow
31.3%
Cash-on-Cash Return
13.5%
Cap rate
1.6%
Rent to Value Ratio

Active
$45,000
3
bds
|
0
ba
|
1,068
sqft
|
built
1945
2100 Dawson Ave SW, Birmingham, AL 35211
$828
Cash flow
21.4%
Cash-on-Cash Return
22.1%
Cap rate
2.7%
Rent to Value Ratio

Active
$159,900
3
bds
|
0
ba
|
1,101
sqft
|
built
1940
741 Center Pl SW, Birmingham, AL 35211
$-76
Cash flow
-2.5%
Cash-on-Cash Return
5.7%
Cap rate
0.7%
Rent to Value Ratio
Active
$285,000
1
bds
|
0
ba
|
731
sqft
|
built
1920
1801 2nd Ave N, Birmingham, AL 35203
$-323
Cash flow
-5.9%
Cash-on-Cash Return
4.9%
Cap rate
0.7%
Rent to Value Ratio
Active
$125,000
3
bds
|
0
ba
|
1,192
sqft
|
built
1952
528 Bluebell Rd, Birmingham, AL 35214
$37
Cash flow
1.5%
Cash-on-Cash Return
6.6%
Cap rate
0.8%
Rent to Value Ratio
Active
$69,000
3
bds
|
0
ba
|
1,428
sqft
|
built
1950
2005 49th Street Ensley, Birmingham, AL 35208
$690
Cash flow
11.7%
Cash-on-Cash Return
12.0%
Cap rate
1.4%
Rent to Value Ratio

Active
$699,900
4
bds
|
0
ba
|
3,983
sqft
|
built
1994
1645 Wingfield Dr, Birmingham, AL 35242
$-1,193
Cash flow
-8.9%
Cash-on-Cash Return
4.2%
Cap rate
0.5%
Rent to Value Ratio
Active
$68,000
2
bds
|
0
ba
|
720
sqft
|
built
1952
5857 Court Q, Birmingham, AL 35228
$621
Cash flow
10.6%
Cash-on-Cash Return
11.0%
Cap rate
1.3%
Rent to Value Ratio
Active
$100,000
4
bds
|
0
ba
|
1,335
sqft
|
built
1975
2408 Powderly Ave SW, Birmingham, AL 35211
$444
Cash flow
23.2%
Cash-on-Cash Return
11.6%
Cap rate
1.4%
Rent to Value Ratio

Active
$279,900
3
bds
|
0
ba
|
1,707
sqft
|
built
2007
2449 Ridgemont Dr, Birmingham, AL 35244
$-106
Cash flow
-2.0%
Cash-on-Cash Return
5.8%
Cap rate
0.7%
Rent to Value Ratio

Active
$359,900
3
bds
|
0
ba
|
2,344
sqft
|
built
2003
1015 Townes Ct, Birmingham, AL 35242
$-614
Cash flow
-8.9%
Cash-on-Cash Return
4.2%
Cap rate
0.6%
Rent to Value Ratio
Active
$149,900
3
bds
|
0
ba
|
1,036
sqft
|
built
1959
732 84th St S, Birmingham, AL 35206
$45
Cash flow
1.6%
Cash-on-Cash Return
6.6%
Cap rate
0.8%
Rent to Value Ratio
Active
$290,000
3
bds
|
0
ba
|
1,496
sqft
|
built
1946
608 9th Ct S, Birmingham, AL 35205
$-134
Cash flow
-2.4%
Cash-on-Cash Return
5.7%
Cap rate
0.7%
Rent to Value Ratio
Active
$405,000
4
bds
|
0
ba
|
2,104
sqft
|
built
1961
3501 Pineland Dr, Birmingham, AL 35243
$-182
Cash flow
-2.3%
Cash-on-Cash Return
5.7%
Cap rate
0.7%
Rent to Value Ratio

Active
$265,000
2
bds
|
0
ba
|
0
sqft
|
built
1960
7749 5th Ave S, Birmingham, AL 35206
$-555
Cash flow
-10.9%
Cash-on-Cash Return
3.7%
Cap rate
0.5%
Rent to Value Ratio

Active
$175,000
bds
|
0
ba
|
0
sqft
|
built
1961
7741 Rugby Ave, Birmingham, AL 35206
$-17
Cash flow
-0.5%
Cash-on-Cash Return
6.2%
Cap rate
0.7%
Rent to Value Ratio
Active
$145,000
3
bds
|
0
ba
|
1,109
sqft
|
built
1956
2033 E Lake Blvd, Birmingham, AL 35217
$140
Cash flow
5.0%
Cash-on-Cash Return
7.4%
Cap rate
0.9%
Rent to Value Ratio

Active
$249,900
3
bds
|
0
ba
|
1,408
sqft
|
built
2005
2332 Ridgemont Dr, Birmingham, AL 35244
$-84
Cash flow
-1.8%
Cash-on-Cash Return
5.9%
Cap rate
0.7%
Rent to Value Ratio
Active
$159,900
3
bds
|
0
ba
|
1,960
sqft
|
built
1955
517 22nd St SW, Birmingham, AL 35211
$407
Cash flow
13.3%
Cash-on-Cash Return
9.3%
Cap rate
1.1%
Rent to Value Ratio
Active
$245,000
2
bds
|
0
ba
|
891
sqft
|
built
1955
4759 7th Ct S, Birmingham, AL 35222
$-37
Cash flow
-0.8%
Cash-on-Cash Return
6.1%
Cap rate
0.7%
Rent to Value Ratio
Active
$79,900
4
bds
|
0
ba
|
1,500
sqft
|
built
1971
405 Nevada St, Birmingham, AL 35224
$342
Cash flow
22.3%
Cash-on-Cash Return
11.4%
Cap rate
1.4%
Rent to Value Ratio
Active
$150,000
2
bds
|
0
ba
|
2,174
sqft
|
built
1925
1100 16th St SW, Birmingham, AL 35211
$183
Cash flow
6.4%
Cash-on-Cash Return
7.7%
Cap rate
0.9%
Rent to Value Ratio
Active
$169,900
3
bds
|
0
ba
|
1,485
sqft
|
built
1939
1636 33rd St SW, Birmingham, AL 35221
$79
Cash flow
2.4%
Cash-on-Cash Return
6.8%
Cap rate
0.8%
Rent to Value Ratio
Active
$989,000
5
bds
|
0
ba
|
5,670
sqft
|
built
1997
6006 Rosemont Rd, Birmingham, AL 35242
$-2,804
Cash flow
-14.8%
Cash-on-Cash Return
2.9%
Cap rate
0.4%
Rent to Value Ratio
Active
$59,900
2
bds
|
0
ba
|
981
sqft
|
built
1940
4125 43rd Ave N, Birmingham, AL 35217
$828
Cash flow
16.1%
Cash-on-Cash Return
16.6%
Cap rate
2.0%
Rent to Value Ratio
Active
$160,000
4
bds
|
0
ba
|
2,058
sqft
|
built
1970
2509 Bow String Dr, Birmingham, AL 35214
$269
Cash flow
8.8%
Cash-on-Cash Return
8.3%
Cap rate
1.0%
Rent to Value Ratio
Active
$89,900
3
bds
|
0
ba
|
1,159
sqft
|
built
1956
9809 Red Mill Rd, Birmingham, AL 35215
$428
Cash flow
24.8%
Cash-on-Cash Return
12.0%
Cap rate
1.4%
Rent to Value Ratio
Active
$140,000
4
bds
|
0
ba
|
1,976
sqft
|
built
1935
8300 7th Ter S, Birmingham, AL 35206
$235
Cash flow
8.8%
Cash-on-Cash Return
8.3%
Cap rate
1.0%
Rent to Value Ratio
Active
$475,000
5
bds
|
0
ba
|
2,724
sqft
|
built
1920
1710 Cullom St S, Birmingham, AL 35205
$-548
Cash flow
-6.0%
Cash-on-Cash Return
4.9%
Cap rate
0.6%
Rent to Value Ratio
Active
$210,000
4
bds
|
0
ba
|
1,272
sqft
|
built
1932
539 63rd St S, Birmingham, AL 35212
$146
Cash flow
3.6%
Cash-on-Cash Return
7.1%
Cap rate
0.9%
Rent to Value Ratio
Active
$165,000
1
bds
|
0
ba
|
276
sqft
|
built
1887
2015 1st Ave N, Birmingham, AL 35203
$91
Cash flow
2.9%
Cash-on-Cash Return
6.9%
Cap rate
0.9%
Rent to Value Ratio
Active
$159,000
4
bds
|
0
ba
|
2,172
sqft
|
built
1969
1904 14th Pl SW, Birmingham, AL 35211
$343
Cash flow
11.3%
Cash-on-Cash Return
8.9%
Cap rate
1.1%
Rent to Value Ratio