Birmingham, AL Investment Properties for Sale
Browse homes for sale and investment properties in Birmingham, AL. Refine your search by price, property type, or more.
Best cash flowing properties in Birmingham, AL
Active
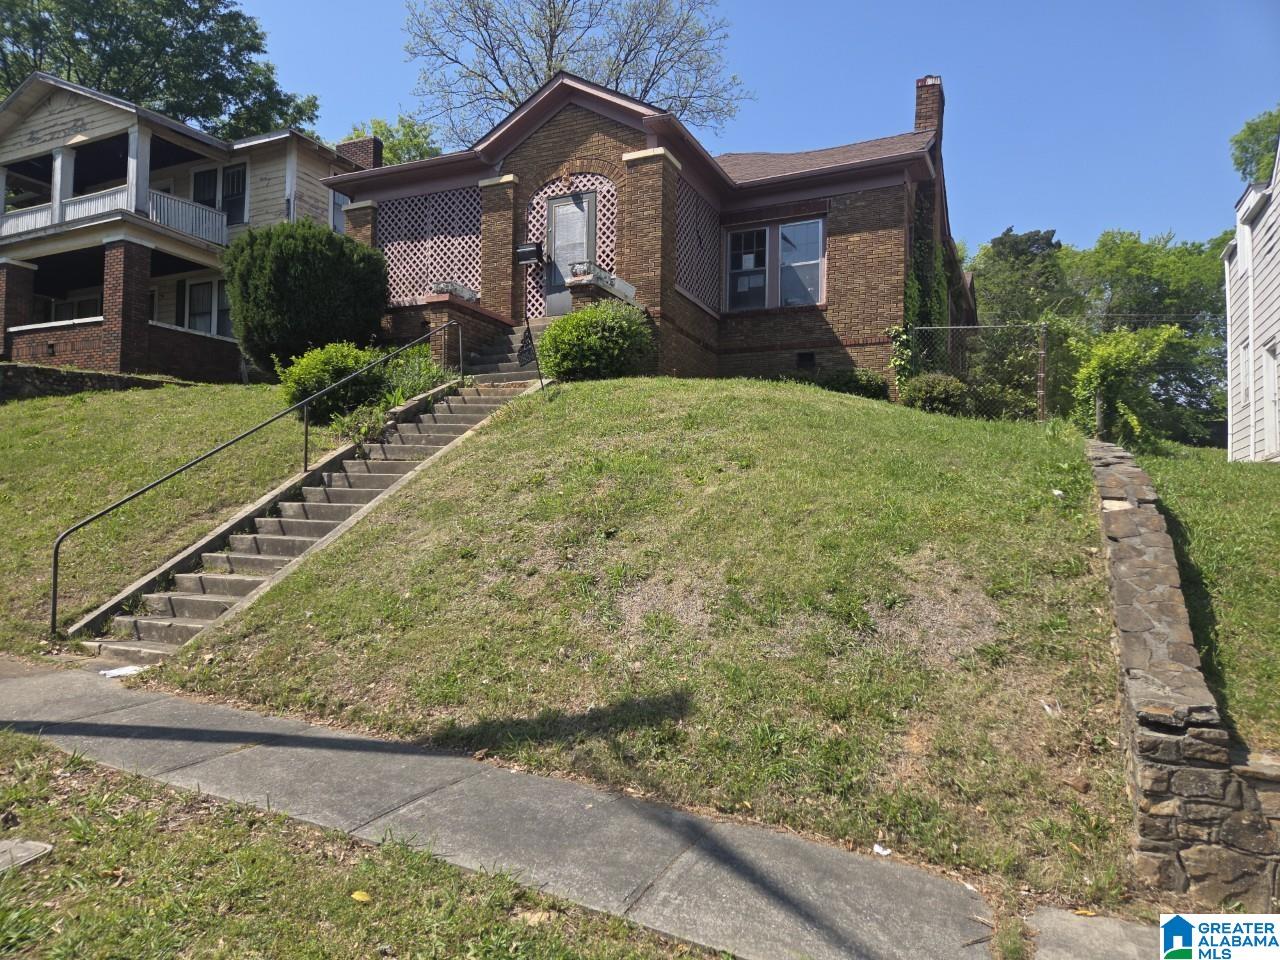
$64,000
3
bds
|
0
ba
|
1,634
sqft
|
built
1930
2854 20th Street Ensley, Birmingham, AL 35208
$1,104
Cash flow
20.1%
Cash-on-Cash Return
20.7%
Cap rate
2.5%
Rent to Value Ratio
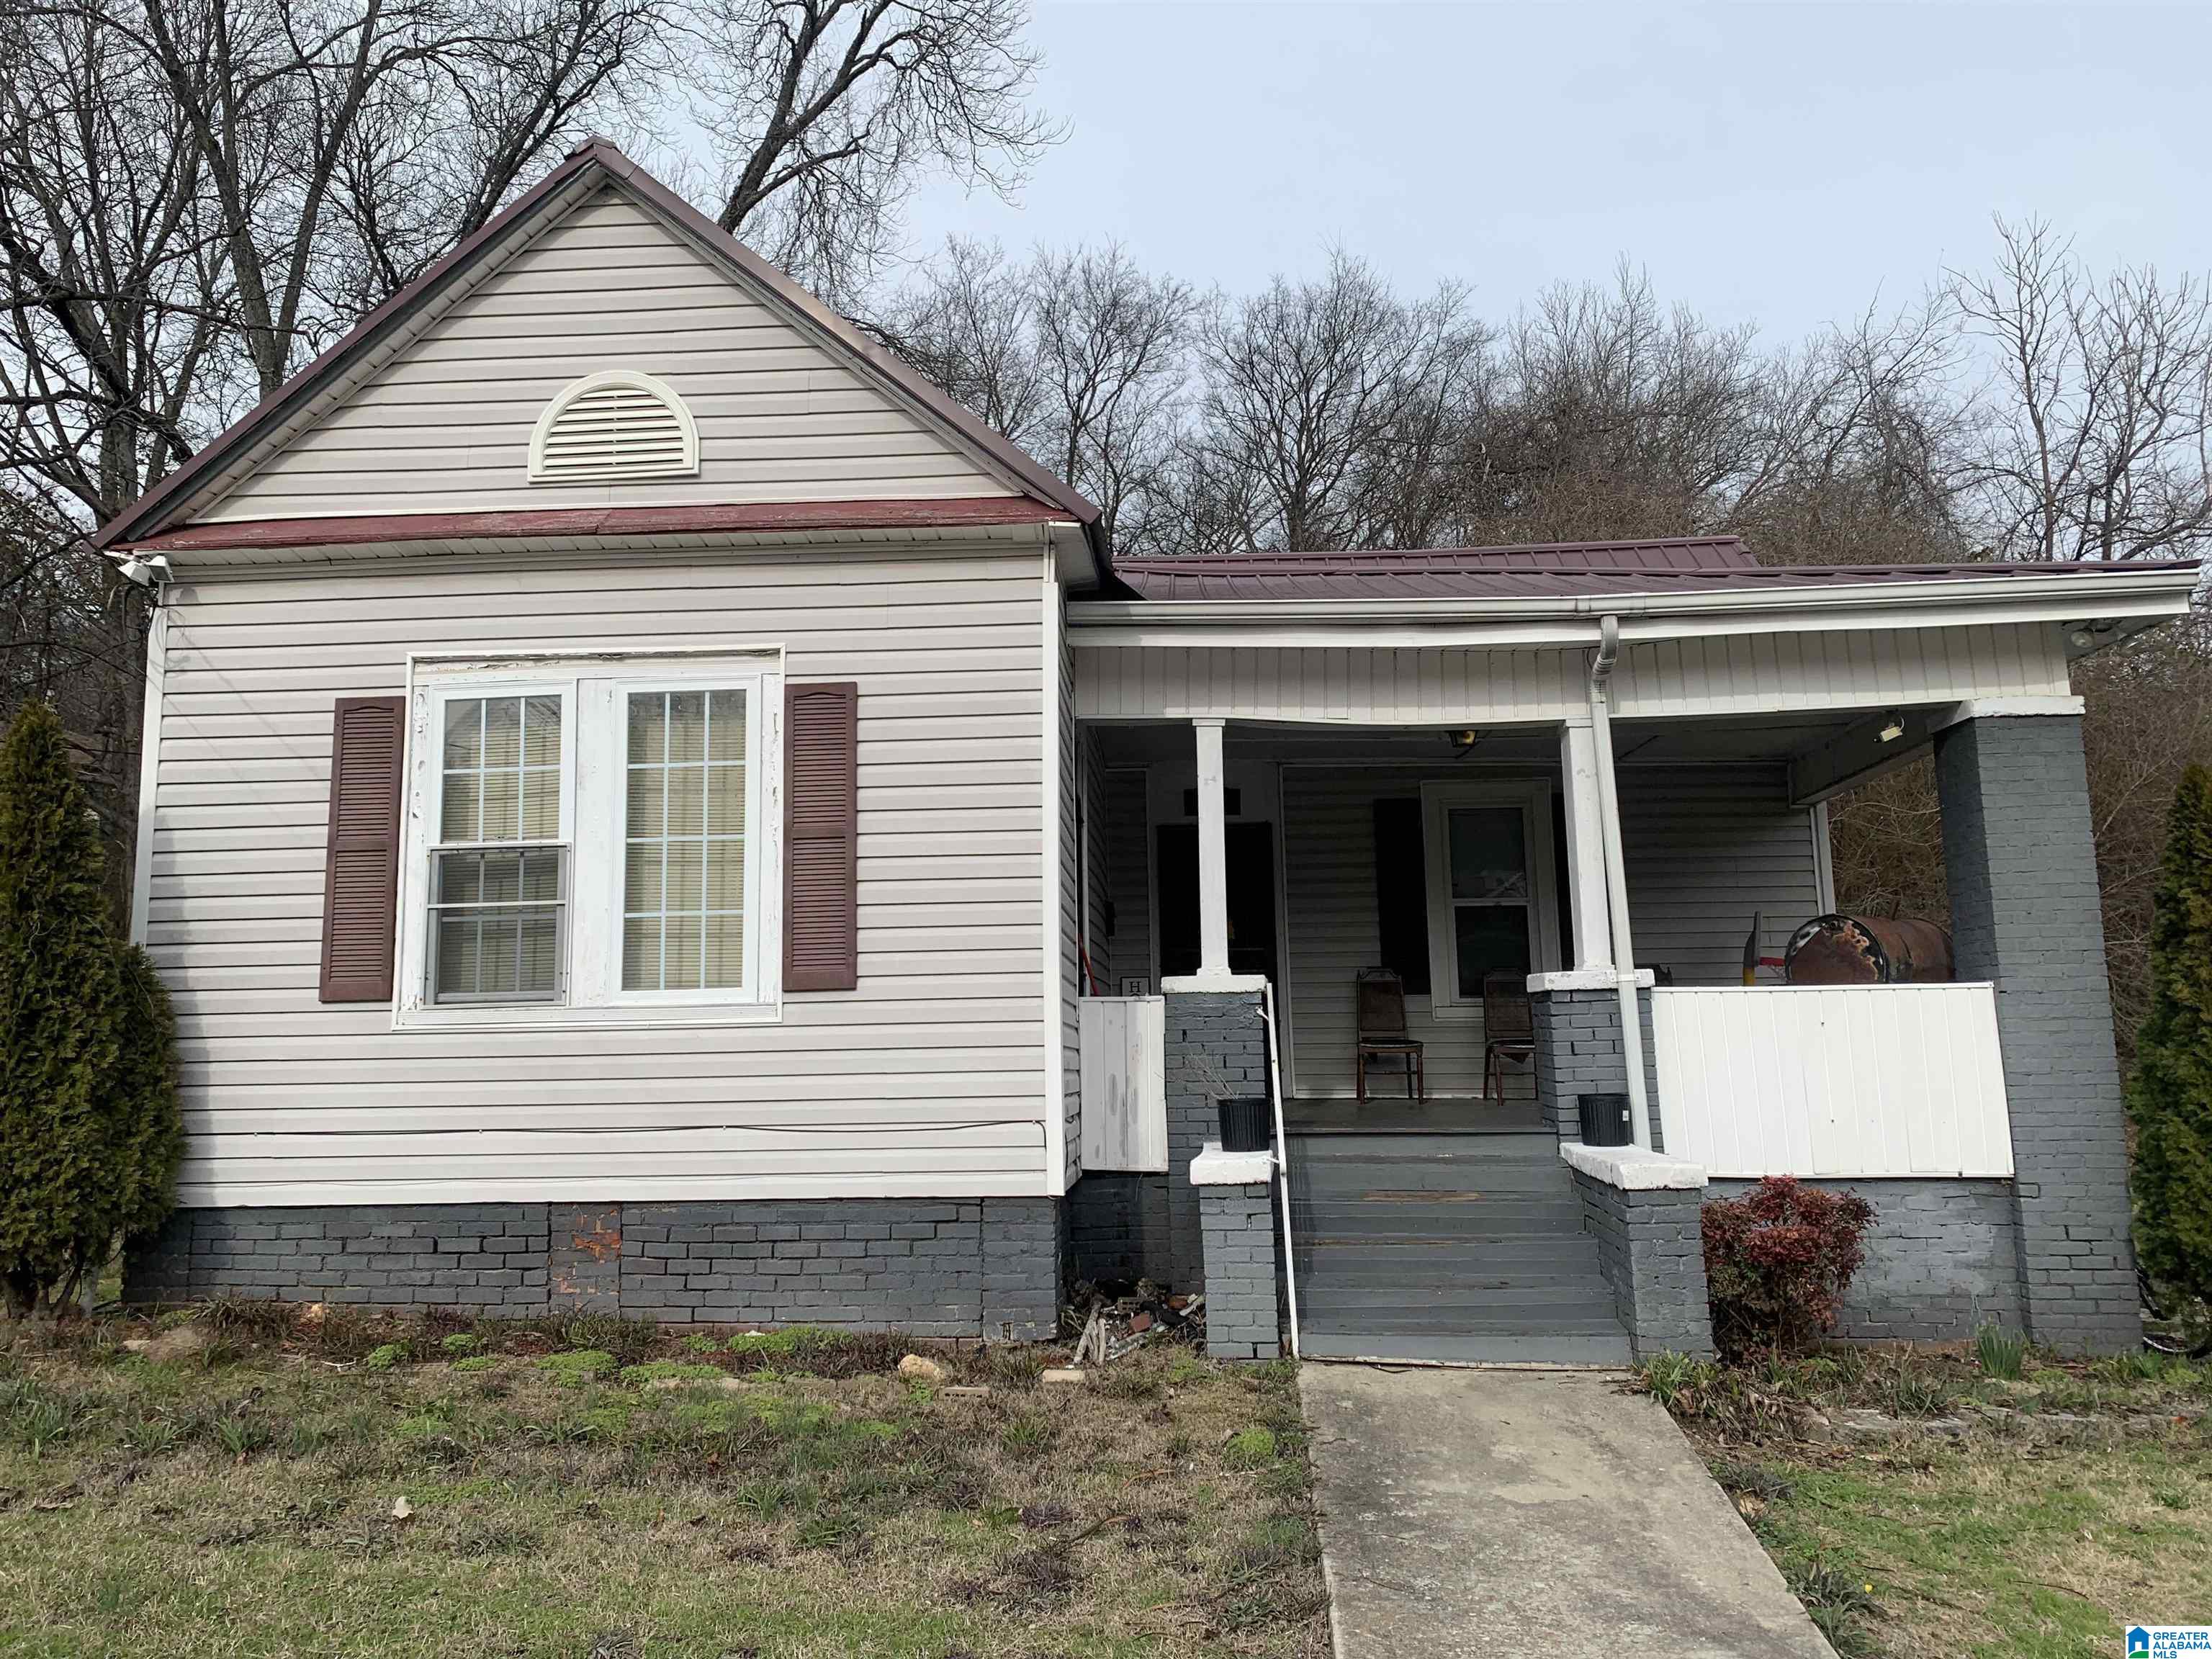
Active
$70,900
2
bds
|
0
ba
|
1,032
sqft
|
built
1930
2716 29th Street Ensley, Birmingham, AL 35208
$690
Cash flow
11.3%
Cash-on-Cash Return
11.7%
Cap rate
1.4%
Rent to Value Ratio
915 out of 1,030 properties for sale in Birmingham, AL
Limited Results Shown
Create a free account, or log in to reveal all property listings and enjoy the complete experience.
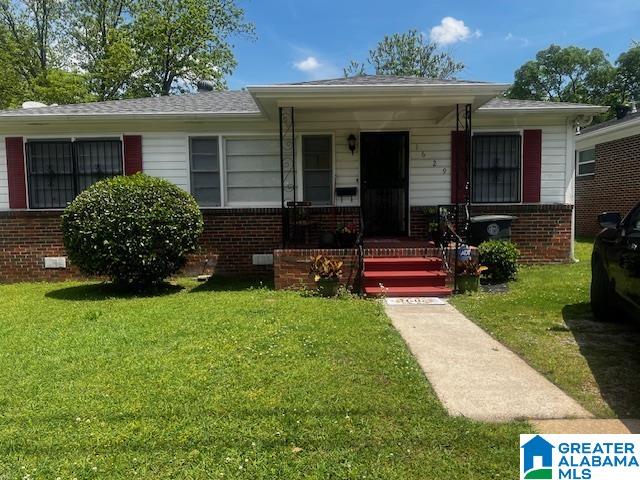
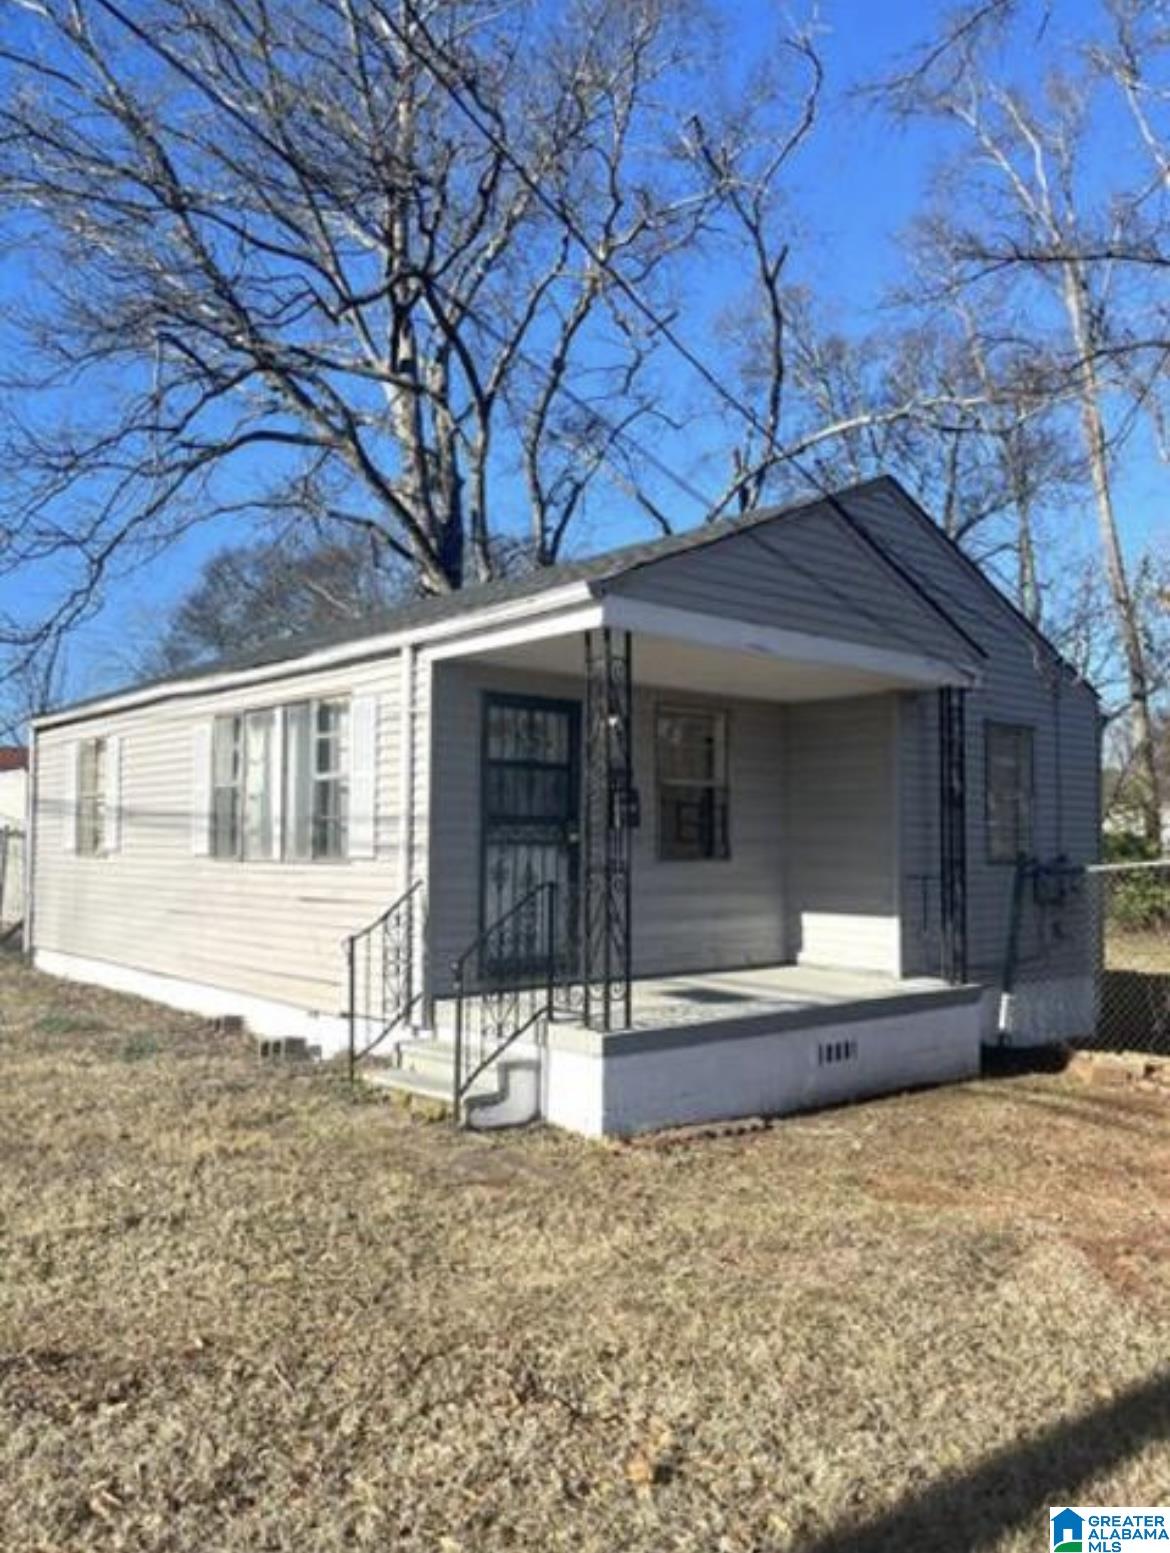
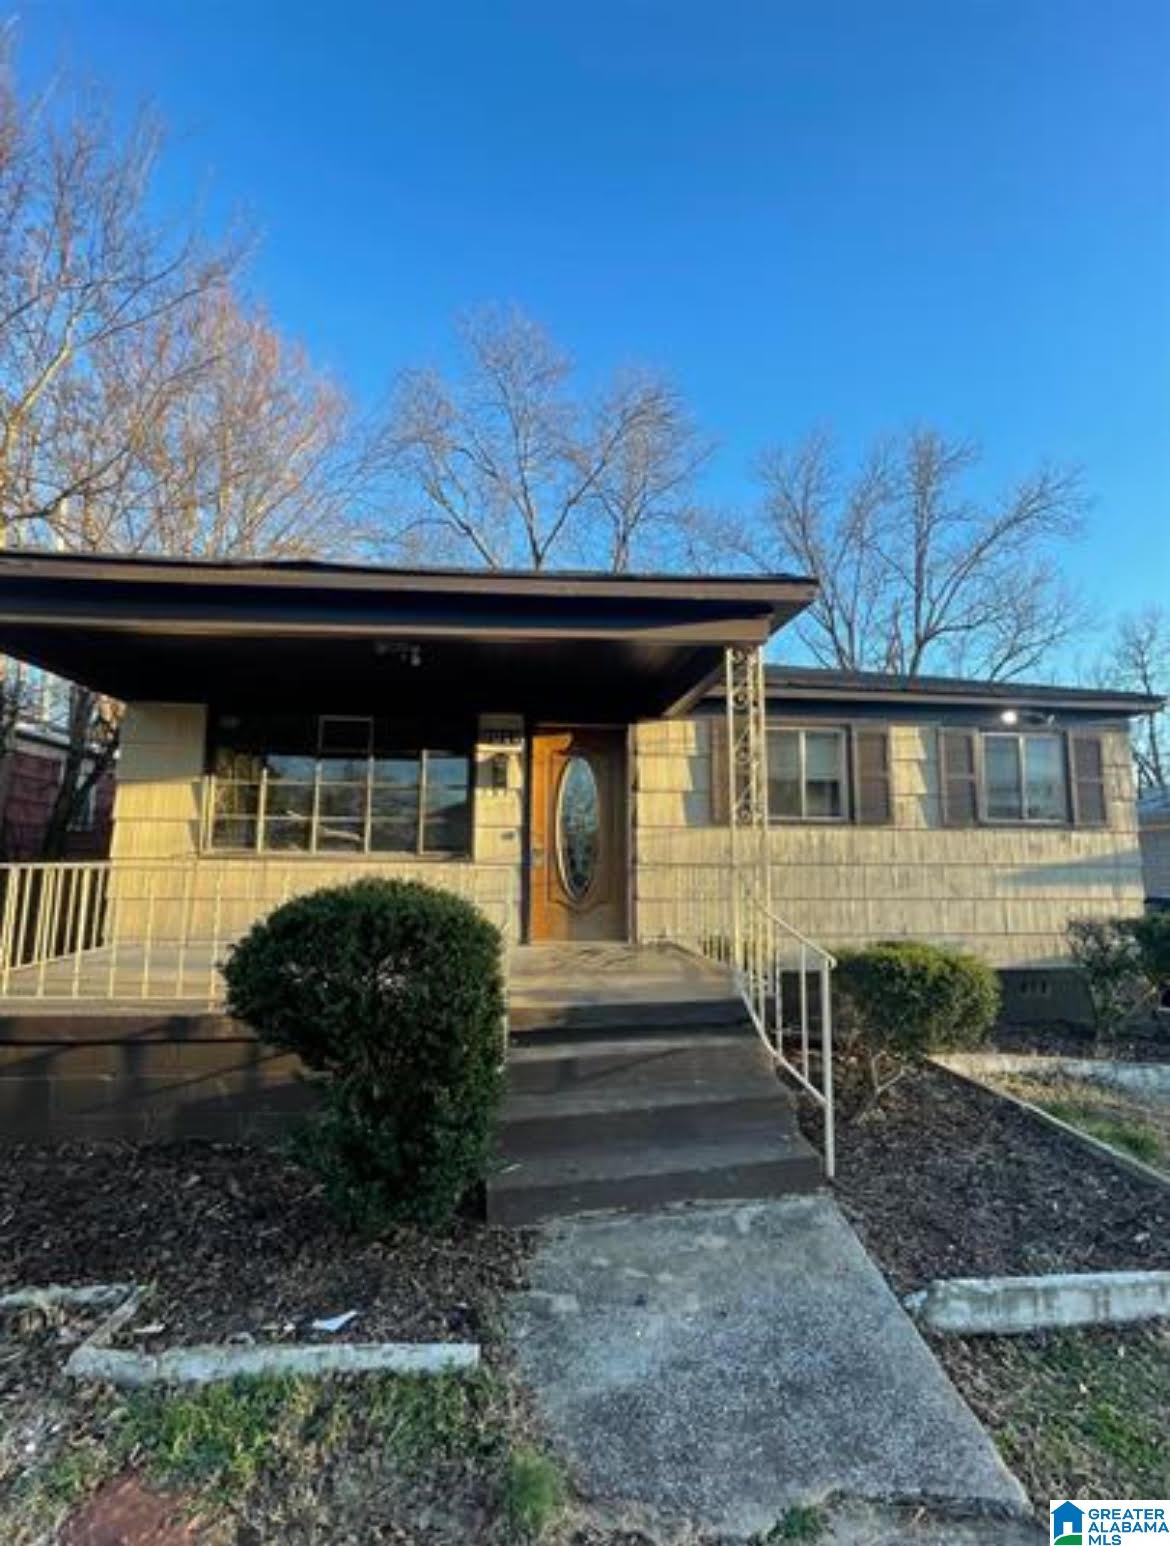
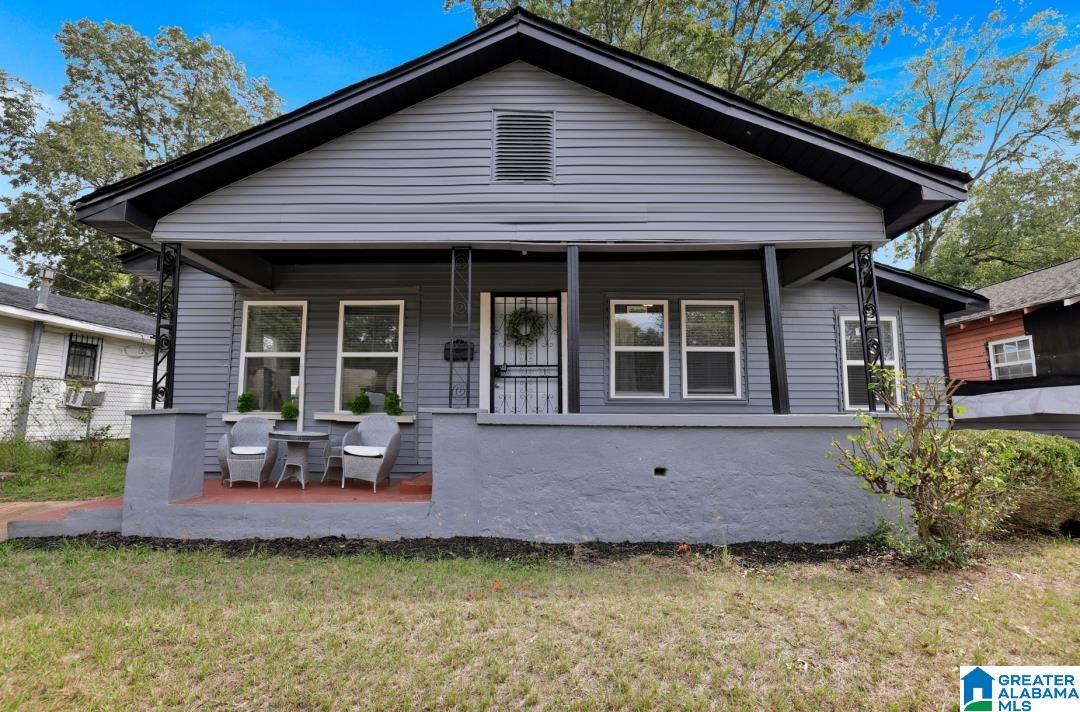
Active
$99,999
3
bds
|
0
ba
|
1,108
sqft
|
built
1940
1629 4th St N, Birmingham, AL 35204
$286
Cash flow
14.9%
Cash-on-Cash Return
9.1%
Cap rate
1.1%
Rent to Value Ratio
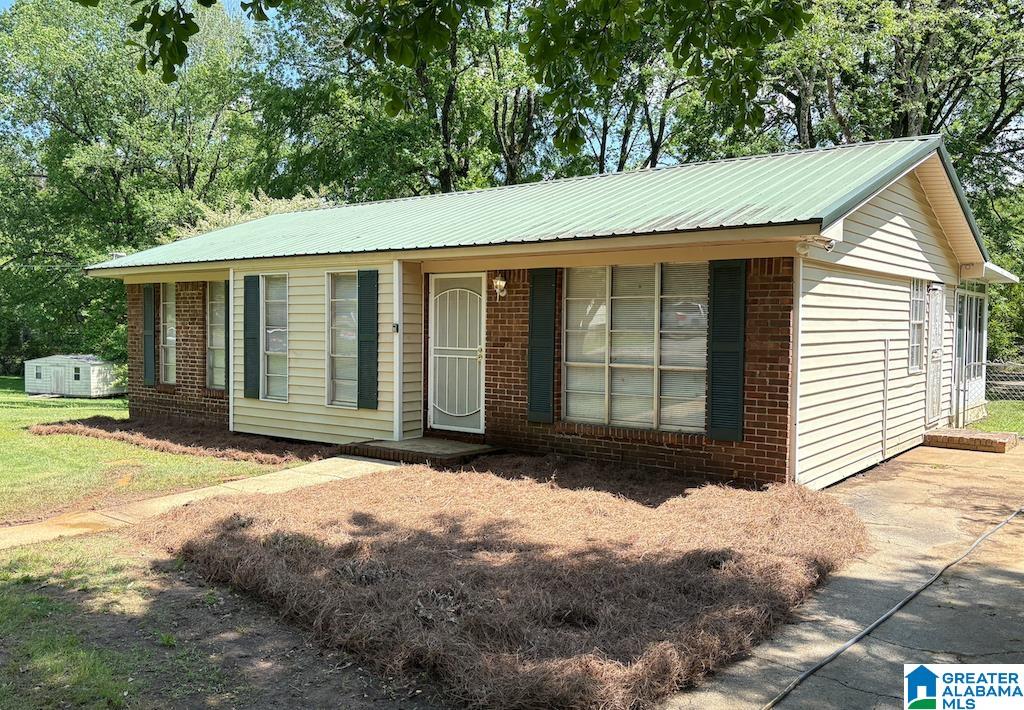
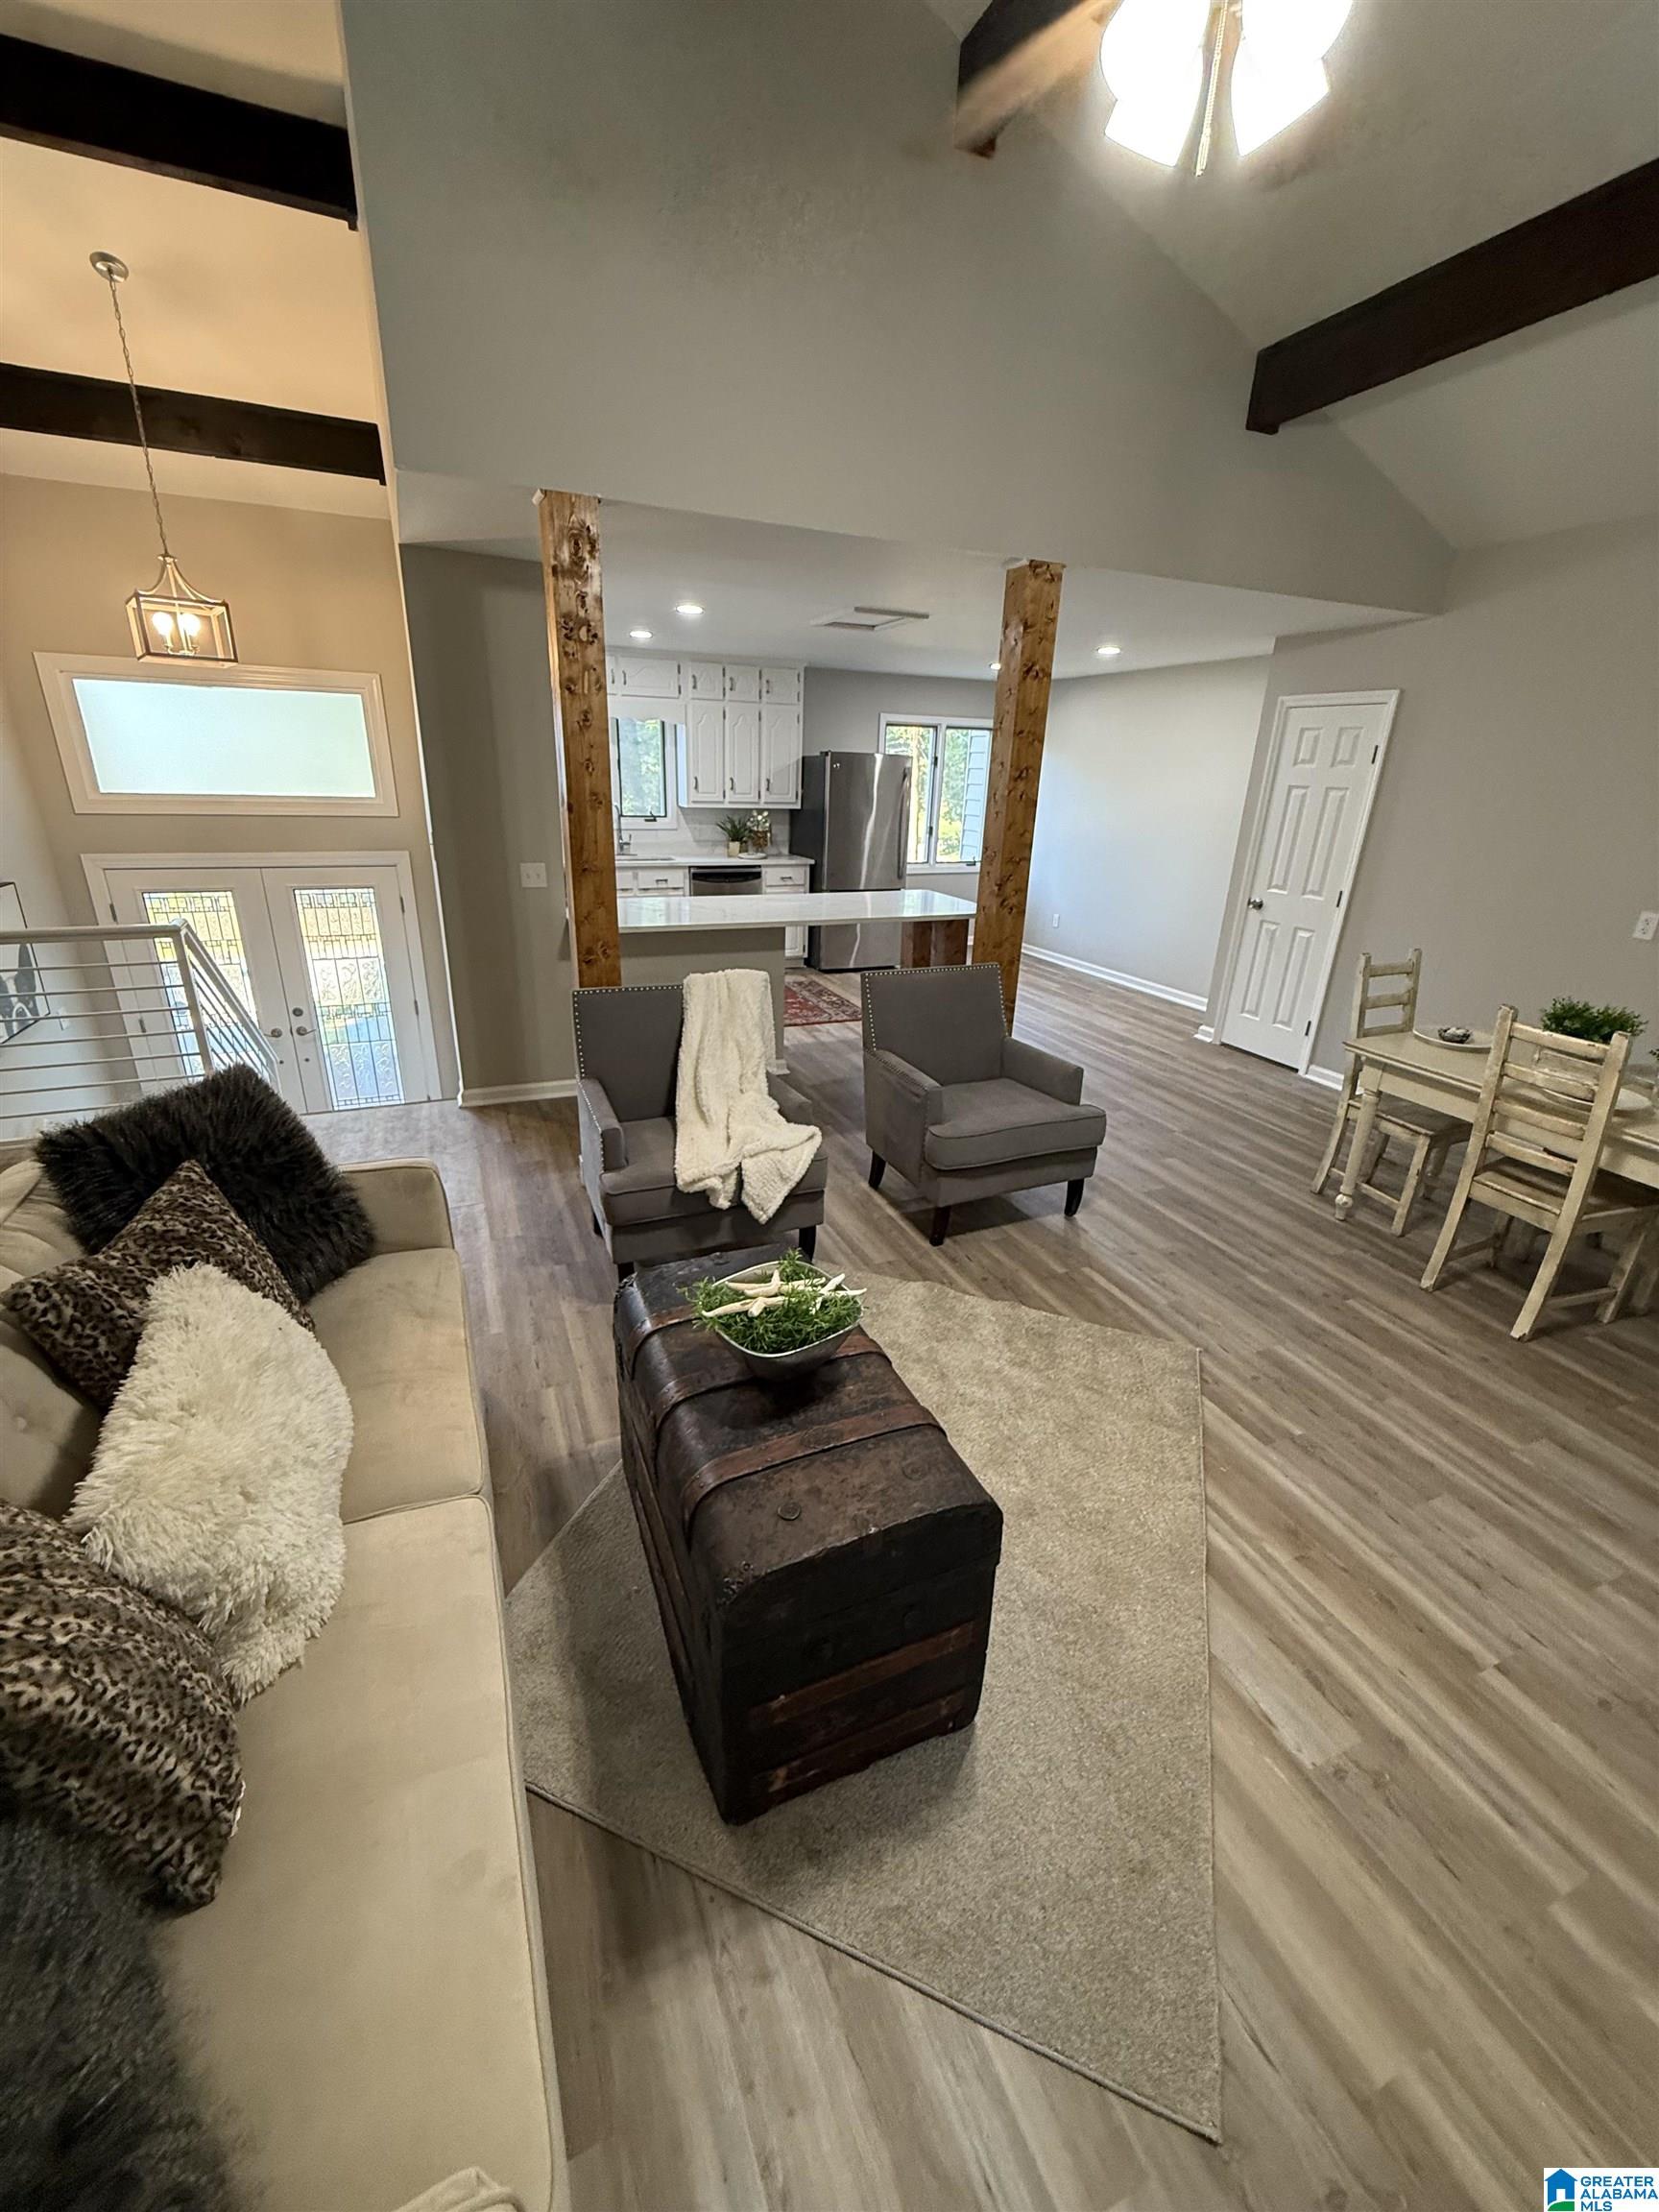
Active
$139,900
3
bds
|
0
ba
|
1,022
sqft
|
built
1973
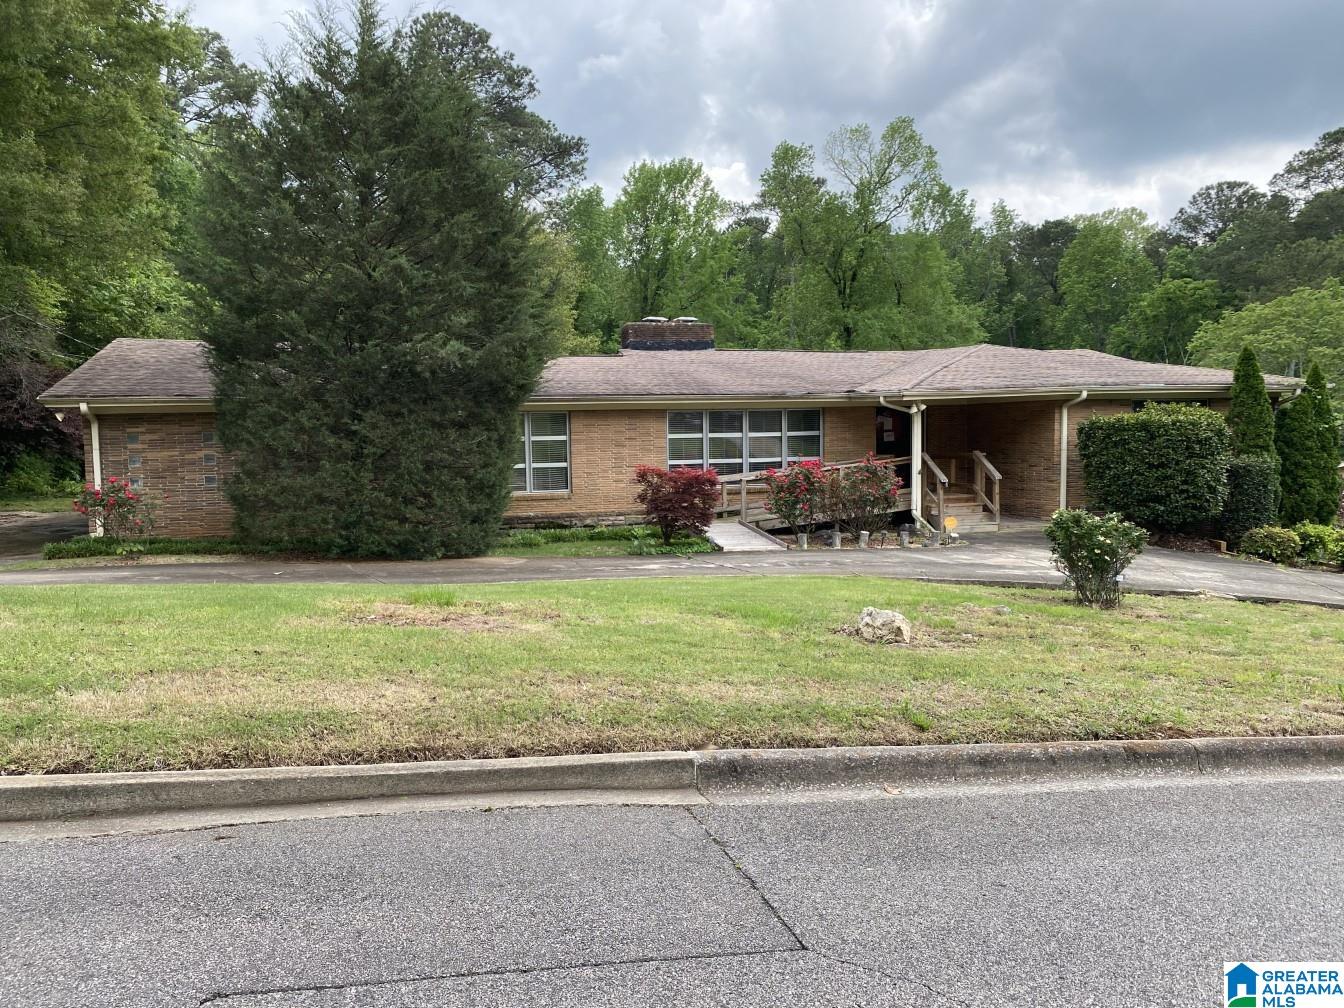
1017 Rocky Brook Trl, Birmingham, AL 35214
$166
Cash flow
6.2%
Cash-on-Cash Return
7.1%
Cap rate
0.9%
Rent to Value Ratio
Active
$85,000
2
bds
|
0
ba
|
716
sqft
|
built
1962
1808 Jefferson Ave SW, Birmingham, AL 35211
$219
Cash flow
13.4%
Cash-on-Cash Return
8.8%
Cap rate
1.1%
Rent to Value Ratio
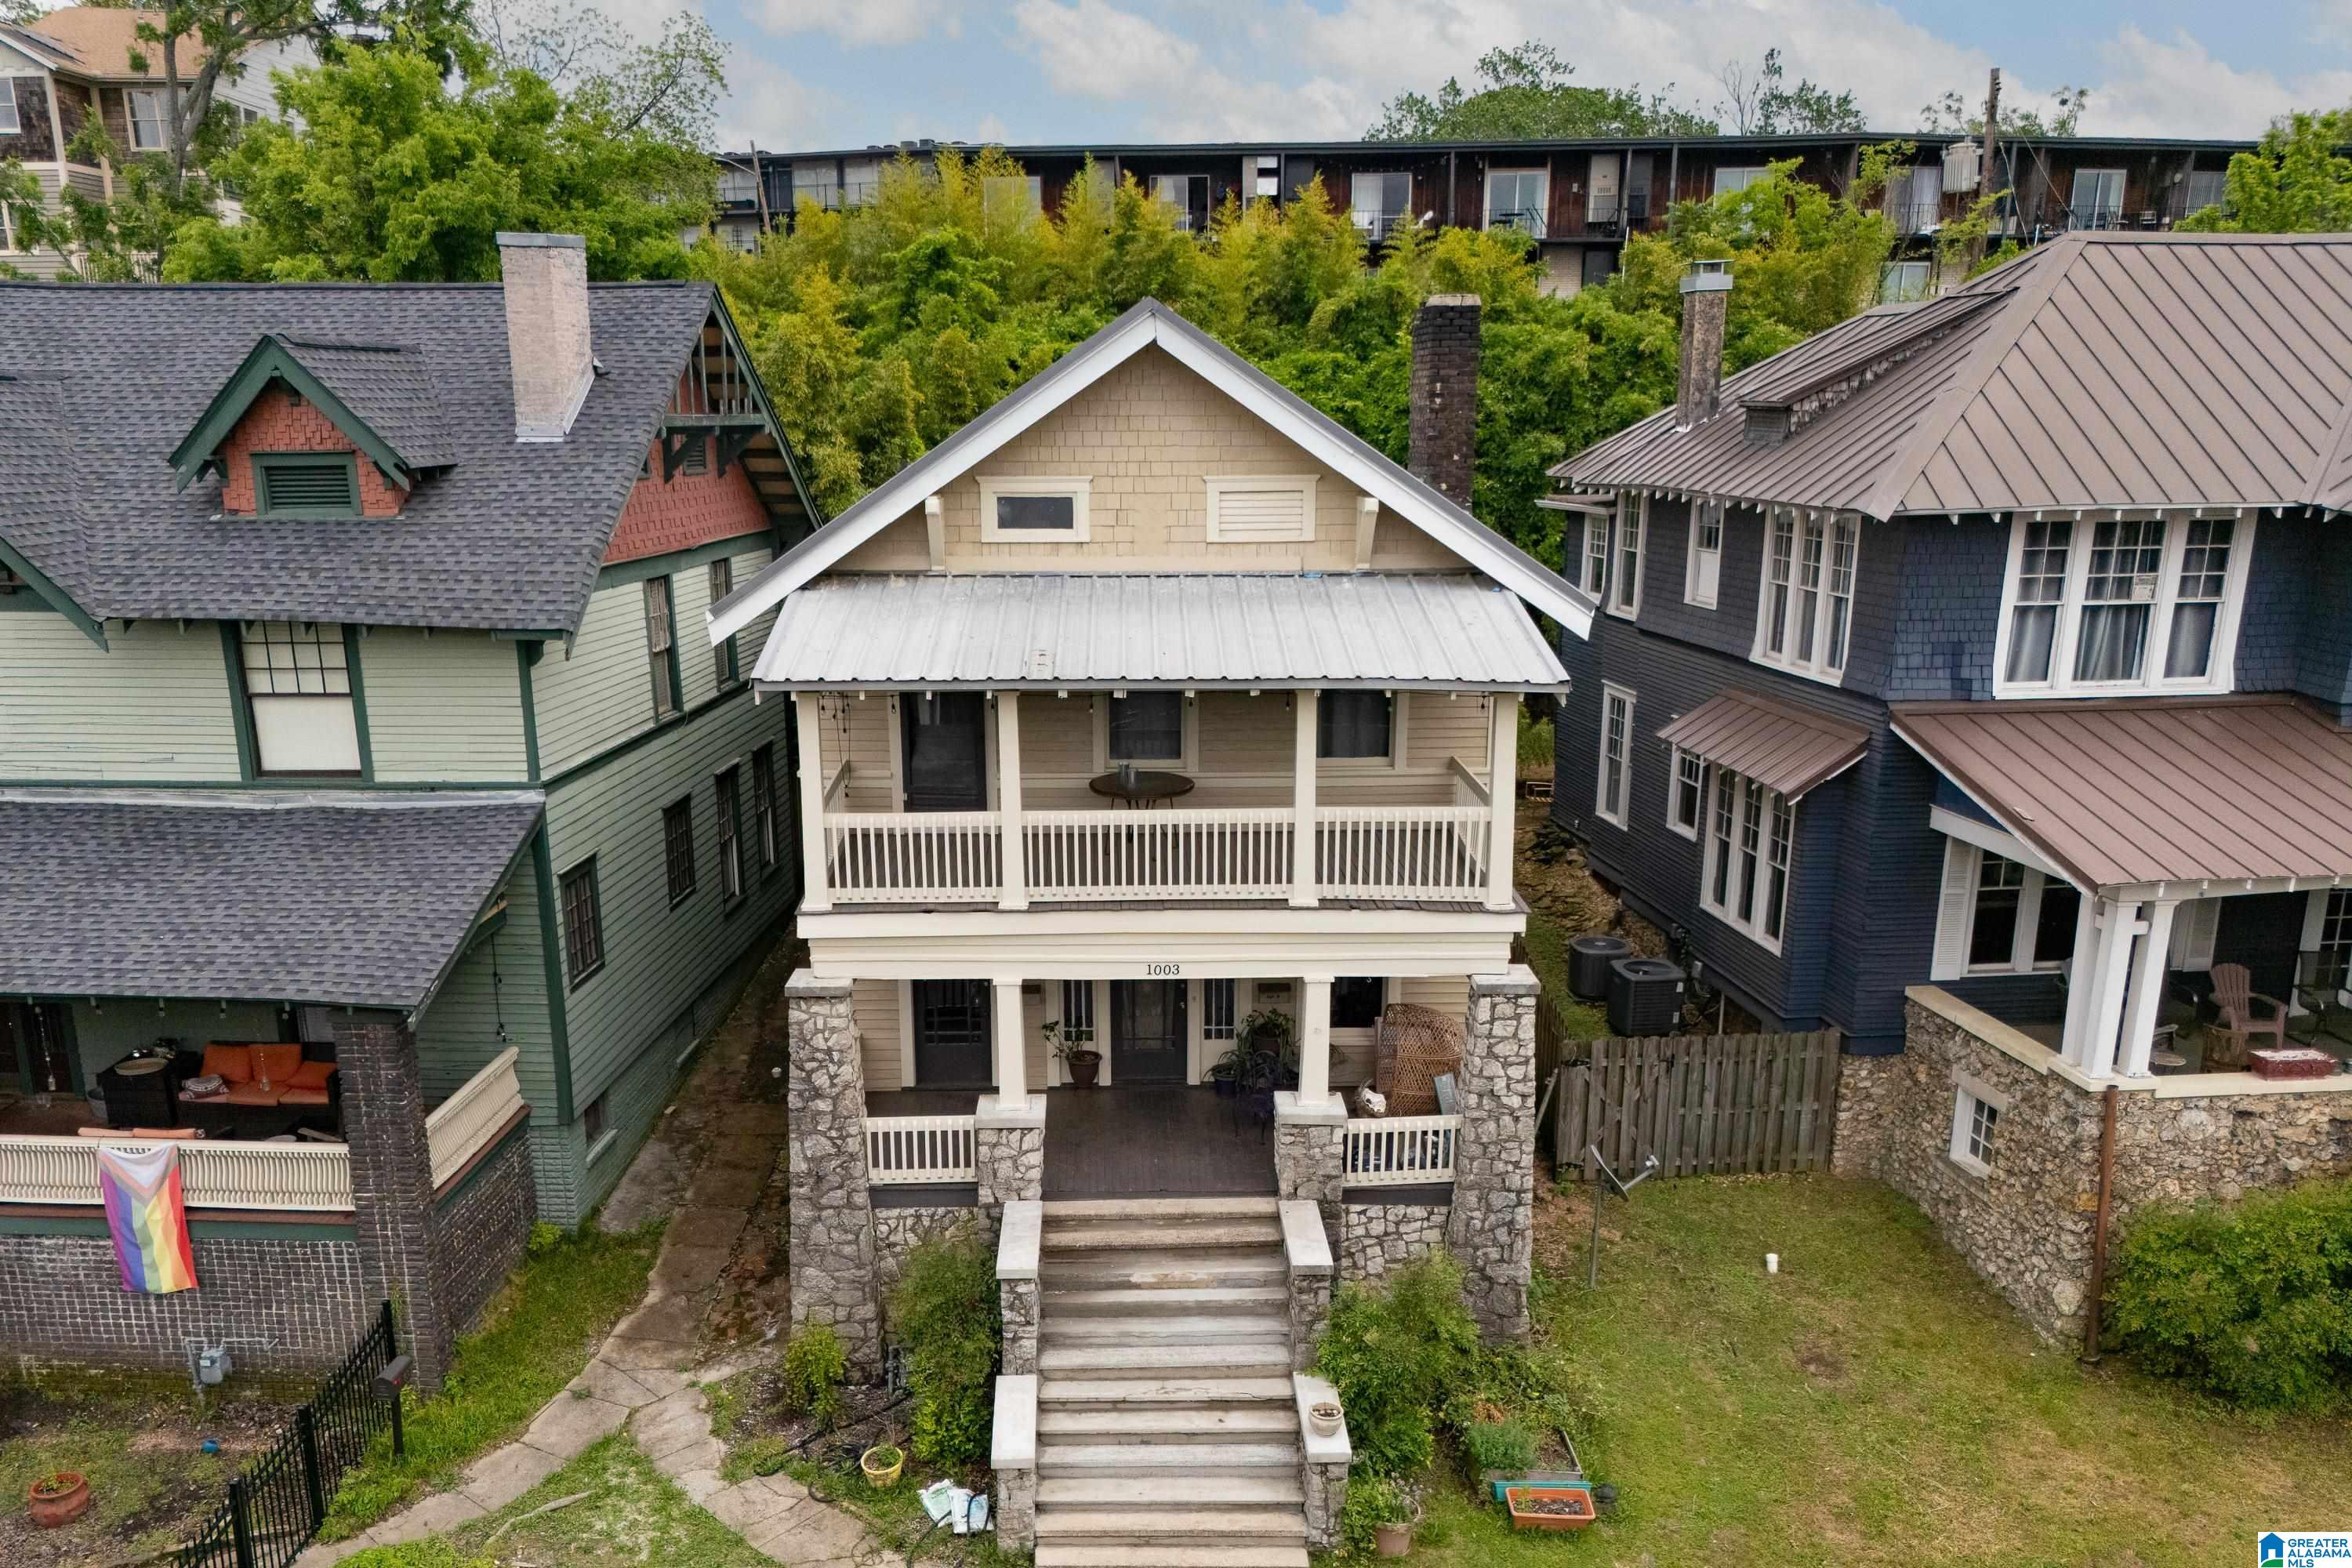
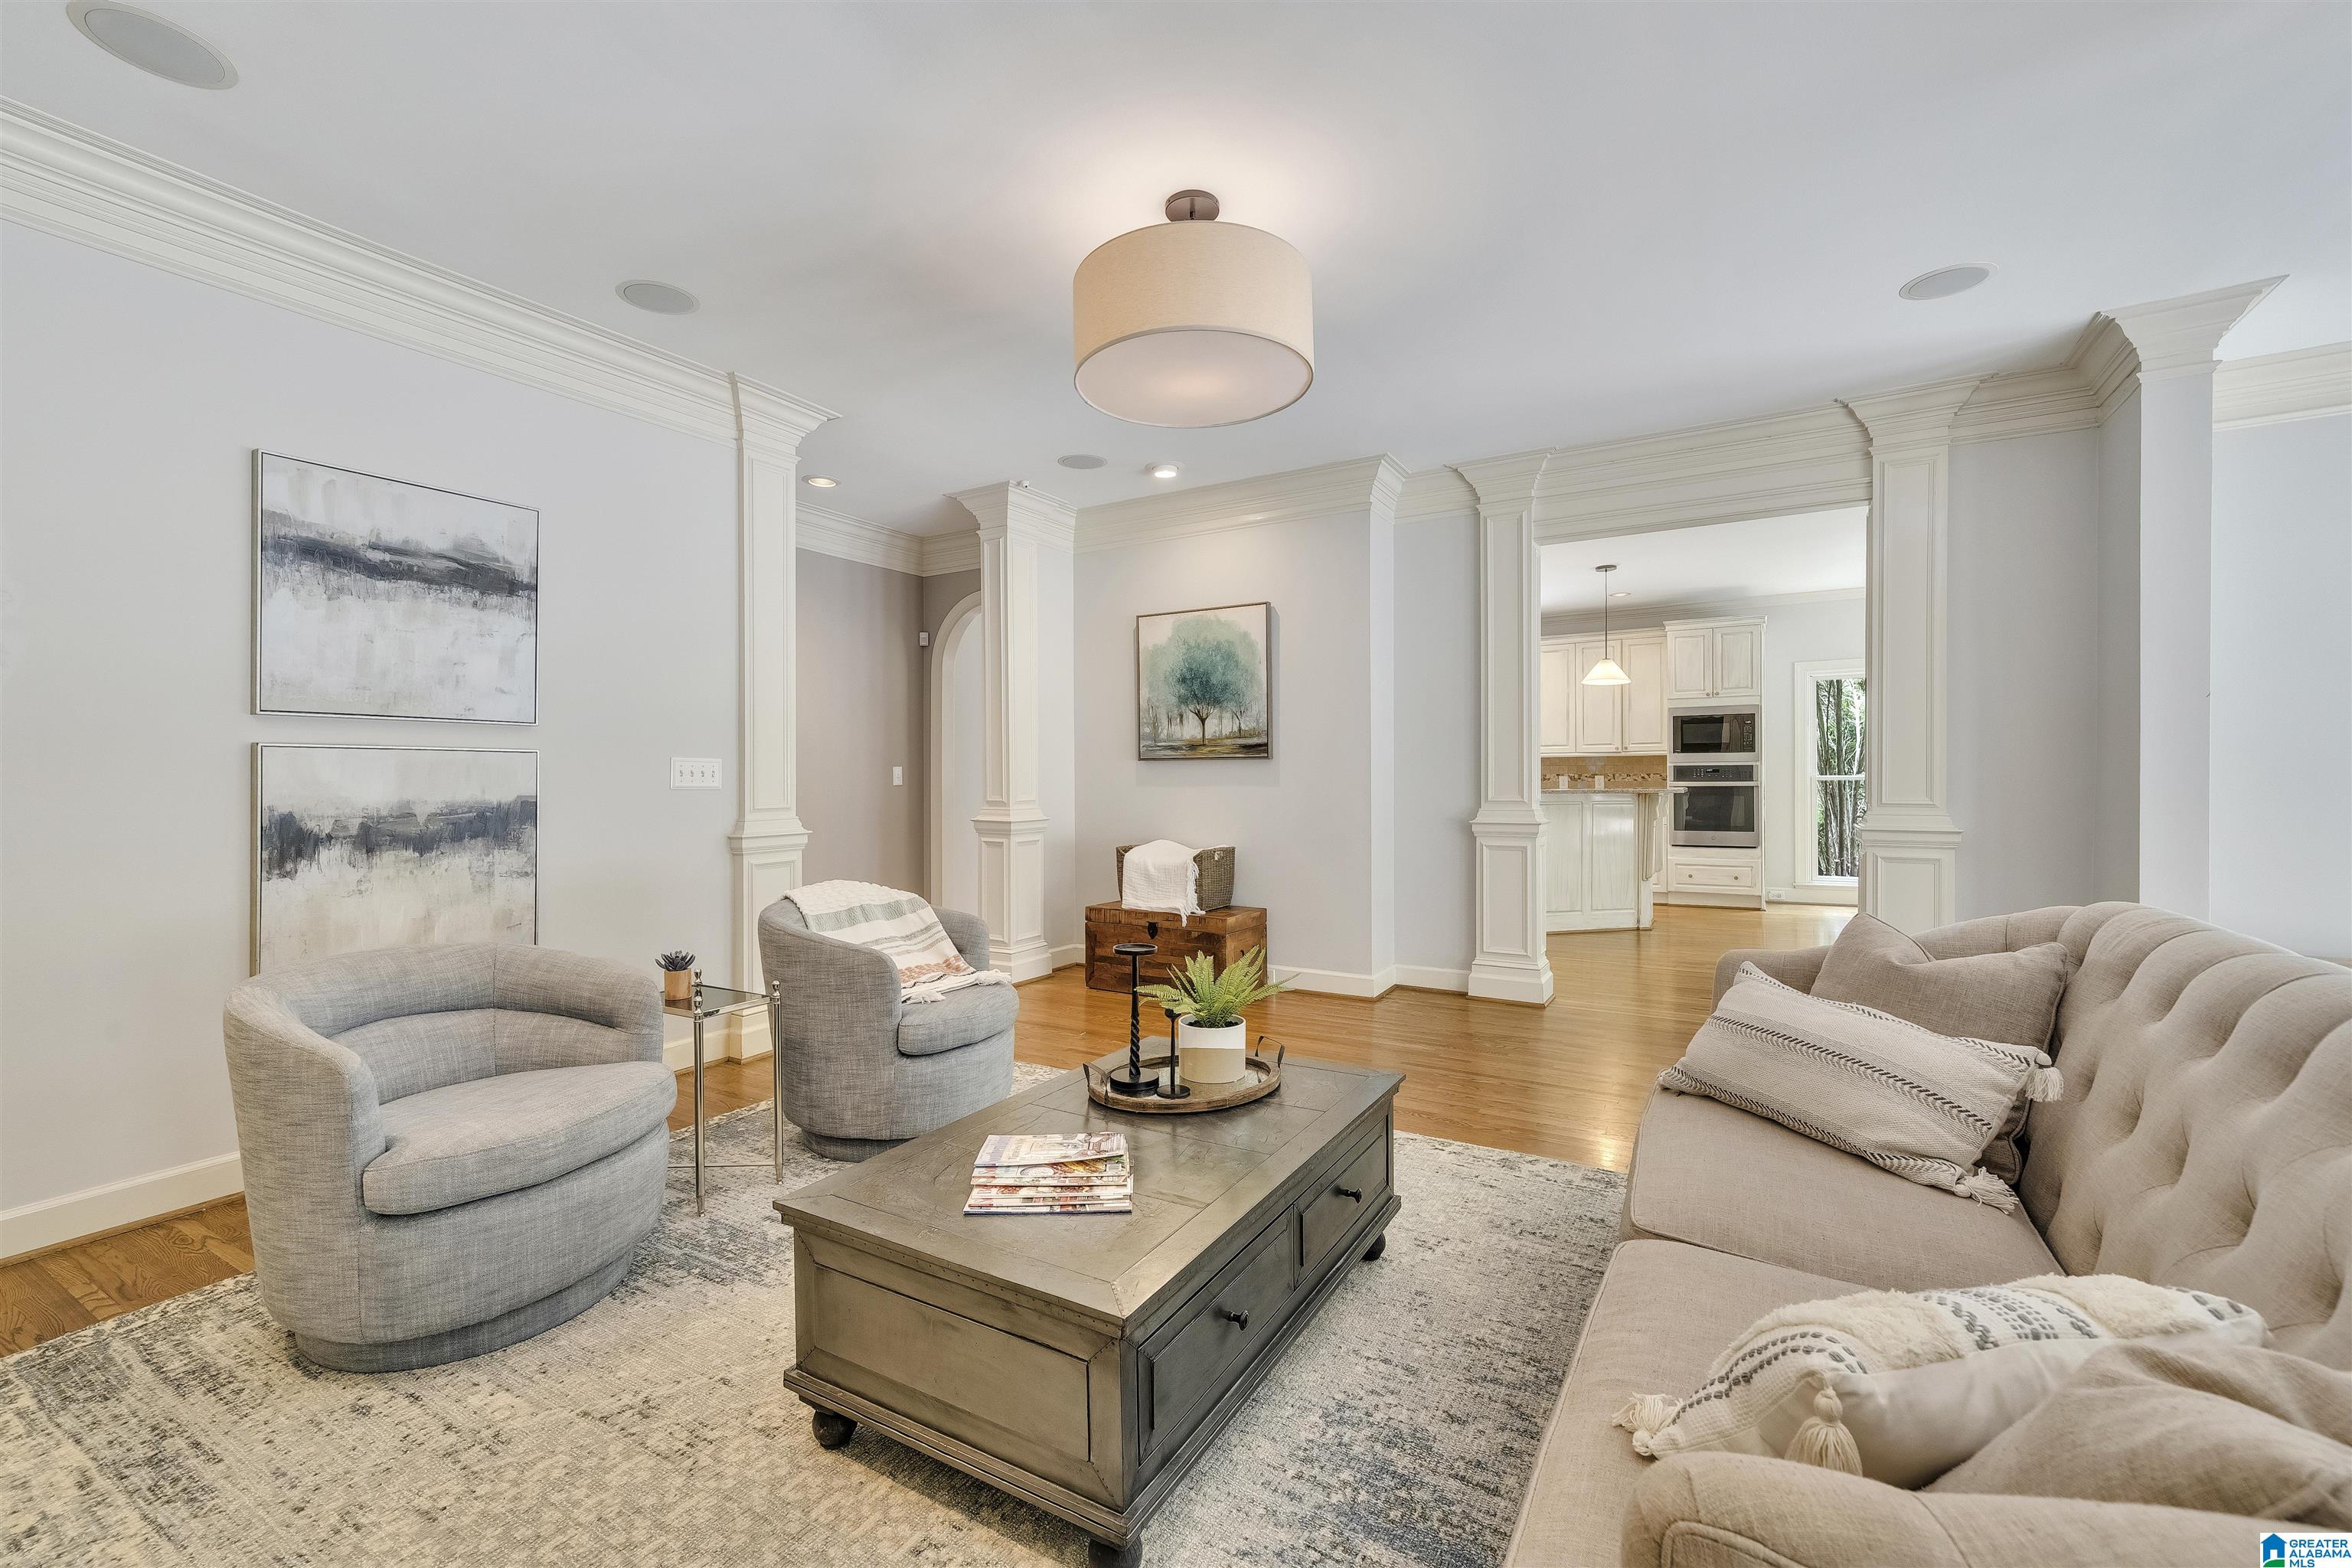
Active
$349,900
4
bds
|
0
ba
|
0
sqft
|
built
1915
1003 28th Pl S, Birmingham, AL 35205
$-552
Cash flow
-8.2%
Cash-on-Cash Return
3.8%
Cap rate
0.5%
Rent to Value Ratio
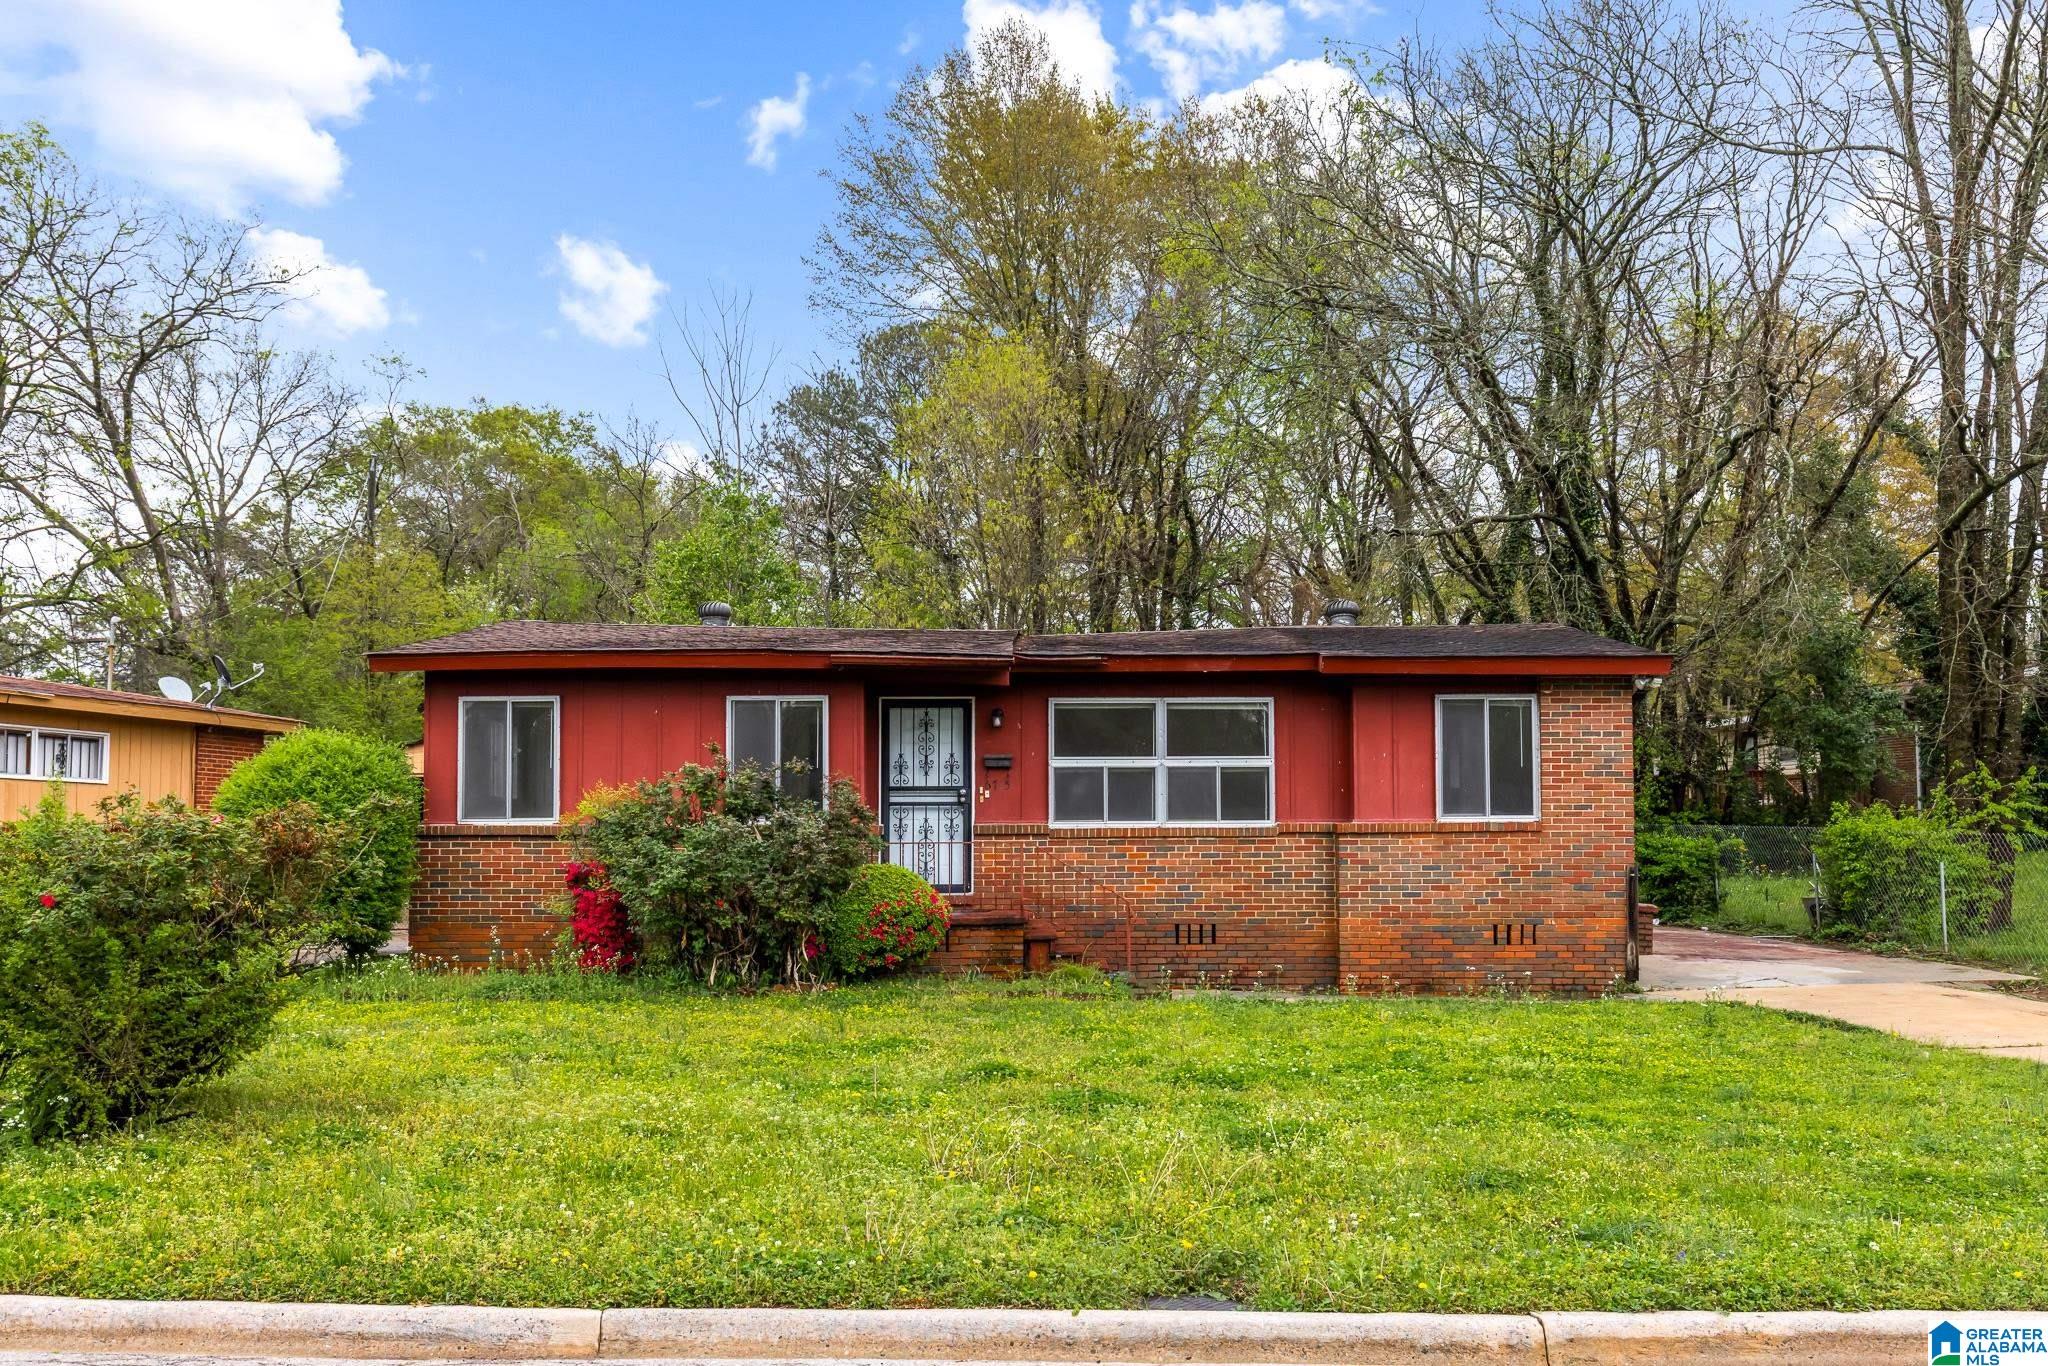
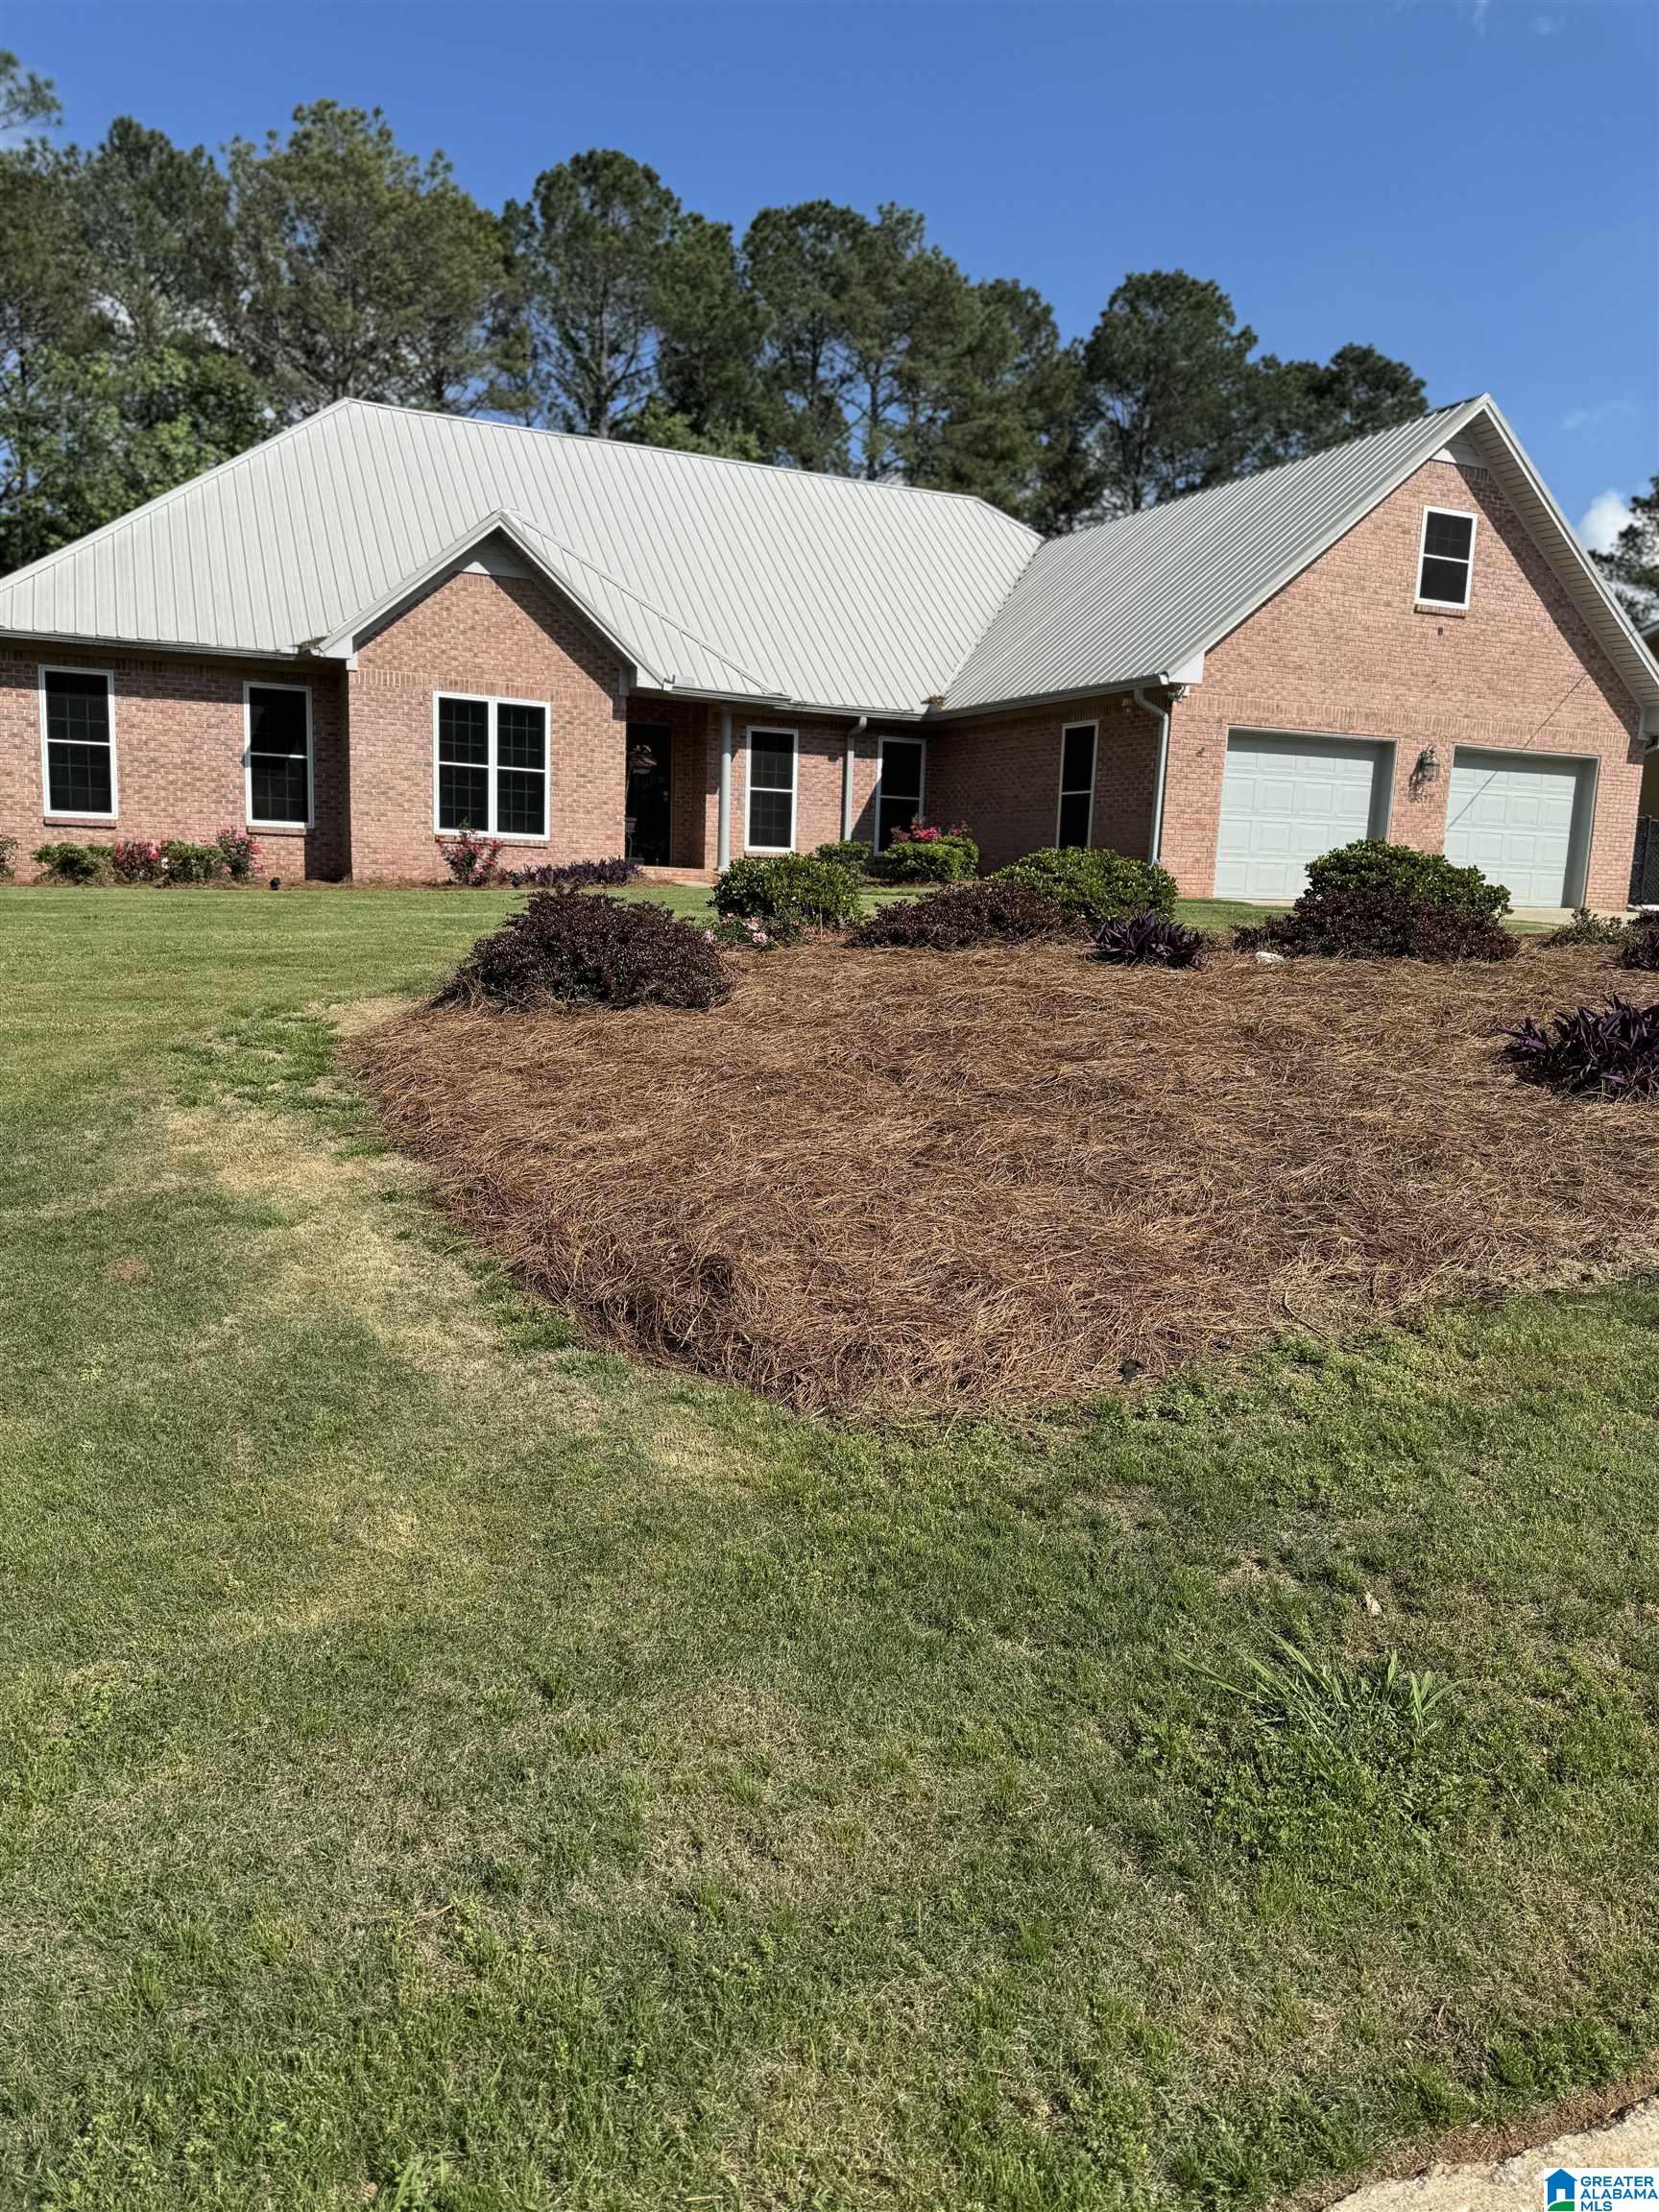
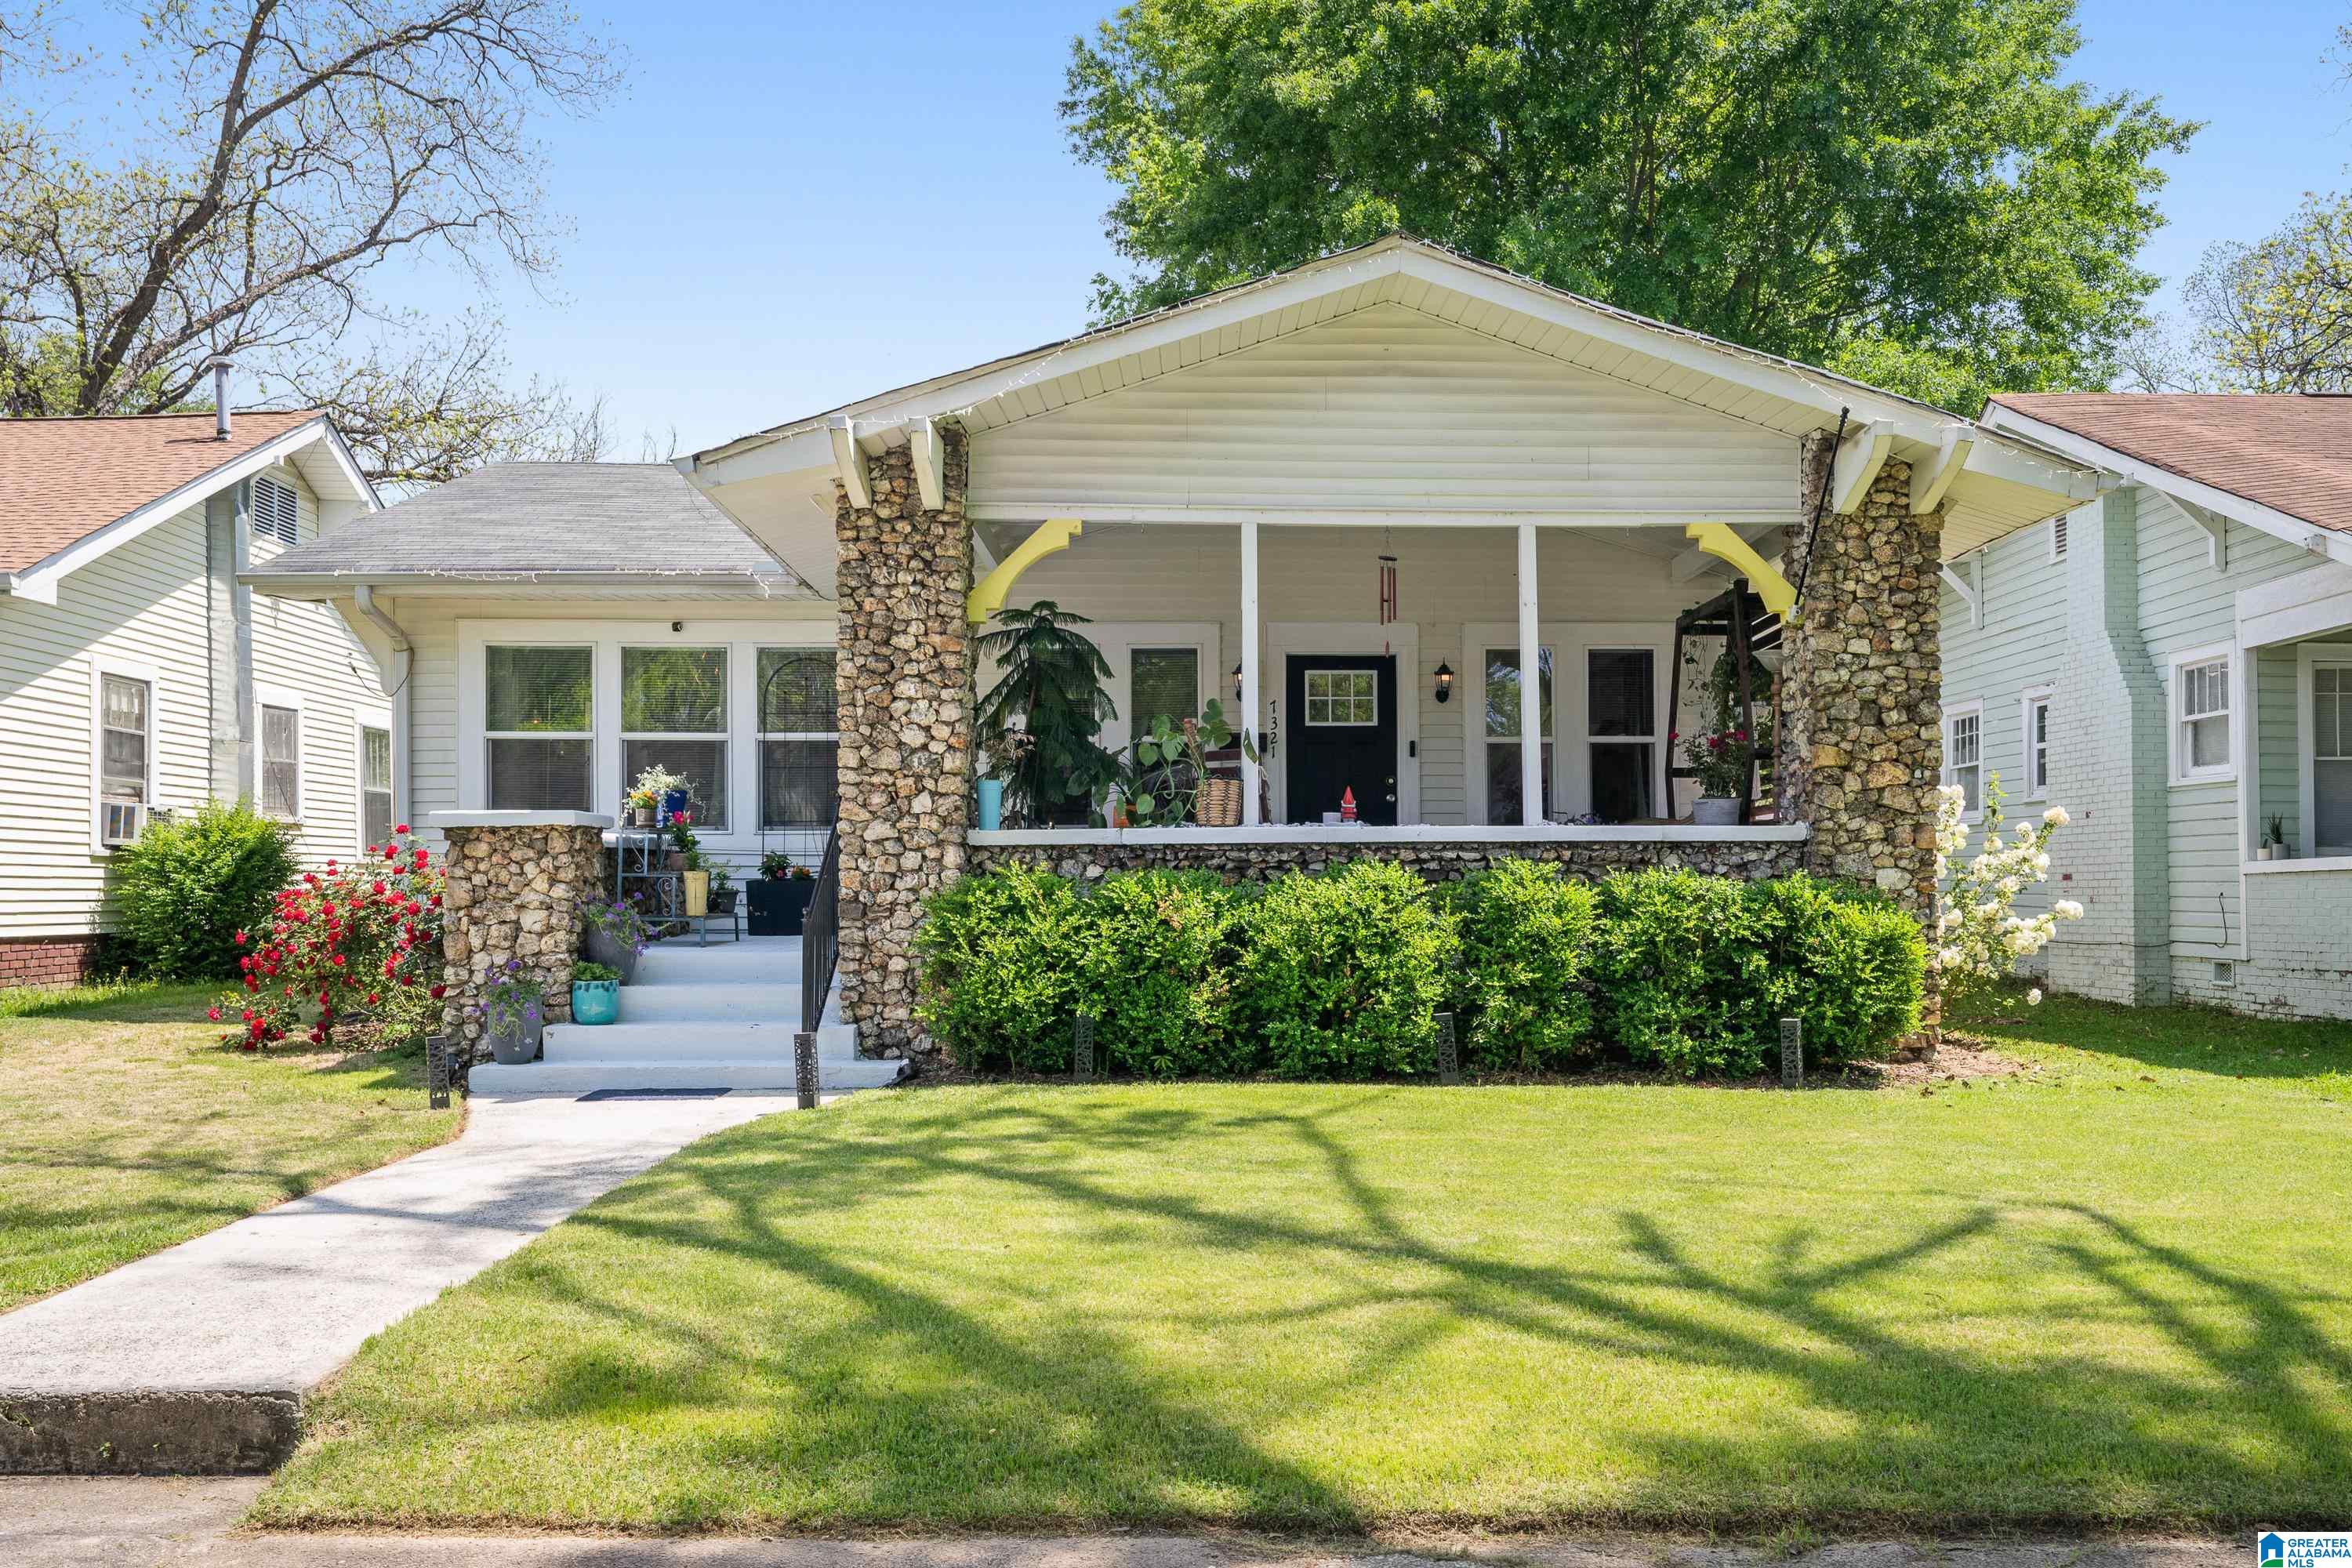
Active
$119,000
3
bds
|
0
ba
|
1,049
sqft
|
built
1958
6715 Court N, Birmingham, AL 35228
$403
Cash flow
17.7%
Cash-on-Cash Return
9.7%
Cap rate
1.2%
Rent to Value Ratio
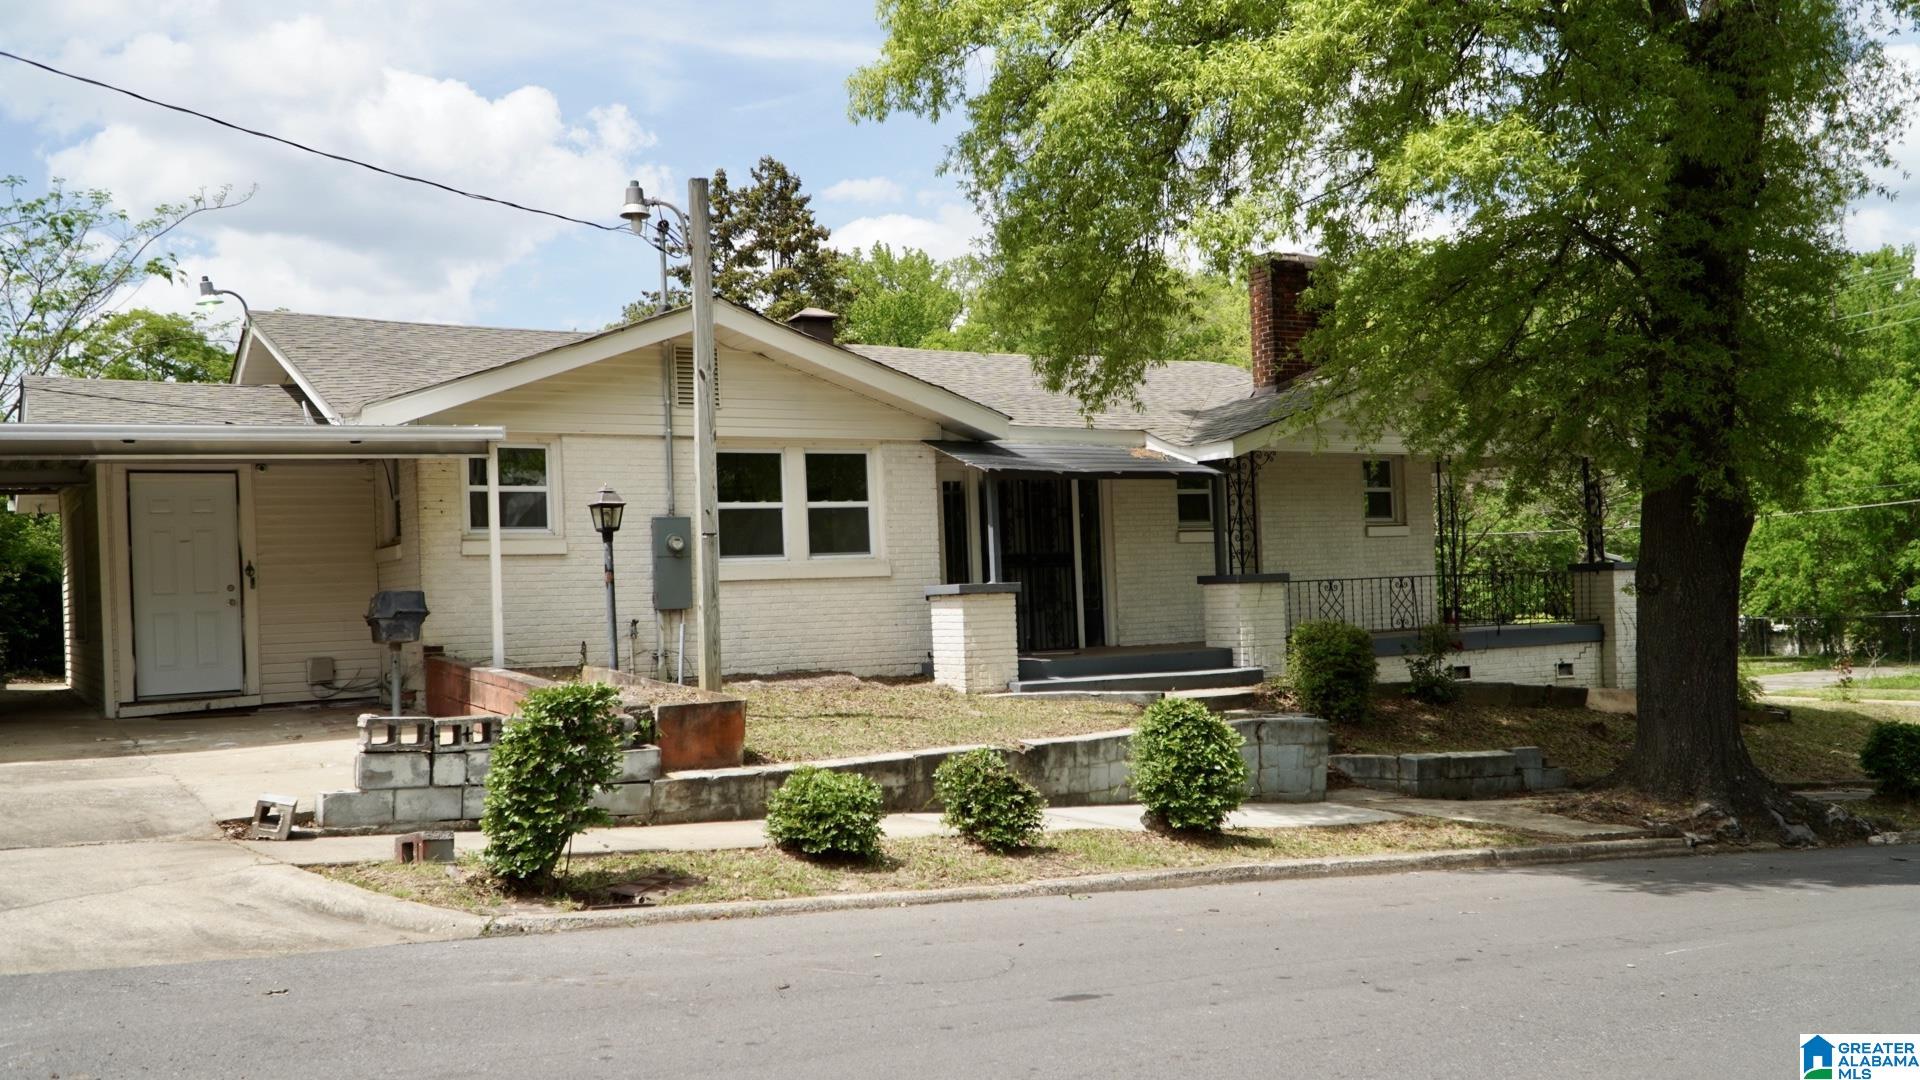
Active
$249,900
3
bds
|
0
ba
|
1,537
sqft
|
built
1935
1501 Graymont Ave W, Birmingham, AL 35208
$-355
Cash flow
-7.4%
Cash-on-Cash Return
4.0%
Cap rate
0.5%
Rent to Value Ratio
Active
$230,000
1
bds
|
0
ba
|
770
sqft
|
built
2007
2020 5th Ave S, Birmingham, AL 35233
$-53
Cash flow
-1.2%
Cash-on-Cash Return
5.4%
Cap rate
0.7%
Rent to Value Ratio
Active
$319,900
3
bds
|
0
ba
|
2,392
sqft
|
built
1999
2317 Carraway St, Birmingham, AL 35235
$-134
Cash flow
-2.2%
Cash-on-Cash Return
5.2%
Cap rate
0.6%
Rent to Value Ratio
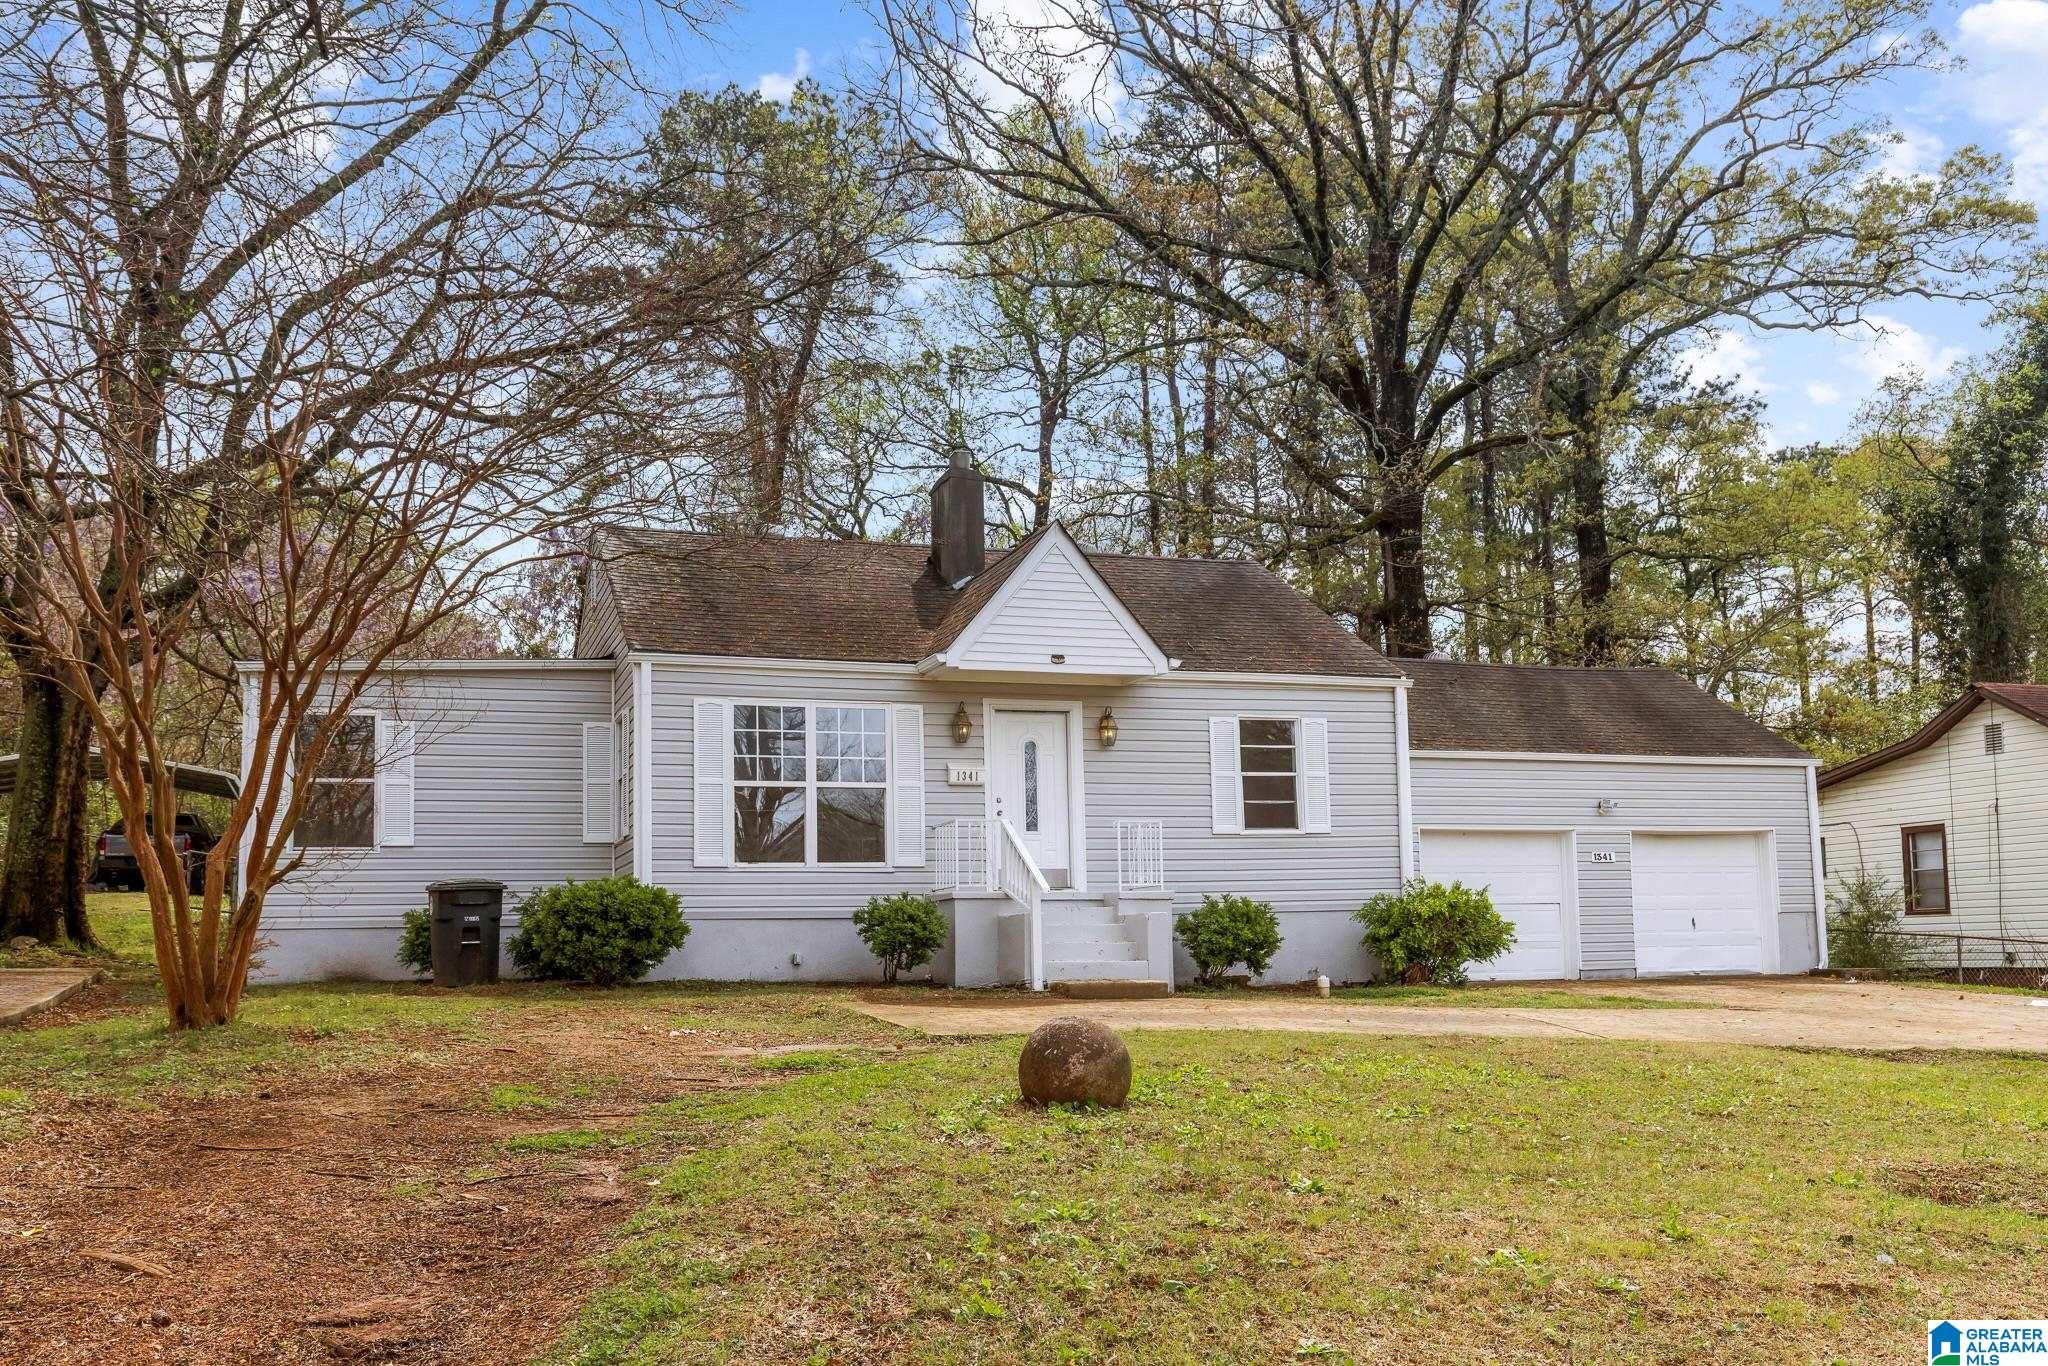
Active
$104,500
3
bds
|
0
ba
|
1,409
sqft
|
built
1941
1341 Pineview Rd, Birmingham, AL 35228
$264
Cash flow
13.2%
Cash-on-Cash Return
8.7%
Cap rate
1.1%
Rent to Value Ratio
Active
$80,000
2
bds
|
0
ba
|
1,080
sqft
|
built
1950
2017 49th Street Ensley, Birmingham, AL 35208
$380
Cash flow
24.8%
Cash-on-Cash Return
11.4%
Cap rate
1.4%
Rent to Value Ratio
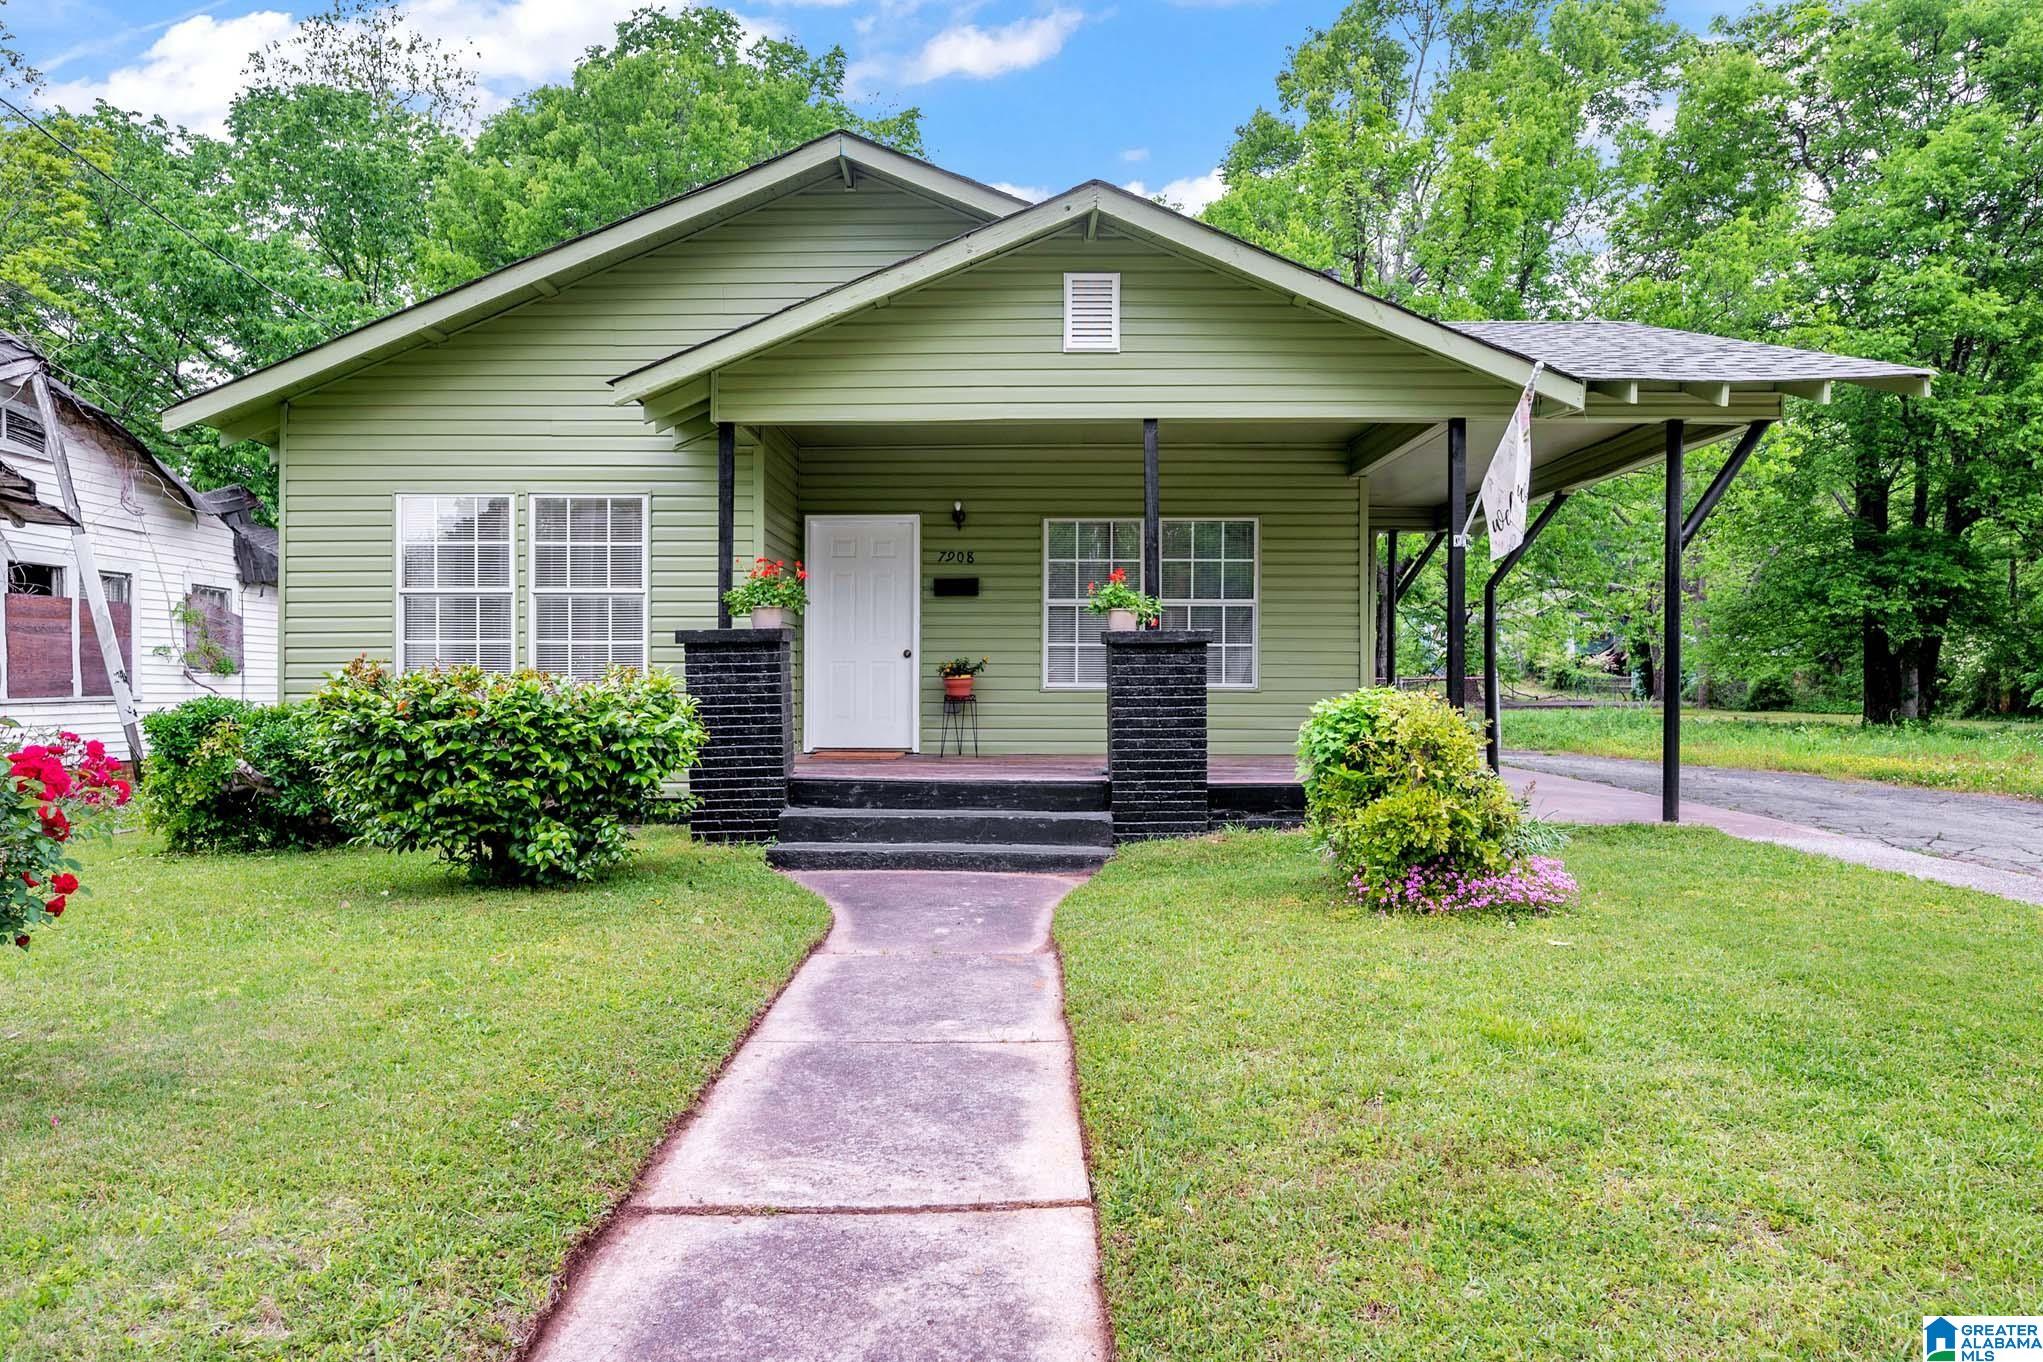
Active
$129,000
3
bds
|
0
ba
|
1,108
sqft
|
built
1935
7908 5th Ave N, Birmingham, AL 35206
$287
Cash flow
11.6%
Cash-on-Cash Return
8.3%
Cap rate
1.0%
Rent to Value Ratio
Active
$285,000
3
bds
|
0
ba
|
1,471
sqft
|
built
1935
3530 17th Ave N, Birmingham, AL 35234
$-521
Cash flow
-9.5%
Cash-on-Cash Return
3.5%
Cap rate
0.4%
Rent to Value Ratio
Active
$125,000
3
bds
|
0
ba
|
1,159
sqft
|
built
1981
1322 Frisco St, Birmingham, AL 35224
$305
Cash flow
12.7%
Cash-on-Cash Return
8.6%
Cap rate
1.0%
Rent to Value Ratio
Active
$489,900
4
bds
|
0
ba
|
2,869
sqft
|
built
2012
1114 Regent Park Dr, Birmingham, AL 35242
$-279
Cash flow
-3.0%
Cash-on-Cash Return
5.0%
Cap rate
0.6%
Rent to Value Ratio
Active
$100,000
3
bds
|
0
ba
|
1,540
sqft
|
built
1930
31 4th Ave S, Birmingham, AL 35205
$493
Cash flow
25.7%
Cash-on-Cash Return
11.6%
Cap rate
1.4%
Rent to Value Ratio
Active
$64,000
3
bds
|
0
ba
|
1,634
sqft
|
built
1930
2854 20th Street Ensley, Birmingham, AL 35208
$1,104
Cash flow
20.1%
Cash-on-Cash Return
20.7%
Cap rate
2.5%
Rent to Value Ratio
Active
$419,900
5
bds
|
0
ba
|
2,005
sqft
|
built
1983
5600 Double Tree Cir, Birmingham, AL 35242
$-469
Cash flow
-5.8%
Cash-on-Cash Return
4.3%
Cap rate
0.5%
Rent to Value Ratio
Active
$900,000
4
bds
|
0
ba
|
4,434
sqft
|
built
1994
3030 Hampton Cir, Birmingham, AL 35242
$-1,872
Cash flow
-10.9%
Cash-on-Cash Return
3.2%
Cap rate
0.4%
Rent to Value Ratio
Active
$219,900
2
bds
|
0
ba
|
1,442
sqft
|
built
1930
7321 1st Ave S, Birmingham, AL 35206
$132
Cash flow
3.1%
Cash-on-Cash Return
6.4%
Cap rate
0.8%
Rent to Value Ratio
Active
$240,000
3
bds
|
0
ba
|
2,074
sqft
|
built
1956
973 Pine Hill Rd, Birmingham, AL 35235
$244
Cash flow
5.3%
Cash-on-Cash Return
6.9%
Cap rate
0.8%
Rent to Value Ratio
Active
$695,000
4
bds
|
0
ba
|
3,234
sqft
|
built
2007
129 Biltmore Dr, Birmingham, AL 35242
$-648
Cash flow
-4.9%
Cash-on-Cash Return
4.6%
Cap rate
0.6%
Rent to Value Ratio
Active
$779,000
5
bds
|
0
ba
|
4,755
sqft
|
built
1995
8117 Castlehill Rd, Birmingham, AL 35242
$-1,066
Cash flow
-7.1%
Cash-on-Cash Return
4.0%
Cap rate
0.5%
Rent to Value Ratio
Pending
$399,000
3
bds
|
0
ba
|
1,190
sqft
|
built
1951
2030 22nd Ct S, Birmingham, AL 35223
$-163
Cash flow
-2.1%
Cash-on-Cash Return
5.2%
Cap rate
0.6%
Rent to Value Ratio
Active
$859,900
4
bds
|
0
ba
|
4,697
sqft
|
built
1998
208 North Way, Birmingham, AL 35242
$-1,698
Cash flow
-10.3%
Cash-on-Cash Return
3.3%
Cap rate
0.4%
Rent to Value Ratio
Active
$124,900
2
bds
|
0
ba
|
1,072
sqft
|
built
1983
2435 Hampstead Dr, Birmingham, AL 35235
$168
Cash flow
7.0%
Cash-on-Cash Return
7.3%
Cap rate
0.9%
Rent to Value Ratio

Active
$198,900
4
bds
|
0
ba
|
0
sqft
|
built
1935
1741 26th Street Ensley, Birmingham, AL 35218
$94
Cash flow
2.5%
Cash-on-Cash Return
6.2%
Cap rate
0.8%
Rent to Value Ratio
Pending
$78,900
3
bds
|
0
ba
|
1,148
sqft
|
built
1910
633 6th Pl, Birmingham, AL 35214
$317
Cash flow
21.0%
Cash-on-Cash Return
10.5%
Cap rate
1.3%
Rent to Value Ratio

Active
$249,900
3
bds
|
0
ba
|
1,956
sqft
|
built
1981
1300 Beacon Pkwy E, Birmingham, AL 35209
$335
Cash flow
7.0%
Cash-on-Cash Return
7.3%
Cap rate
0.9%
Rent to Value Ratio
Active
$344,800
3
bds
|
0
ba
|
1,060
sqft
|
built
1950
1618 26th Ave S, Birmingham, AL 35209
$-666
Cash flow
-10.1%
Cash-on-Cash Return
3.4%
Cap rate
0.4%
Rent to Value Ratio
Active
$70,900
2
bds
|
0
ba
|
1,032
sqft
|
built
1930
2716 29th Street Ensley, Birmingham, AL 35208
$690
Cash flow
11.3%
Cash-on-Cash Return
11.7%
Cap rate
1.4%
Rent to Value Ratio
Active under contract
$184,900
5
bds
|
0
ba
|
2,170
sqft
|
built
1960
1013 Jeffery Dr, Birmingham, AL 35235
$505
Cash flow
14.2%
Cash-on-Cash Return
9.0%
Cap rate
1.1%
Rent to Value Ratio
Active
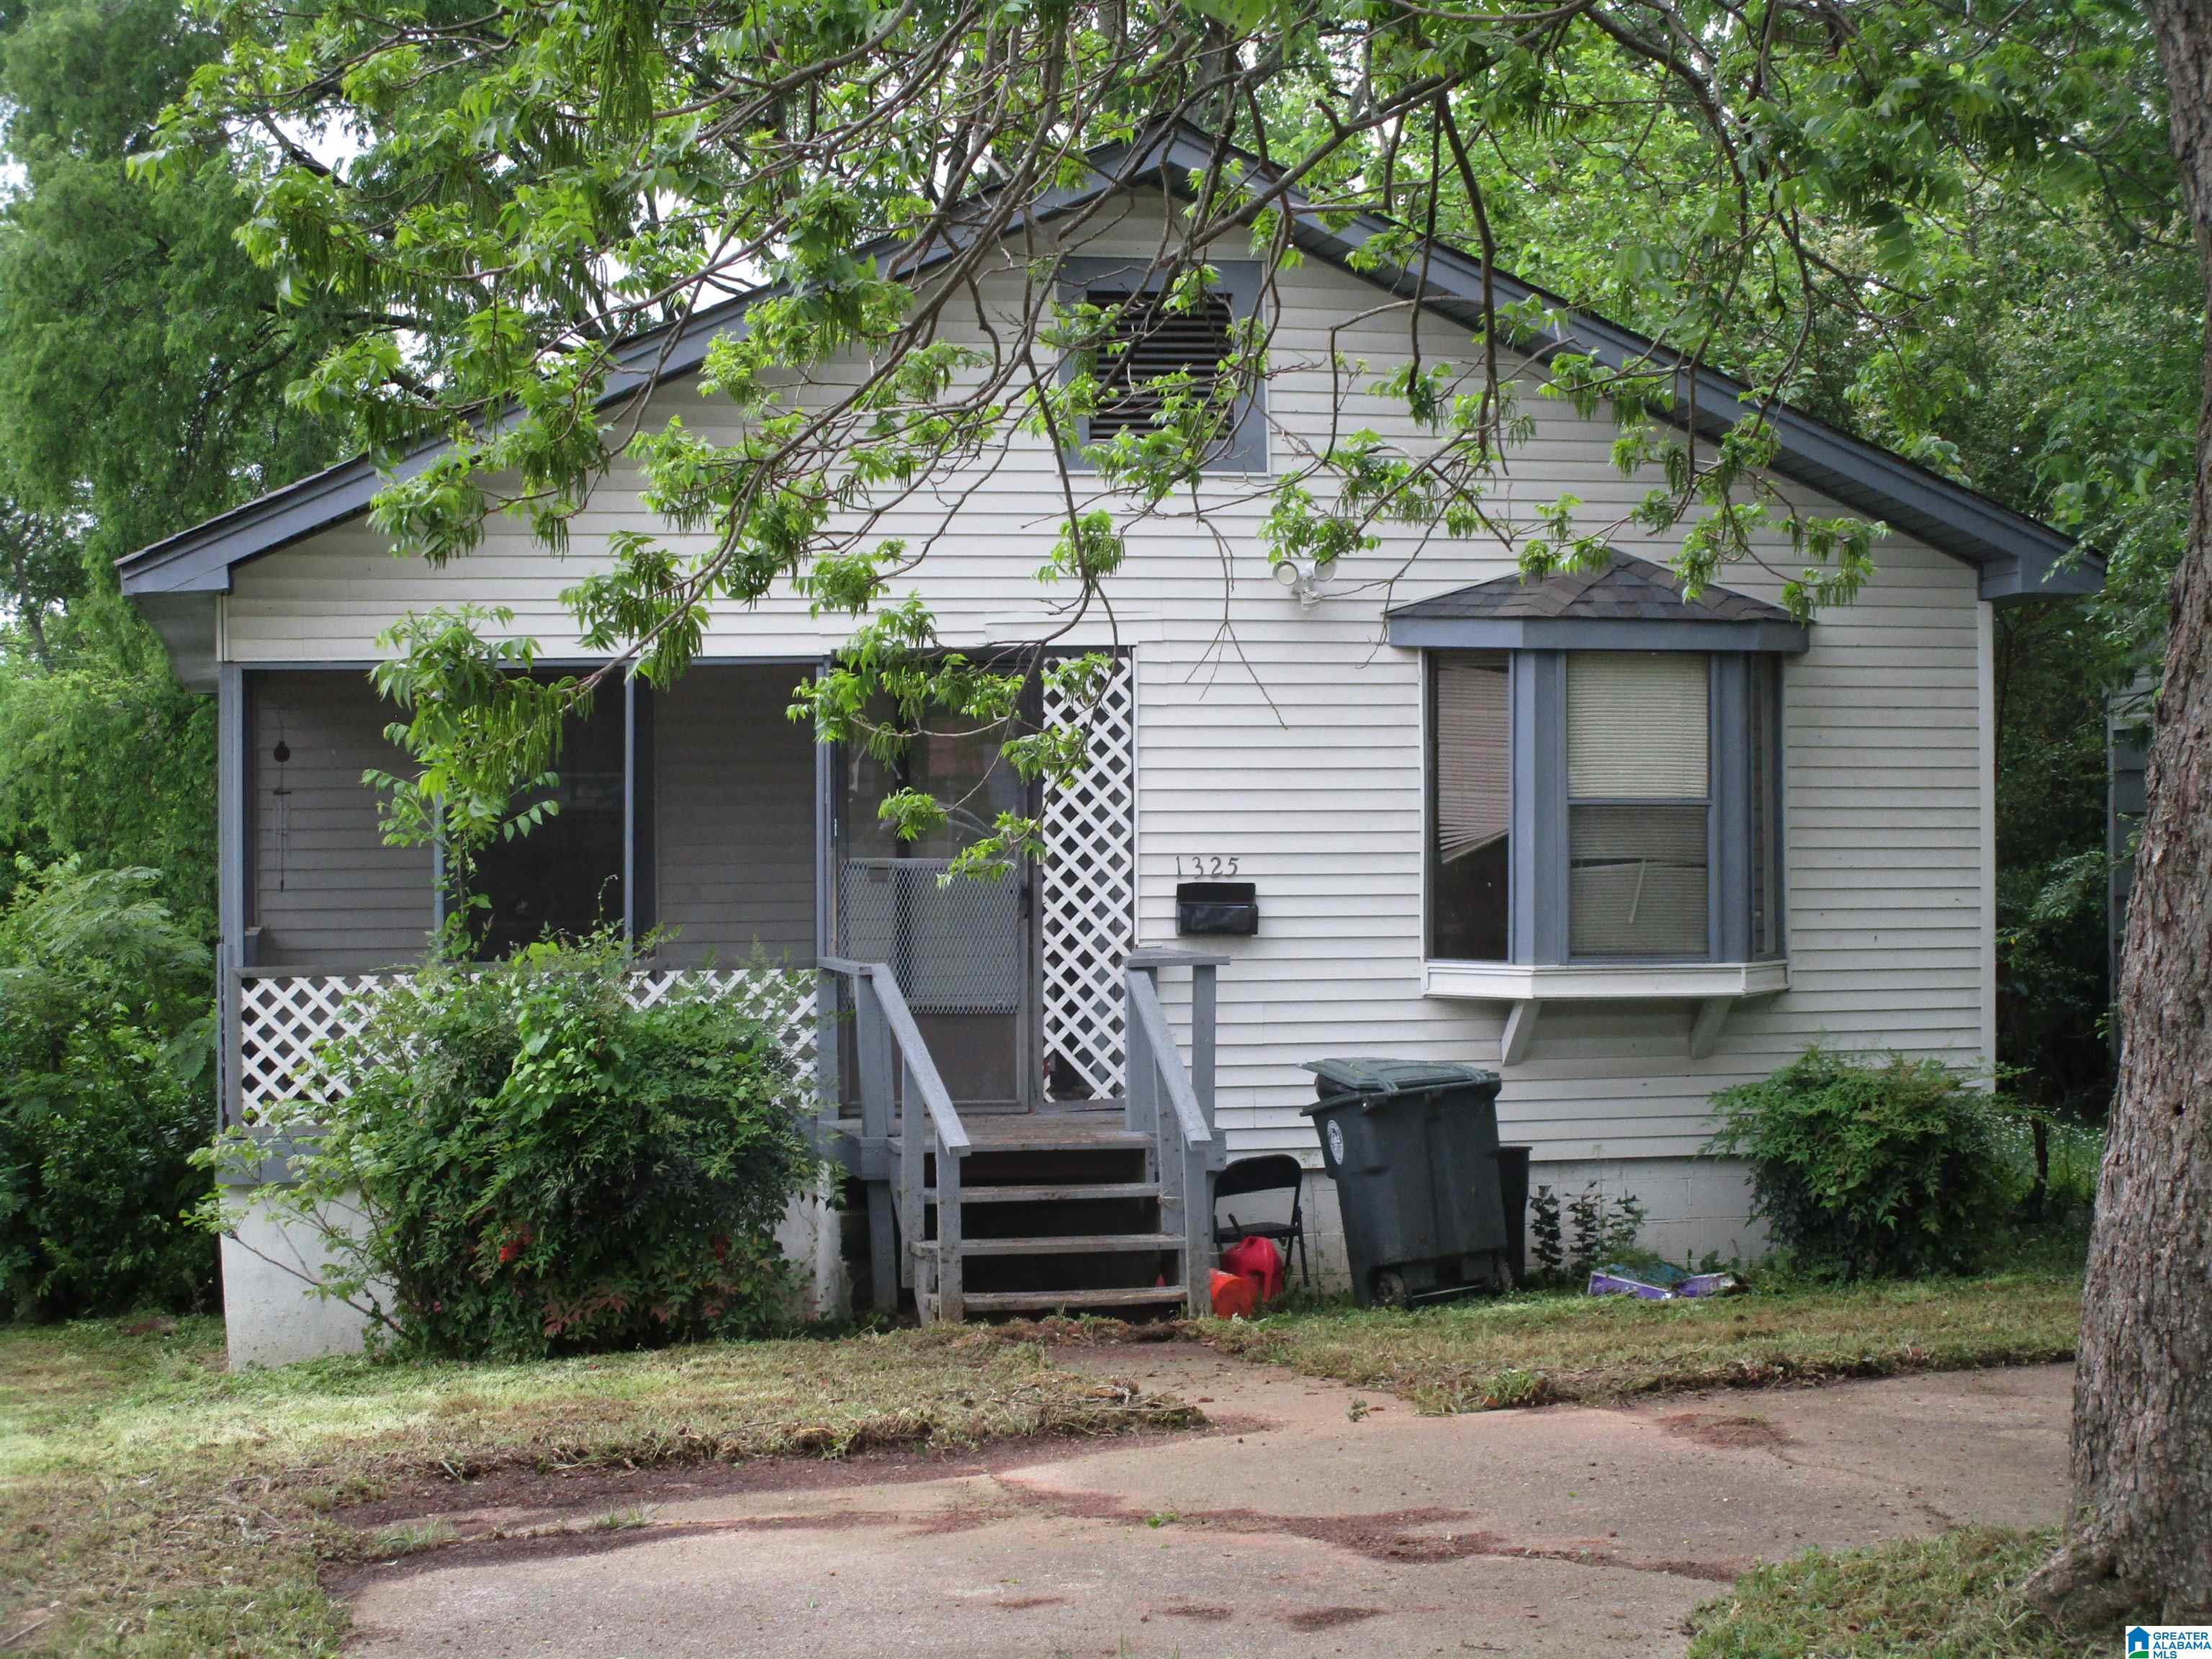
$85,900
2
bds
|
0
ba
|
958
sqft
|
built
1950
1325 33 Rd St, Birmingham, AL 35208
$214
Cash flow
13.0%
Cash-on-Cash Return
8.7%
Cap rate
1.0%
Rent to Value Ratio
Active
$229,900
3
bds
|
0
ba
|
2,000
sqft
|
built
1971
1437 Ware Blvd, Birmingham, AL 35235
$16
Cash flow
0.4%
Cash-on-Cash Return
5.8%
Cap rate
0.7%
Rent to Value Ratio
Active
$885,000
4
bds
|
0
ba
|
5,213
sqft
|
built
1993
3596 Shandwick Pl, Birmingham, AL 35242
$-1,898
Cash flow
-11.2%
Cash-on-Cash Return
3.1%
Cap rate
0.4%
Rent to Value Ratio
Active
$219,000
3
bds
|
0
ba
|
1,914
sqft
|
built
1955
905 Idlewood Cir, Birmingham, AL 35235
$68
Cash flow
1.6%
Cash-on-Cash Return
6.0%
Cap rate
0.7%
Rent to Value Ratio
Active
$505,000
4
bds
|
0
ba
|
2,272
sqft
|
built
1909
1801 11th Pl S, Birmingham, AL 35205
$-182
Cash flow
-1.9%
Cash-on-Cash Return
5.2%
Cap rate
0.6%
Rent to Value Ratio
Active
$349,900
1
bds
|
0
ba
|
1,132
sqft
|
built
1920
113 22nd St N, Birmingham, AL 35203
$-271
Cash flow
-4.0%
Cash-on-Cash Return
4.7%
Cap rate
0.7%
Rent to Value Ratio
Active
$317,900
2
bds
|
0
ba
|
1,201
sqft
|
built
1920
1016 42nd St S, Birmingham, AL 35222
$-444
Cash flow
-7.3%
Cash-on-Cash Return
4.0%
Cap rate
0.6%
Rent to Value Ratio
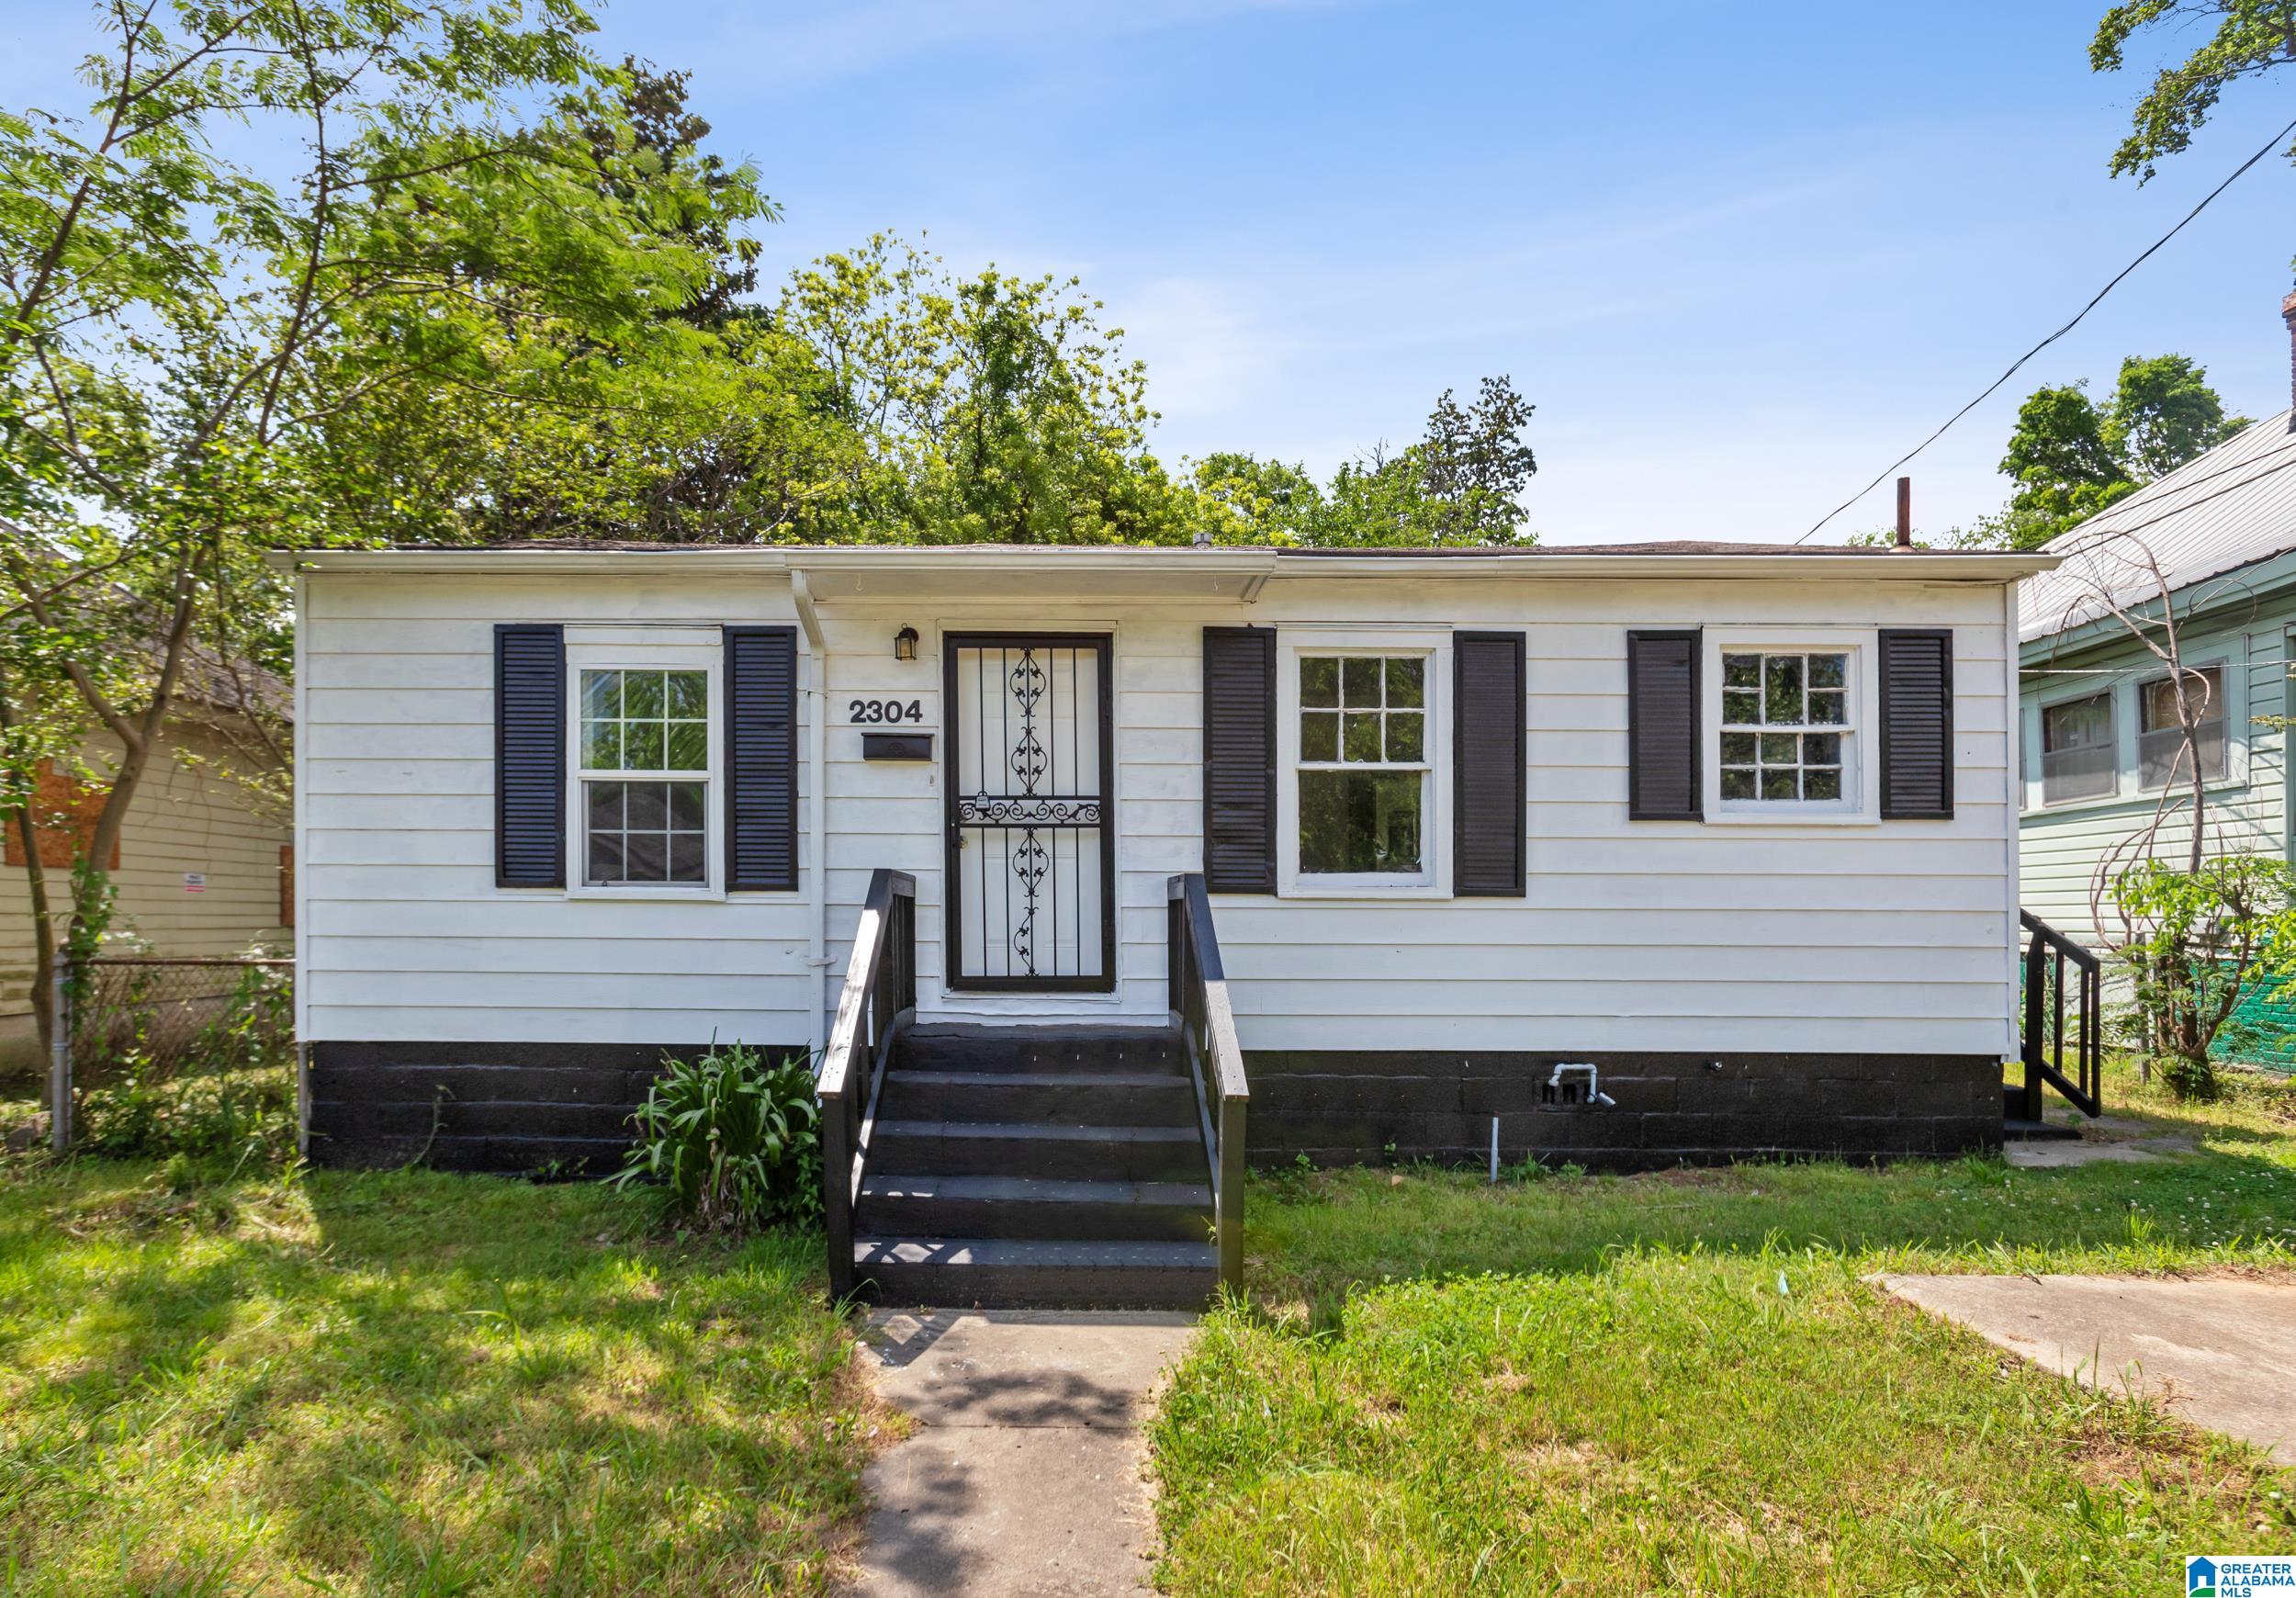
Active
$100,000
3
bds
|
0
ba
|
1,381
sqft
|
built
1950
2304 Eufaula Ave, Birmingham, AL 35208
$493
Cash flow
25.7%
Cash-on-Cash Return
11.6%
Cap rate
1.4%
Rent to Value Ratio
Active
$635,900
4
bds
|
0
ba
|
3,943
sqft
|
built
1999
4342 Milner Rd W, Birmingham, AL 35242
$-686
Cash flow
-5.6%
Cash-on-Cash Return
4.4%
Cap rate
0.6%
Rent to Value Ratio