Birmingham, AL Investment Properties for Sale
Browse homes for sale and investment properties in Birmingham, AL. Refine your search by price, property type, or more.
Best cash flowing properties in Birmingham, AL
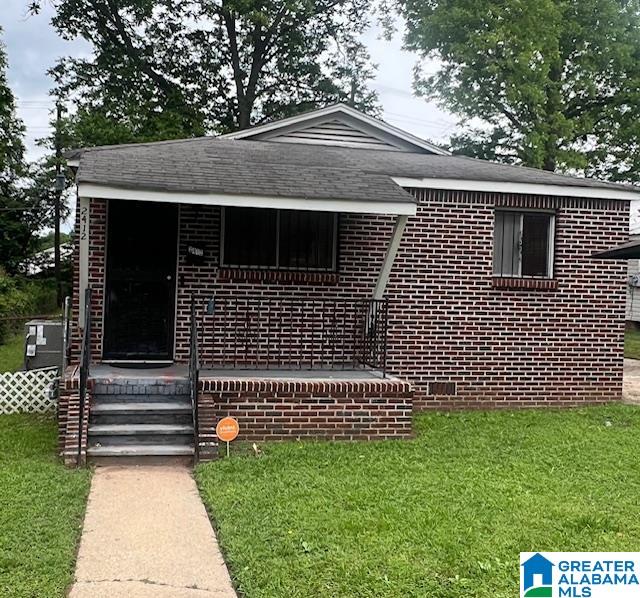
Active under contract
$94,900
3
bds
|
0
ba
|
1,968
sqft
|
built
1962
1925 Etowah St, Birmingham, AL 35217
$931
Cash flow
51.2%
Cash-on-Cash Return
17.4%
Cap rate
2.1%
Rent to Value Ratio
Active
$45,000
4
bds
|
0
ba
|
2,096
sqft
|
built
1939
345 63rd St S, Birmingham, AL 35212
$897
Cash flow
23.2%
Cash-on-Cash Return
23.9%
Cap rate
2.9%
Rent to Value Ratio
923 out of 1,038 properties for sale in Birmingham, AL
Limited Results Shown
Create a free account, or log in to reveal all property listings and enjoy the complete experience.
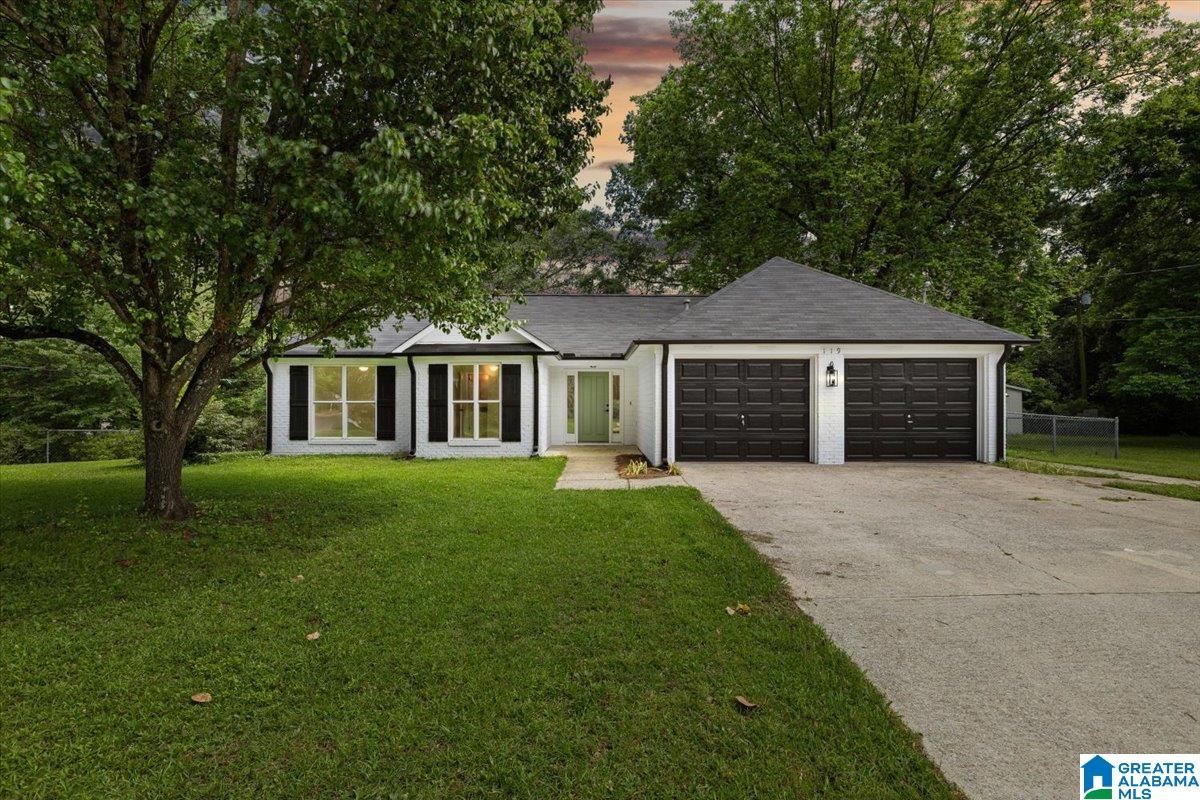
Active
$434,900
3
bds
|
0
ba
|
1,332
sqft
|
built
1999
119 Oxmoor Rd, Birmingham, AL 35209
$-333
Cash flow
-4.0%
Cash-on-Cash Return
4.8%
Cap rate
0.6%
Rent to Value Ratio
Active
$155,000
3
bds
|
0
ba
|
1,226
sqft
|
built
1973
2270 Smithfield Ln N, Birmingham, AL 35207
$232
Cash flow
7.8%
Cash-on-Cash Return
7.5%
Cap rate
0.9%
Rent to Value Ratio
Active
$85,000
3
bds
|
0
ba
|
975
sqft
|
built
1965
2412 Lawn Ave SW, Birmingham, AL 35211
$357
Cash flow
21.9%
Cash-on-Cash Return
10.7%
Cap rate
1.3%
Rent to Value Ratio
Active
$174,900
3
bds
|
0
ba
|
1,329
sqft
|
built
1973
413 Lance Ln, Birmingham, AL 35206
$276
Cash flow
8.2%
Cash-on-Cash Return
7.6%
Cap rate
0.9%
Rent to Value Ratio
Active
$145,000
3
bds
|
0
ba
|
984
sqft
|
built
1952
6601 4th Ave S, Birmingham, AL 35212
$211
Cash flow
7.6%
Cash-on-Cash Return
7.4%
Cap rate
0.9%
Rent to Value Ratio
Active
$875,000
5
bds
|
0
ba
|
4,579
sqft
|
built
1990
3213 Brook Highland Trce, Birmingham, AL 35242
$-788
Cash flow
-4.7%
Cash-on-Cash Return
4.6%
Cap rate
0.6%
Rent to Value Ratio
Active
$900,000
4
bds
|
0
ba
|
3,900
sqft
|
built
2006
5226 Mountain Ridge Pkwy, Birmingham, AL 35222
$-1,718
Cash flow
-10.0%
Cash-on-Cash Return
3.4%
Cap rate
0.4%
Rent to Value Ratio
Active
$110,000
3
bds
|
0
ba
|
1,946
sqft
|
built
1953
905 77th St S, Birmingham, AL 35206
$376
Cash flow
17.8%
Cash-on-Cash Return
9.8%
Cap rate
1.2%
Rent to Value Ratio
Active under contract
$625,000
4
bds
|
0
ba
|
3,126
sqft
|
built
2007
152 Biltmore Dr, Birmingham, AL 35242
$-317
Cash flow
-2.6%
Cash-on-Cash Return
5.1%
Cap rate
0.6%
Rent to Value Ratio
Active
$275,000
3
bds
|
0
ba
|
1,506
sqft
|
built
1936
2820 Norwood Blvd, Birmingham, AL 35234
$-197
Cash flow
-3.7%
Cash-on-Cash Return
4.8%
Cap rate
0.6%
Rent to Value Ratio
Active
$345,000
3
bds
|
0
ba
|
1,422
sqft
|
built
2004
2257 Acton Park Cir, Birmingham, AL 35243
$-328
Cash flow
-5.0%
Cash-on-Cash Return
4.5%
Cap rate
0.6%
Rent to Value Ratio
Active under contract
$99,500
3
bds
|
0
ba
|
1,476
sqft
|
built
1920
1629 Steiner Ave SW, Birmingham, AL 35211
$495
Cash flow
26.0%
Cash-on-Cash Return
11.7%
Cap rate
1.4%
Rent to Value Ratio
Active
$835,000
4
bds
|
0
ba
|
3,350
sqft
|
built
2022
1052 Glendale Dr, Birmingham, AL 35242
$-1,032
Cash flow
-6.4%
Cash-on-Cash Return
4.2%
Cap rate
0.5%
Rent to Value Ratio
Active
$137,000
2
bds
|
0
ba
|
1,058
sqft
|
built
1930
5112 2nd Ave N, Birmingham, AL 35212
$111
Cash flow
4.2%
Cash-on-Cash Return
6.6%
Cap rate
0.8%
Rent to Value Ratio
Active
$335,000
3
bds
|
0
ba
|
1,450
sqft
|
built
1965
4817 3rd Ave S, Birmingham, AL 35222
$-205
Cash flow
-3.2%
Cash-on-Cash Return
4.9%
Cap rate
0.6%
Rent to Value Ratio
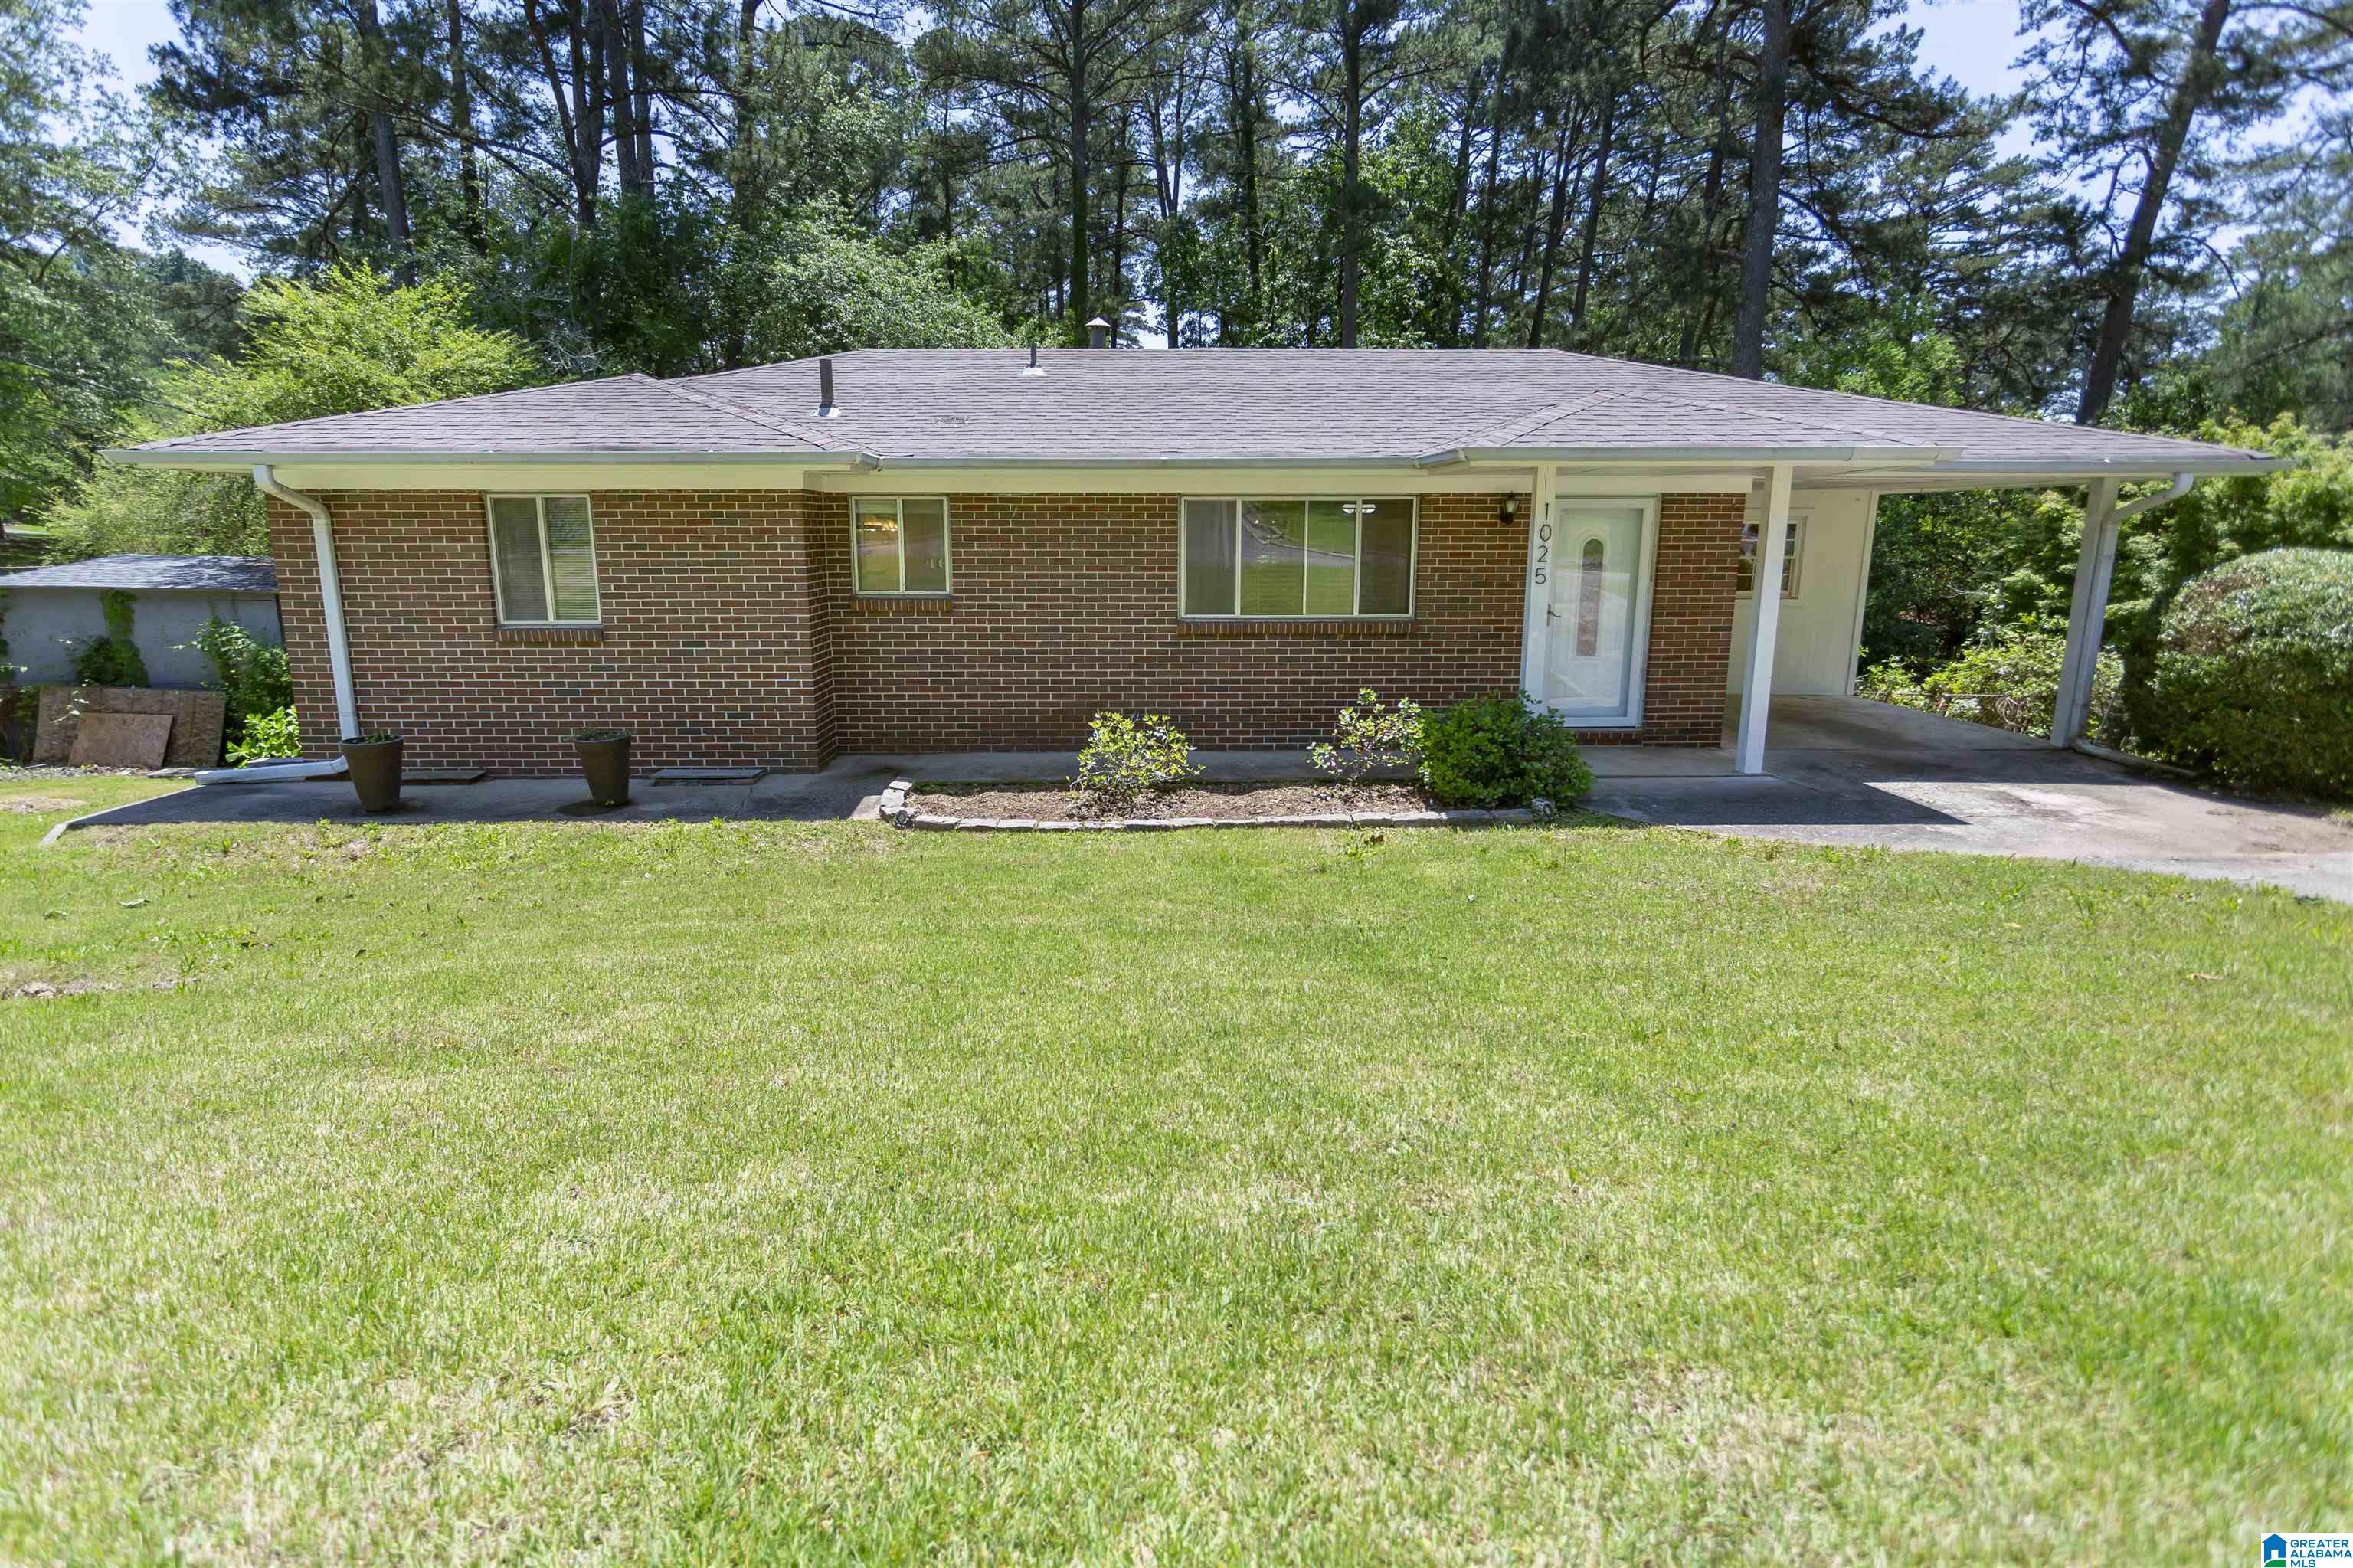
Active under contract
$170,000
3
bds
|
0
ba
|
1,897
sqft
|
built
1958
1025 Barnisdale Rd, Birmingham, AL 35235
$162
Cash flow
5.0%
Cash-on-Cash Return
6.8%
Cap rate
0.8%
Rent to Value Ratio
Active
$1,149,000
6
bds
|
0
ba
|
5,604
sqft
|
built
2003
501 Stewards Gln, Birmingham, AL 35242
$-2,909
Cash flow
-13.2%
Cash-on-Cash Return
2.6%
Cap rate
0.3%
Rent to Value Ratio
Active
$395,900
4
bds
|
0
ba
|
2,733
sqft
|
built
1978
1921 Indian Lake Dr, Birmingham, AL 35244
$-149
Cash flow
-2.0%
Cash-on-Cash Return
5.2%
Cap rate
0.6%
Rent to Value Ratio
Active
$45,000
4
bds
|
0
ba
|
2,096
sqft
|
built
1939
345 63rd St S, Birmingham, AL 35212
$897
Cash flow
23.2%
Cash-on-Cash Return
23.9%
Cap rate
2.9%
Rent to Value Ratio
Active
$85,000
2
bds
|
0
ba
|
820
sqft
|
built
1972
1623 Wharton Ave, Birmingham, AL 35217
$219
Cash flow
13.4%
Cash-on-Cash Return
8.8%
Cap rate
1.1%
Rent to Value Ratio
Active
$329,000
1
bds
|
0
ba
|
608
sqft
|
built
2020
2212 Morris Ave, Birmingham, AL 35203
$-558
Cash flow
-8.8%
Cash-on-Cash Return
3.6%
Cap rate
0.5%
Rent to Value Ratio
Active
$655,000
4
bds
|
0
ba
|
3,396
sqft
|
built
2001
263 Highland Park Dr, Birmingham, AL 35242
$-788
Cash flow
-6.3%
Cash-on-Cash Return
4.2%
Cap rate
0.5%
Rent to Value Ratio
Active
$499,900
3
bds
|
0
ba
|
2,032
sqft
|
built
1981
1209 29th St S, Birmingham, AL 35205
$-527
Cash flow
-5.5%
Cash-on-Cash Return
4.4%
Cap rate
0.6%
Rent to Value Ratio
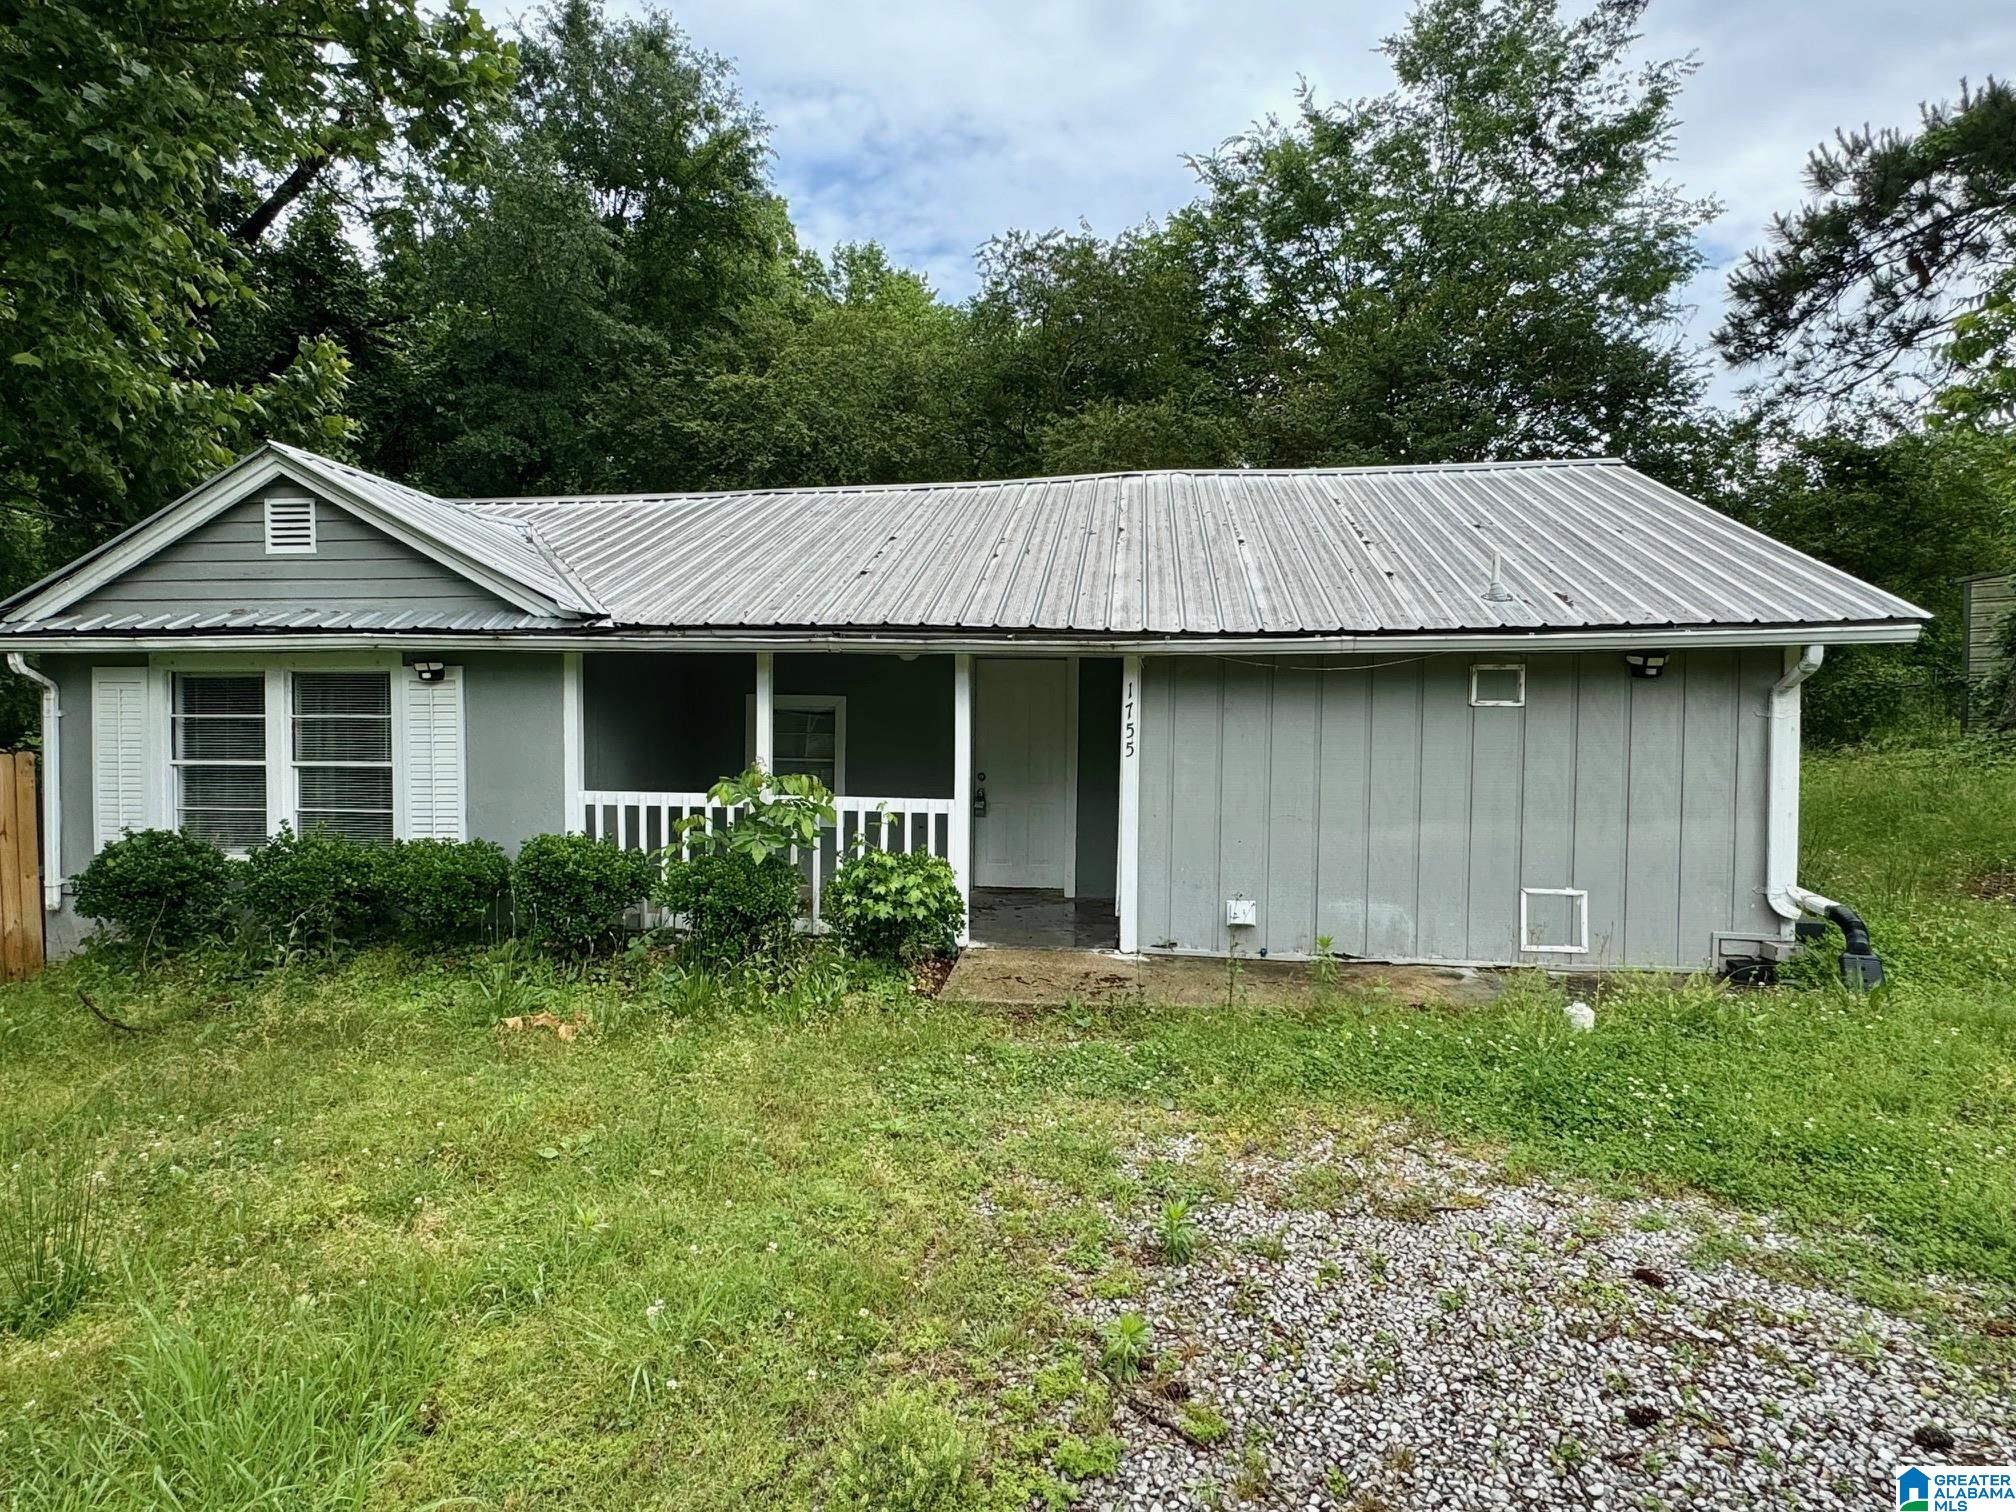
Active
$95,000
3
bds
|
0
ba
|
878
sqft
|
built
1948
1755 Circlewood Dr, Birmingham, AL 35214
$309
Cash flow
17.0%
Cash-on-Cash Return
9.6%
Cap rate
1.2%
Rent to Value Ratio
Pending
$559,900
5
bds
|
0
ba
|
3,312
sqft
|
built
2015
3781 Snowshill Dr, Birmingham, AL 35242
$-492
Cash flow
-4.6%
Cash-on-Cash Return
4.6%
Cap rate
0.6%
Rent to Value Ratio
Active
$329,000
2
bds
|
0
ba
|
1,011
sqft
|
built
1974
2625 Highland Ave S, Birmingham, AL 35205
$-717
Cash flow
-11.4%
Cash-on-Cash Return
3.1%
Cap rate
0.6%
Rent to Value Ratio
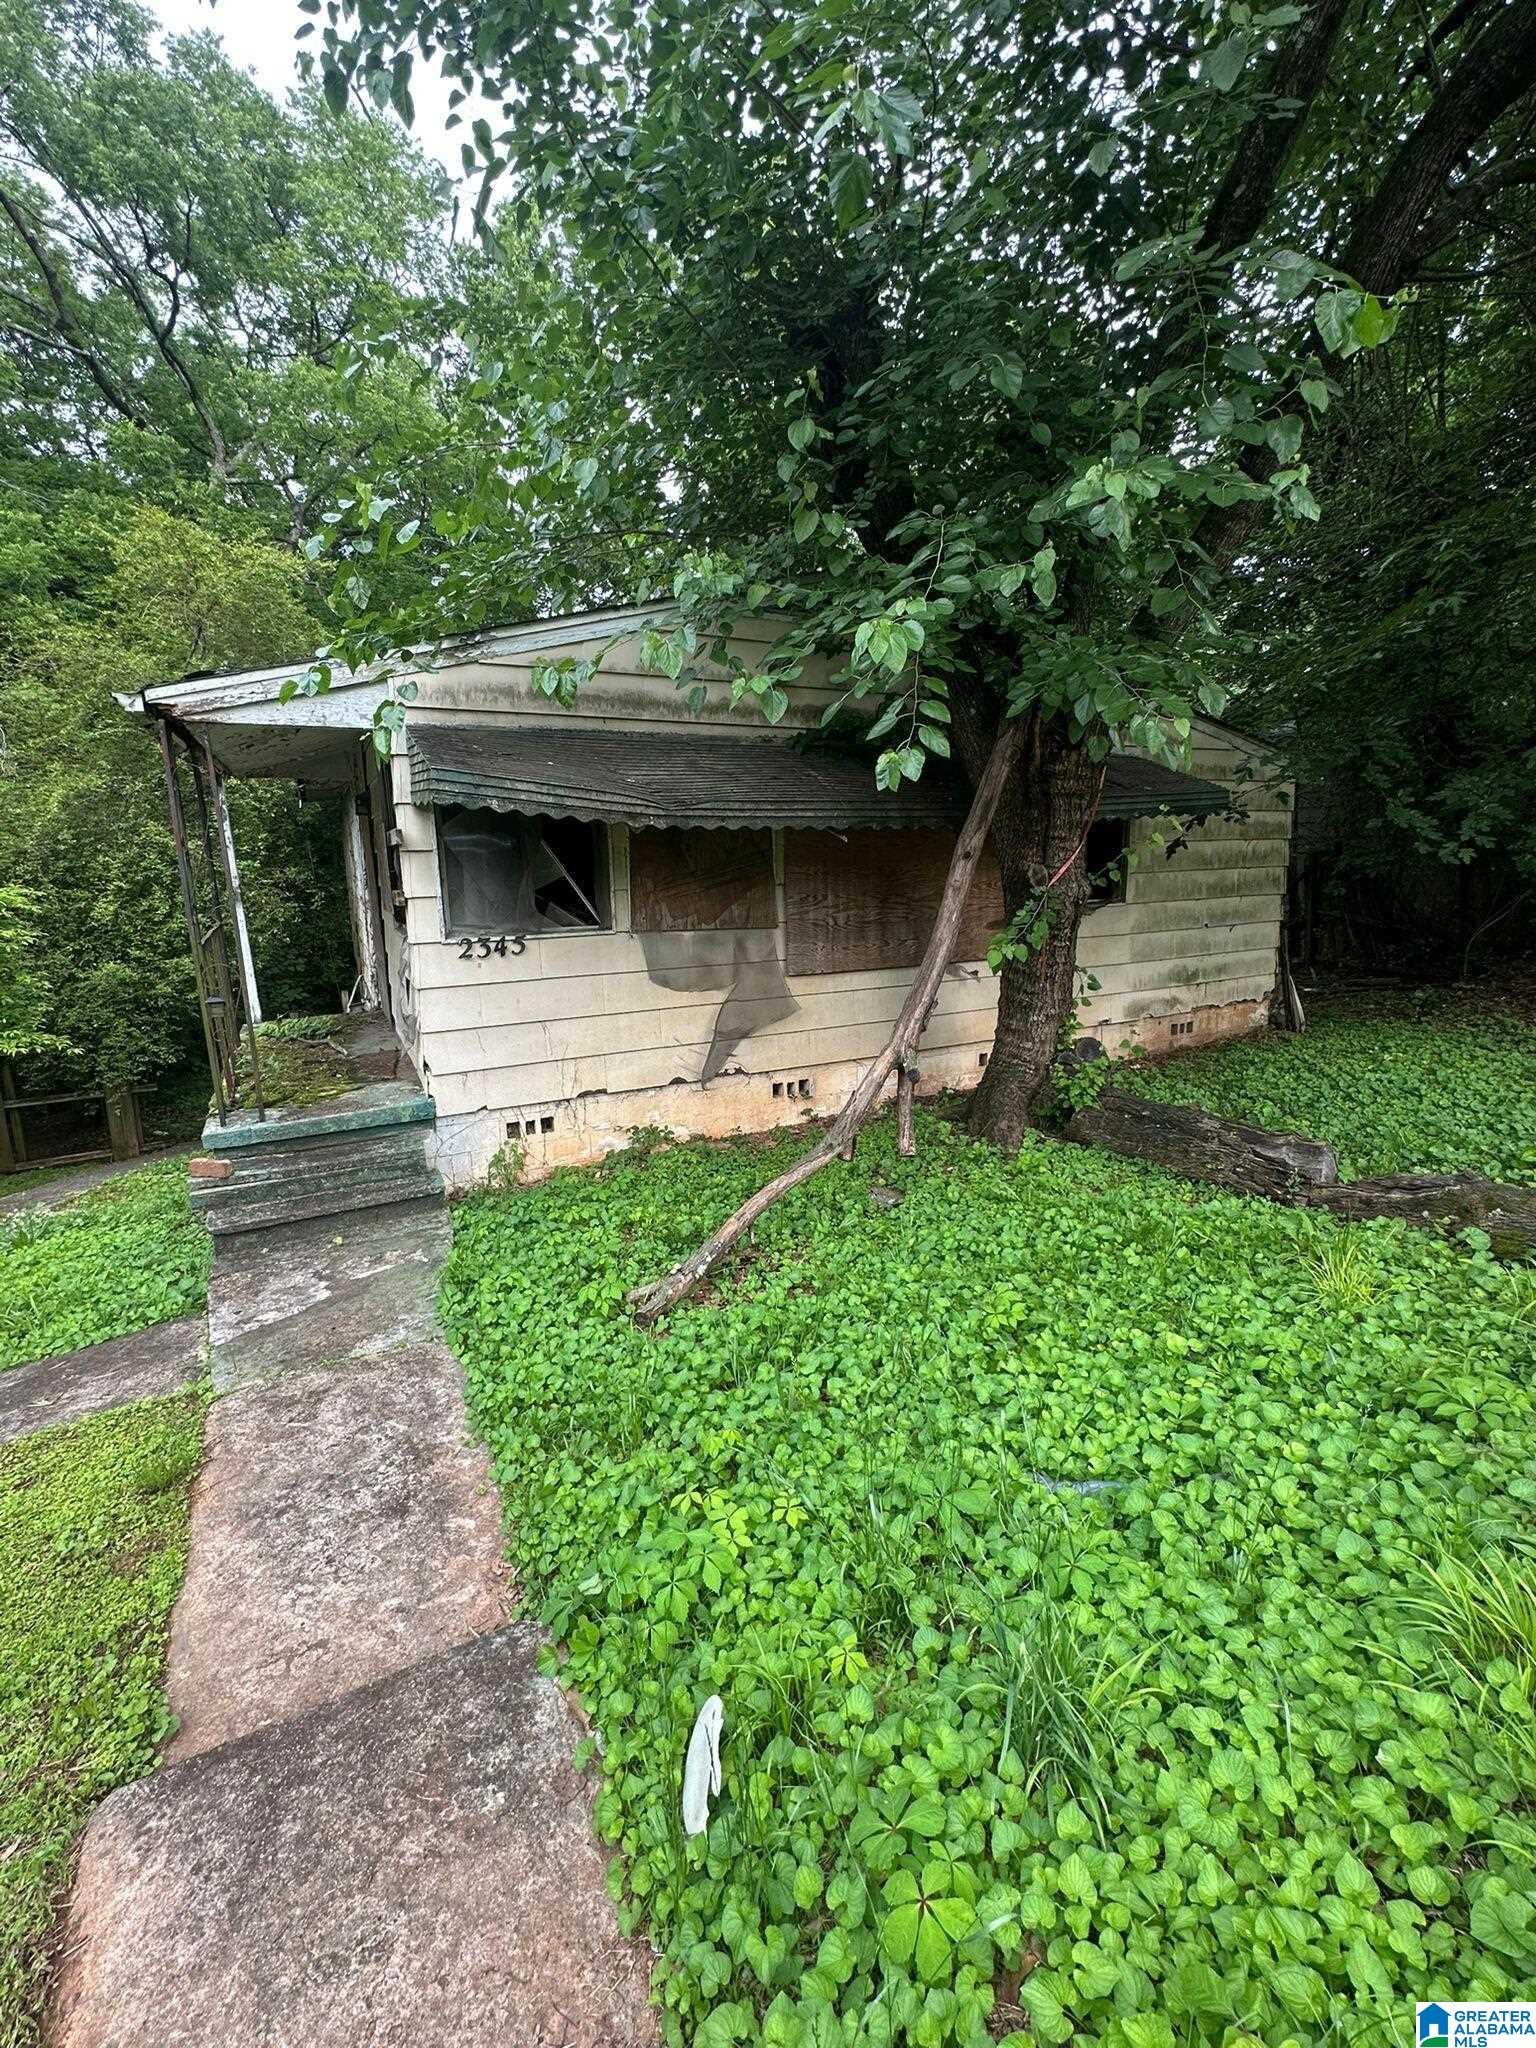
Active
$18,500
3
bds
|
0
ba
|
1,090
sqft
|
built
1958
2345 1st St S, Birmingham, AL 35205
$759
Cash flow
47.8%
Cash-on-Cash Return
49.2%
Cap rate
5.9%
Rent to Value Ratio
Active
$275,000
3
bds
|
0
ba
|
1,946
sqft
|
built
1996
5425 Jr Dr, Birmingham, AL 35235
$64
Cash flow
1.2%
Cash-on-Cash Return
6.0%
Cap rate
0.7%
Rent to Value Ratio
Active under contract
$319,900
3
bds
|
0
ba
|
1,537
sqft
|
built
1976
2256 Rockcreek Trl, Birmingham, AL 35226
$73
Cash flow
1.2%
Cash-on-Cash Return
6.0%
Cap rate
0.7%
Rent to Value Ratio
Active
$125,000
3
bds
|
0
ba
|
1,810
sqft
|
built
1940
4716 Avenue N, Birmingham, AL 35208
$305
Cash flow
12.7%
Cash-on-Cash Return
8.6%
Cap rate
1.0%
Rent to Value Ratio
Active
$309,000
2
bds
|
0
ba
|
1,456
sqft
|
built
1994
1916 Stone Brook Ln, Birmingham, AL 35242
$-247
Cash flow
-4.2%
Cash-on-Cash Return
4.7%
Cap rate
0.6%
Rent to Value Ratio
Active
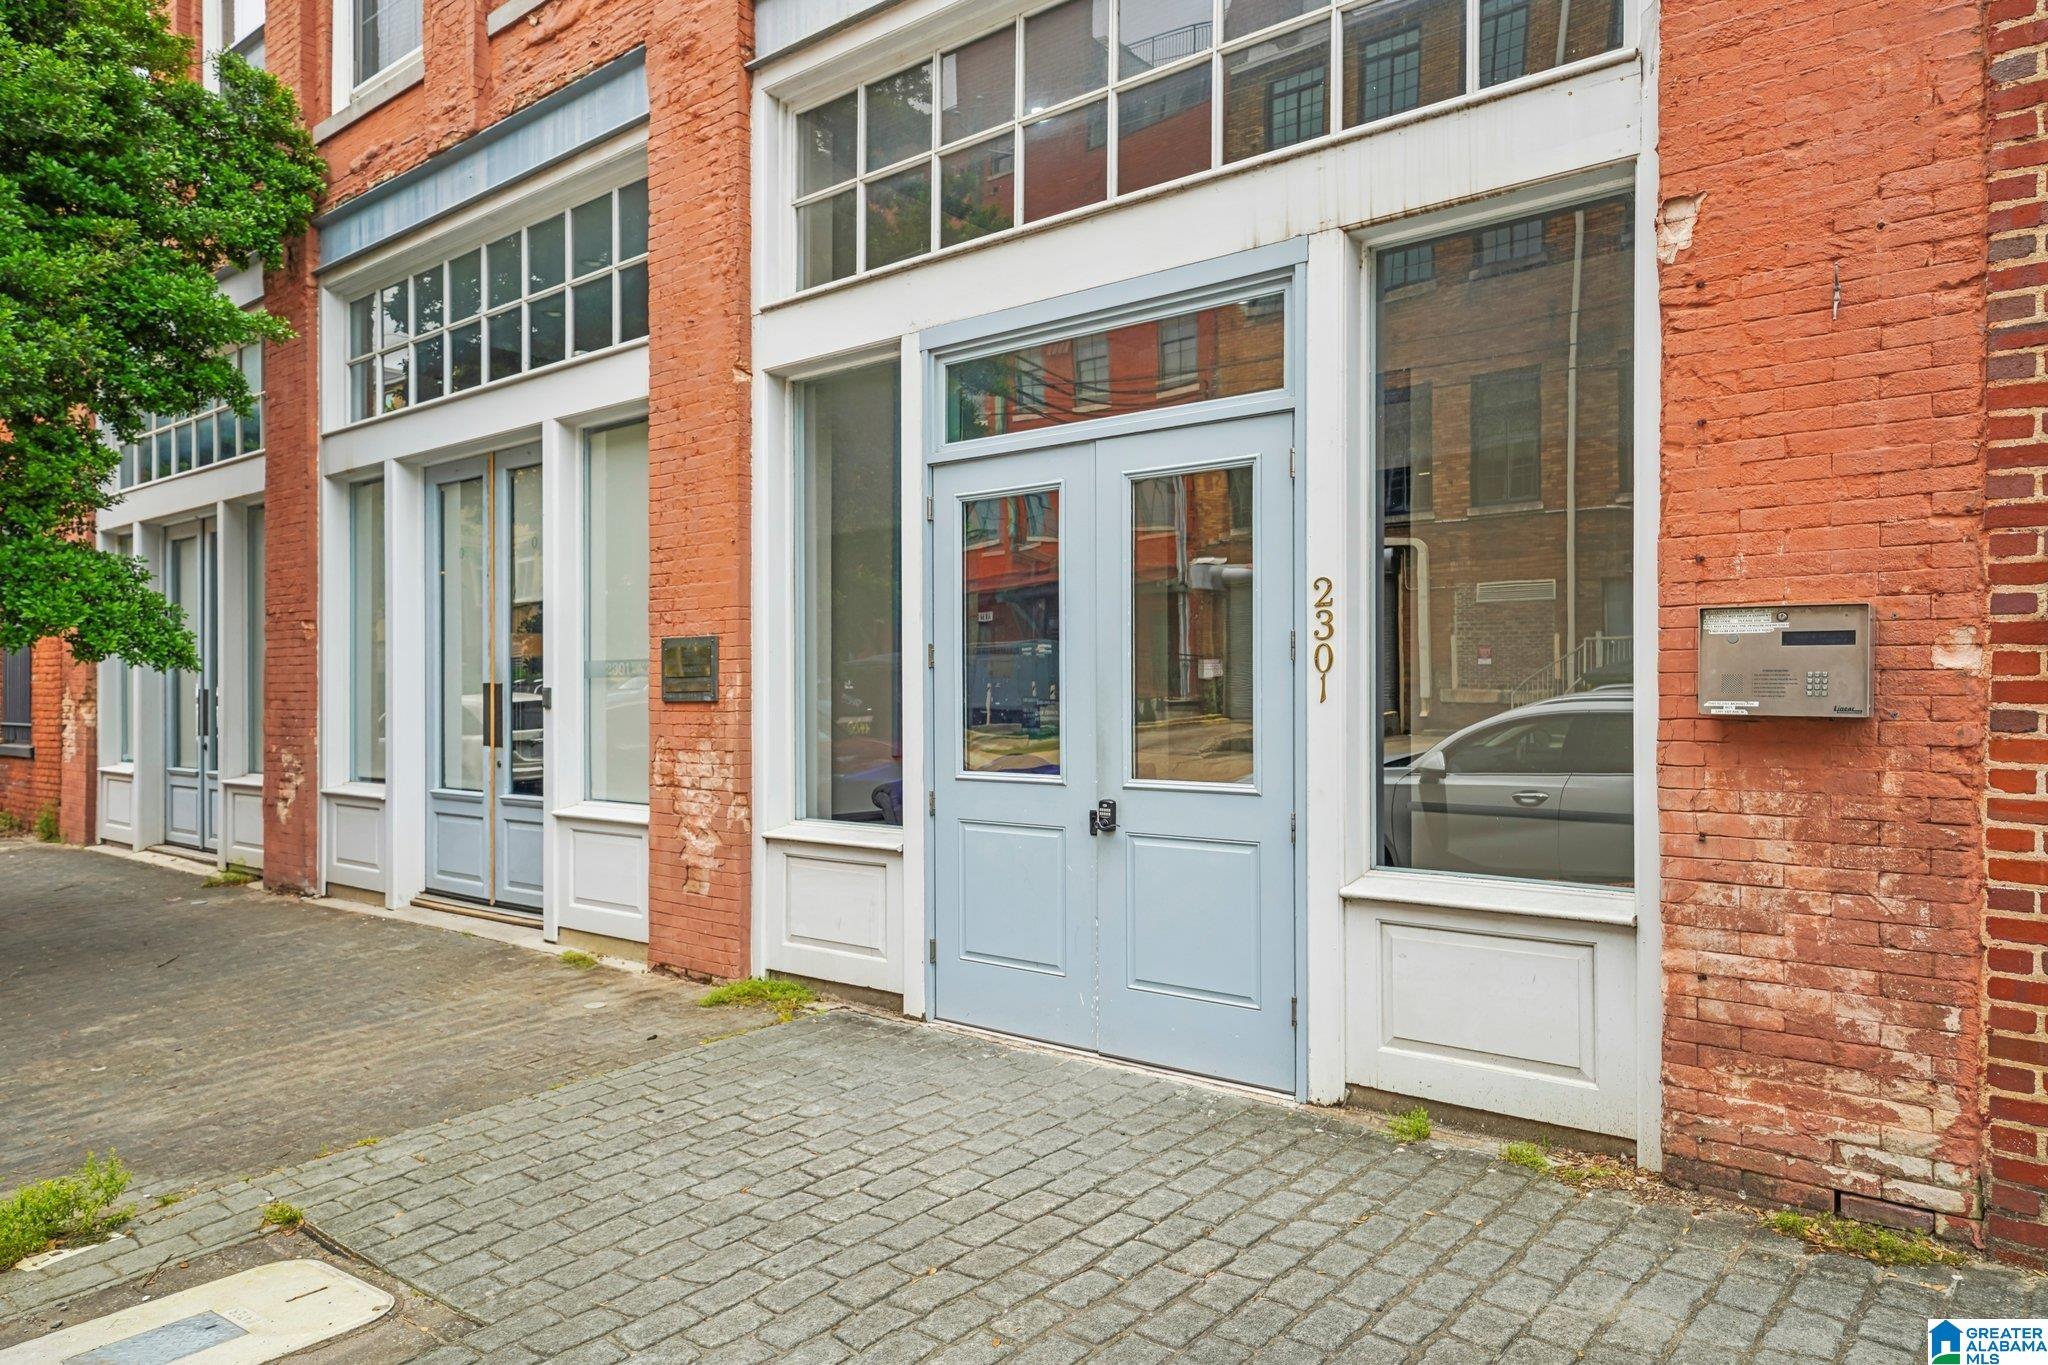
$295,999
1
bds
|
0
ba
|
1,004
sqft
|
built
1924
2301 Morris Ave, Birmingham, AL 35203
$117
Cash flow
2.1%
Cash-on-Cash Return
6.2%
Cap rate
0.7%
Rent to Value Ratio
Active
$719,999
5
bds
|
0
ba
|
3,488
sqft
|
built
1969
511 Kenilworth Dr, Birmingham, AL 35209
$-992
Cash flow
-7.2%
Cash-on-Cash Return
4.0%
Cap rate
0.5%
Rent to Value Ratio
Active
$219,900
2
bds
|
0
ba
|
1,113
sqft
|
built
1920
1101 26th St S, Birmingham, AL 35205
$201
Cash flow
4.8%
Cash-on-Cash Return
6.8%
Cap rate
0.8%
Rent to Value Ratio
Active
$998,000
5
bds
|
0
ba
|
4,306
sqft
|
built
1977
3400 Autumn Haze Ln, Birmingham, AL 35242
$-2,049
Cash flow
-10.7%
Cash-on-Cash Return
3.2%
Cap rate
0.4%
Rent to Value Ratio

Active
$209,500
3
bds
|
0
ba
|
1,552
sqft
|
built
1926
2309 28th Street Ensley, Birmingham, AL 35208
$-232
Cash flow
-5.8%
Cash-on-Cash Return
4.3%
Cap rate
0.5%
Rent to Value Ratio
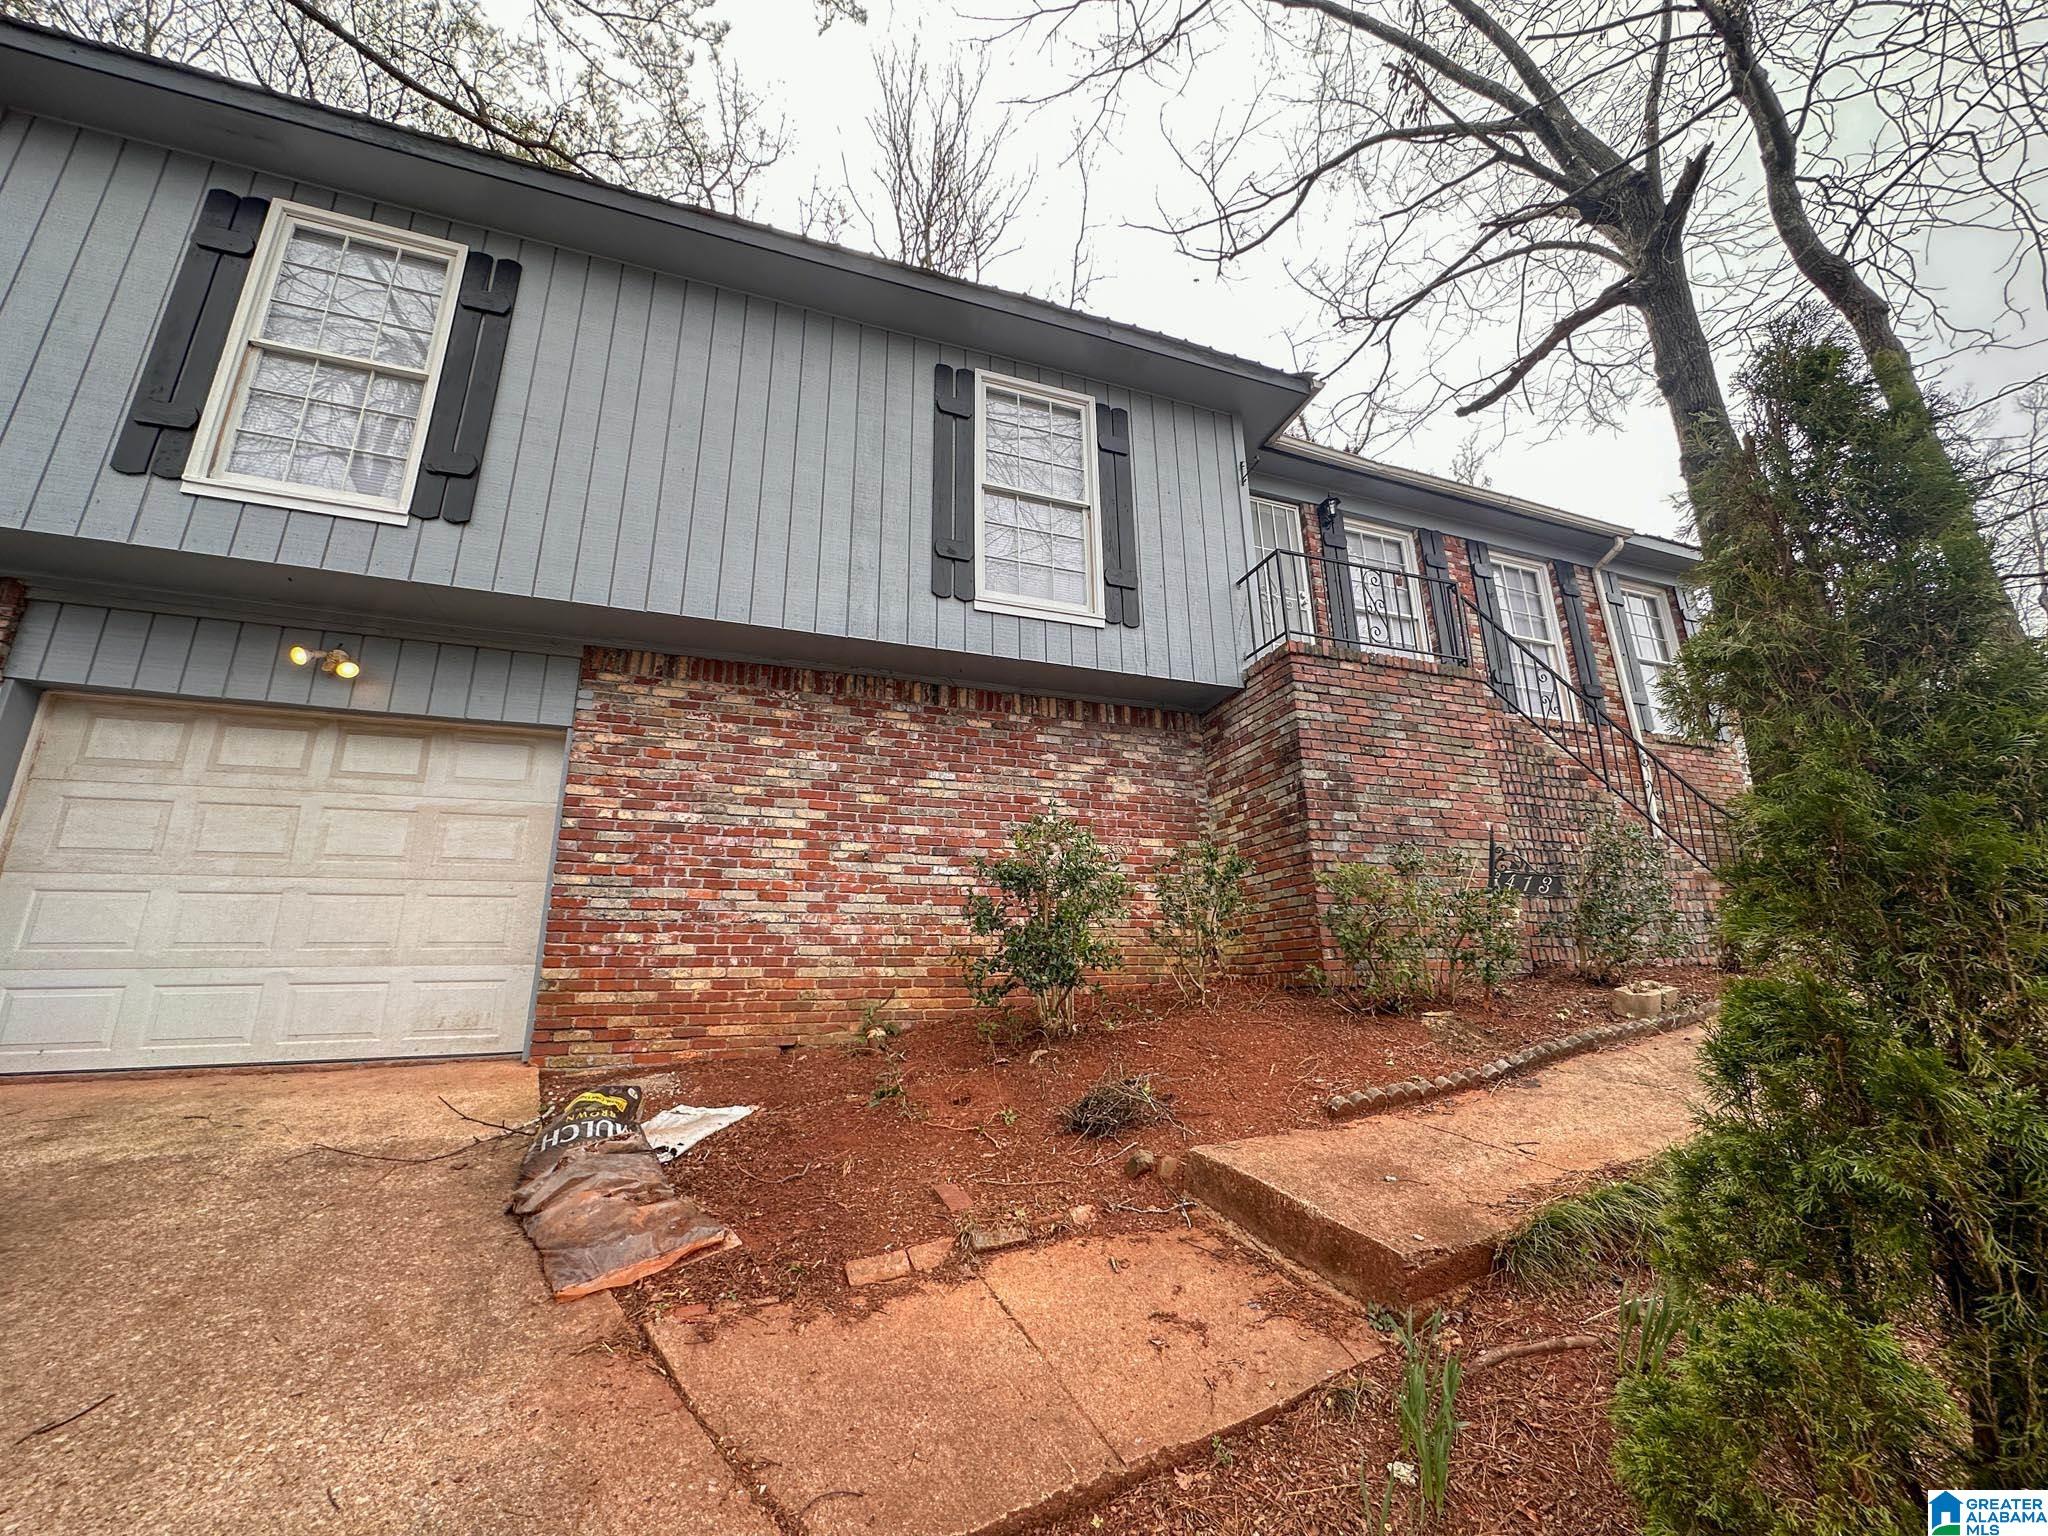
Active under contract
$19,500
2
bds
|
0
ba
|
968
sqft
|
built
1948
4713 Avenue I, Birmingham, AL 35208
$828
Cash flow
49.5%
Cash-on-Cash Return
51.0%
Cap rate
6.2%
Rent to Value Ratio
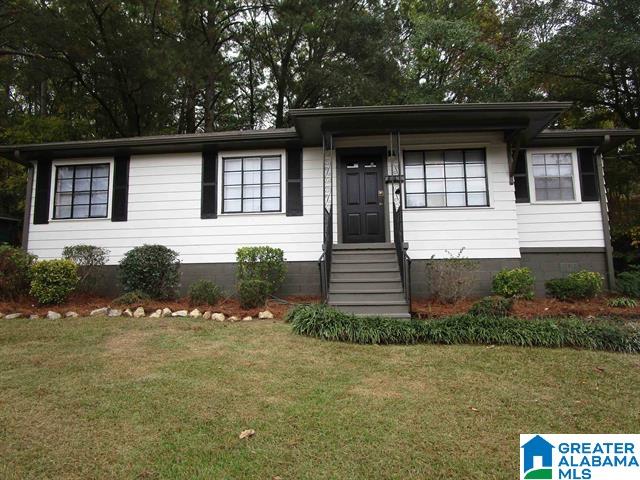
Active
$109,900
3
bds
|
0
ba
|
1,156
sqft
|
built
1935
512 81st St S, Birmingham, AL 35206
$239
Cash flow
11.3%
Cash-on-Cash Return
8.3%
Cap rate
1.0%
Rent to Value Ratio
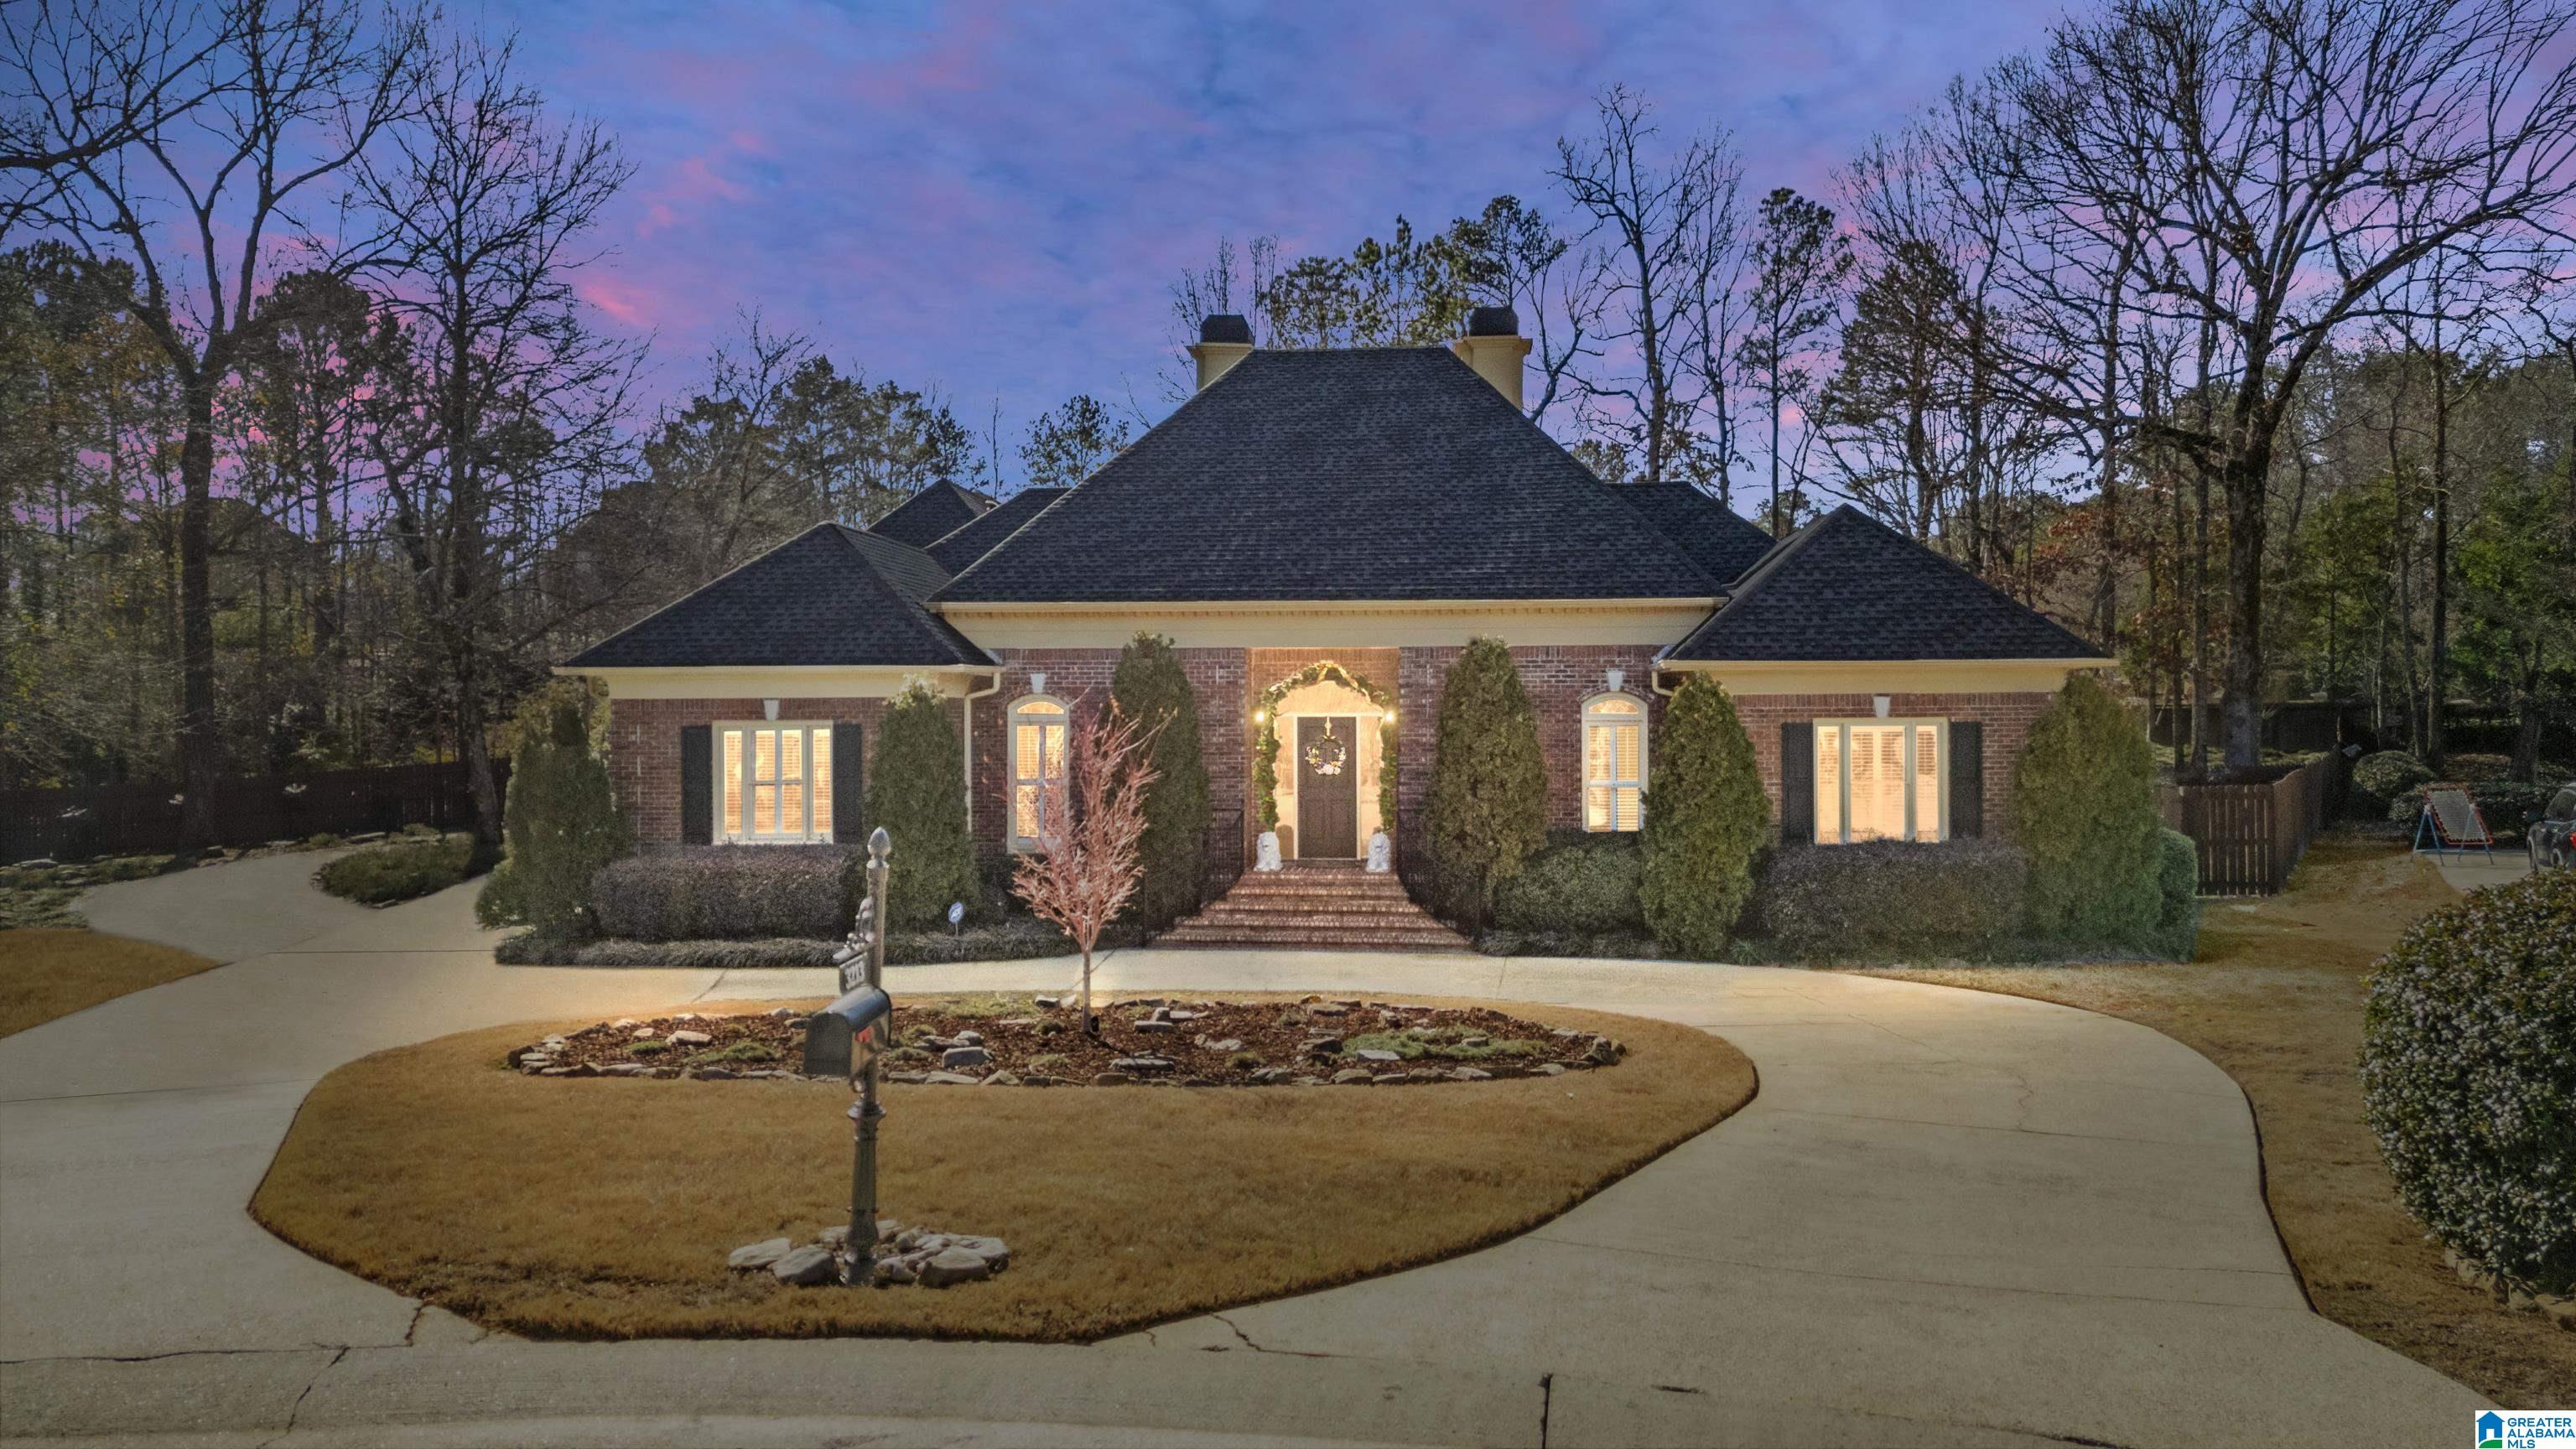
Active under contract
$339,900
3
bds
|
0
ba
|
1,845
sqft
|
built
2006
917 Narrows Point Dr, Birmingham, AL 35242
$-64
Cash flow
-1.0%
Cash-on-Cash Return
5.5%
Cap rate
0.7%
Rent to Value Ratio
Active under contract
$94,900
3
bds
|
0
ba
|
1,968
sqft
|
built
1962
1925 Etowah St, Birmingham, AL 35217
$931
Cash flow
51.2%
Cash-on-Cash Return
17.4%
Cap rate
2.1%
Rent to Value Ratio