Birmingham, AL Investment Properties for Sale
Browse homes for sale and investment properties in Birmingham, AL. Refine your search by price, property type, or more.
Best cash flowing properties in Birmingham, AL

Active
$49,900
4
bds
|
0
ba
|
1,371
sqft
|
built
1935
5105 Georgia Rd, Birmingham, AL 35212
$759
Cash flow
17.7%
Cash-on-Cash Return
18.3%
Cap rate
2.2%
Rent to Value Ratio
Active
$73,500
2
bds
|
0
ba
|
713
sqft
|
built
1948
3218 Central Ave, Birmingham, AL 35224
$621
Cash flow
9.8%
Cash-on-Cash Return
10.1%
Cap rate
1.2%
Rent to Value Ratio
915 out of 1,030 properties for sale in Birmingham, AL
Limited Results Shown
Create a free account, or log in to reveal all property listings and enjoy the complete experience.
Active
$1,200,000
5
bds
|
0
ba
|
5,825
sqft
|
built
1988
4670 Old Looney Mill Rd, Birmingham, AL 35243
$-3,195
Cash flow
-13.9%
Cash-on-Cash Return
2.5%
Cap rate
0.3%
Rent to Value Ratio
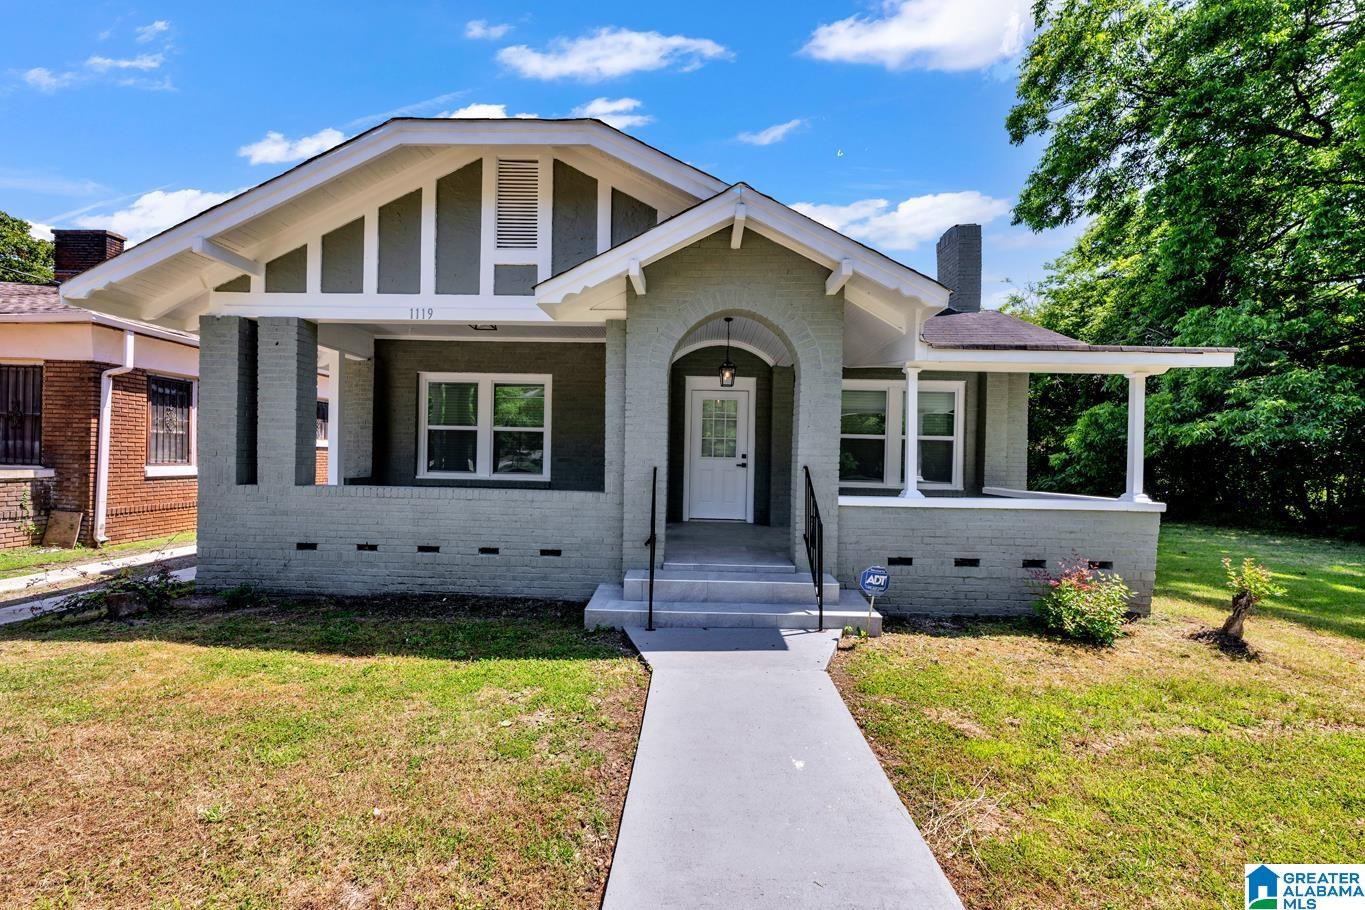
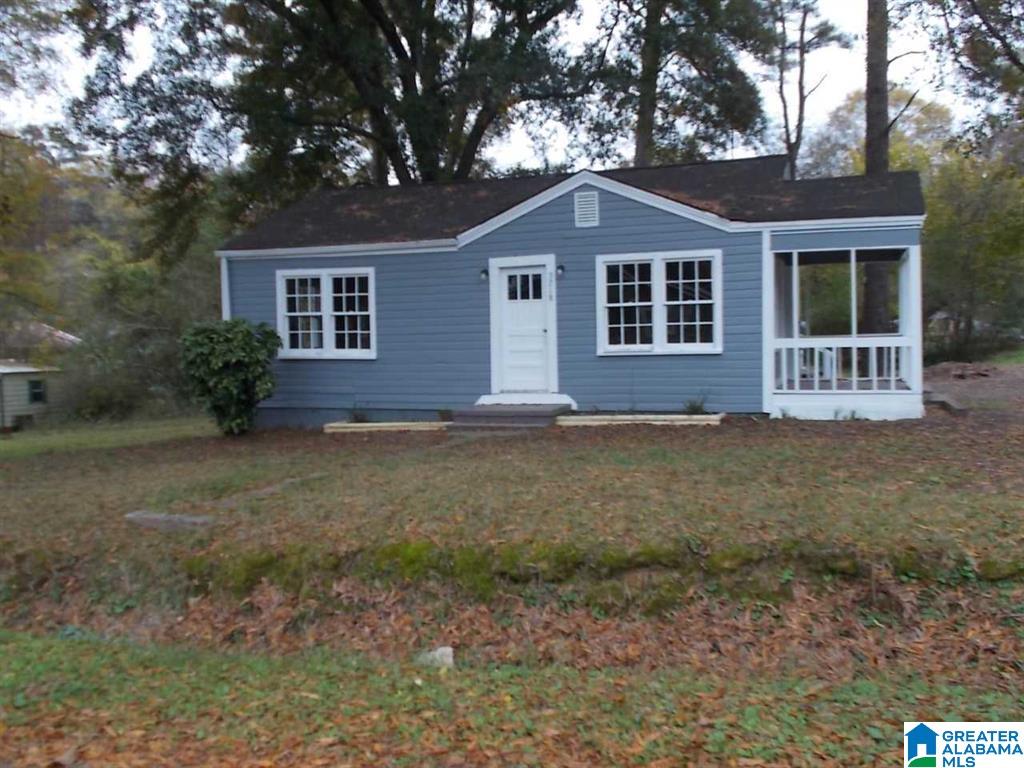
Active
$230,000
3
bds
|
0
ba
|
1,593
sqft
|
built
1930
1119 8th Ave W, Birmingham, AL 35204
$154
Cash flow
3.5%
Cash-on-Cash Return
6.5%
Cap rate
0.8%
Rent to Value Ratio
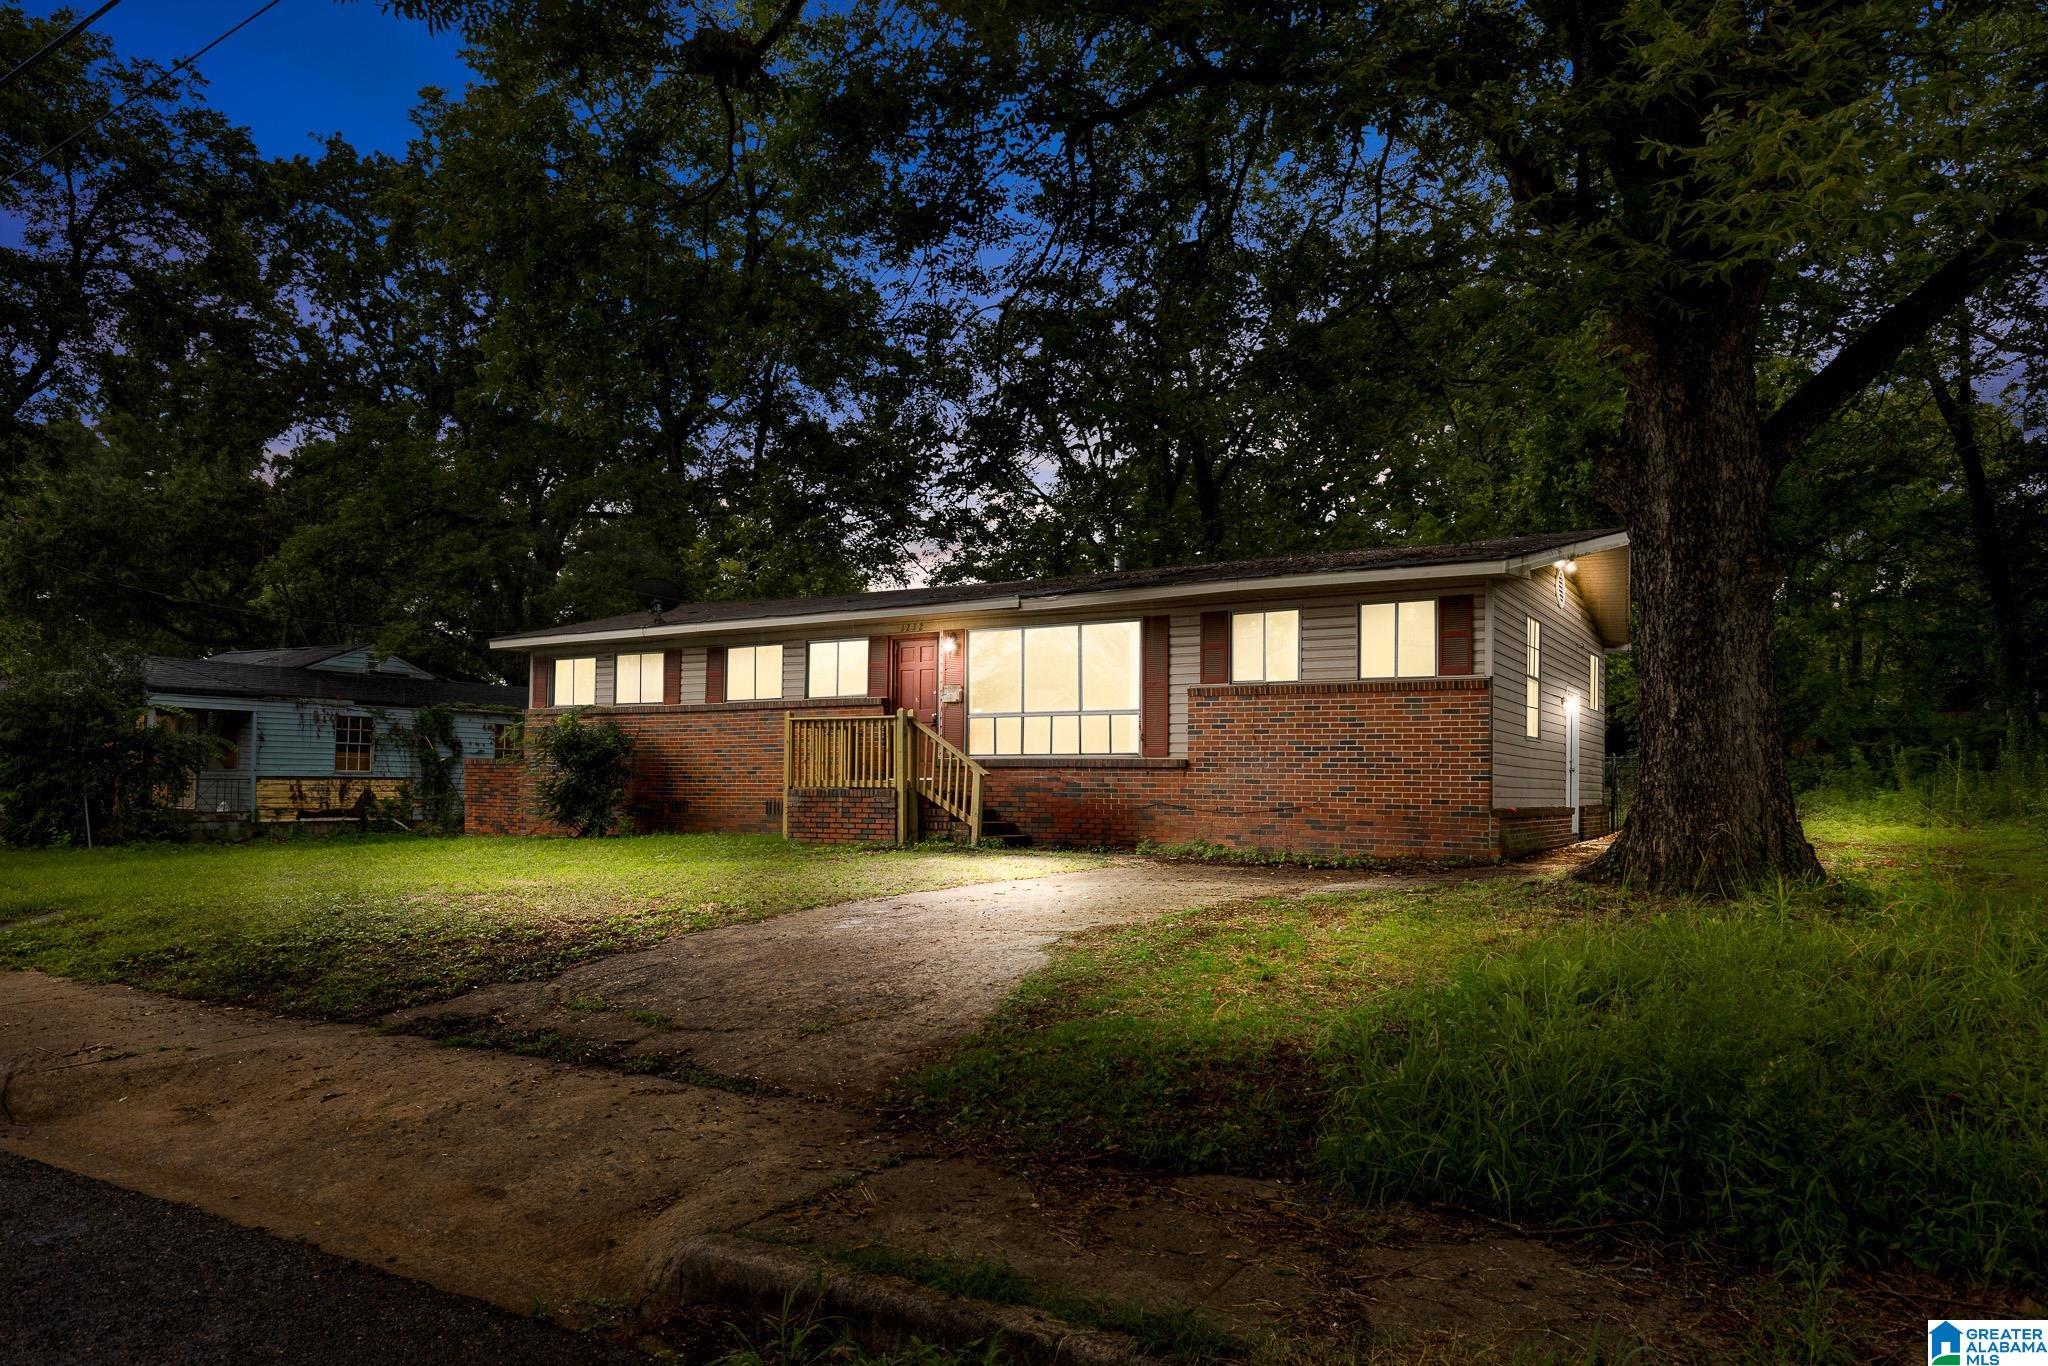
Active
$117,000
3
bds
|
0
ba
|
1,332
sqft
|
built
1961
1232 Frisco St, Birmingham, AL 35224
$274
Cash flow
12.2%
Cash-on-Cash Return
8.5%
Cap rate
1.0%
Rent to Value Ratio
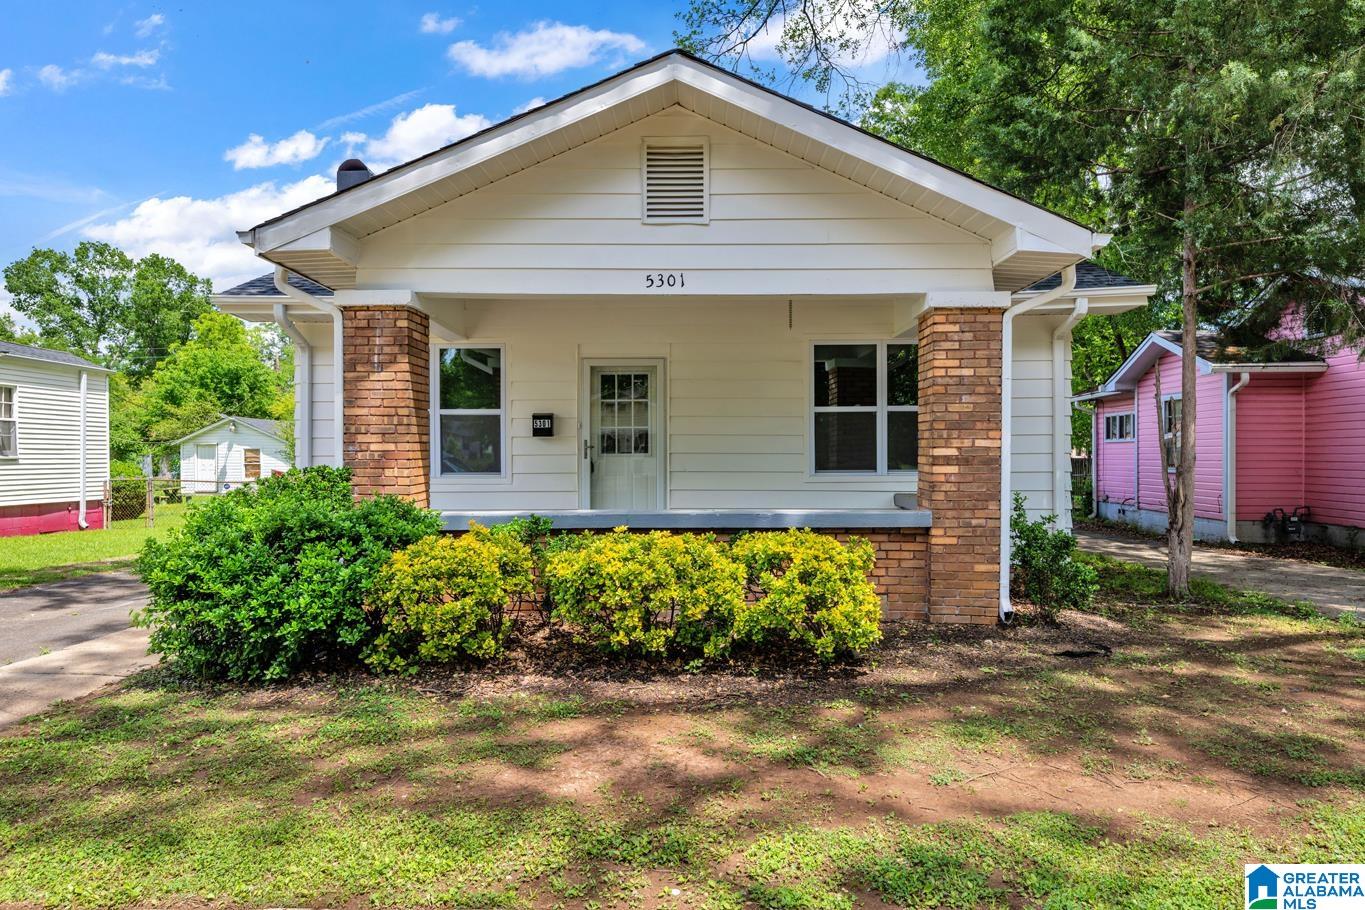
Active
$132,500
2
bds
|
0
ba
|
1,120
sqft
|
built
1930
5301 Terrace Q, Birmingham, AL 35208
$270
Cash flow
10.6%
Cash-on-Cash Return
8.1%
Cap rate
1.0%
Rent to Value Ratio
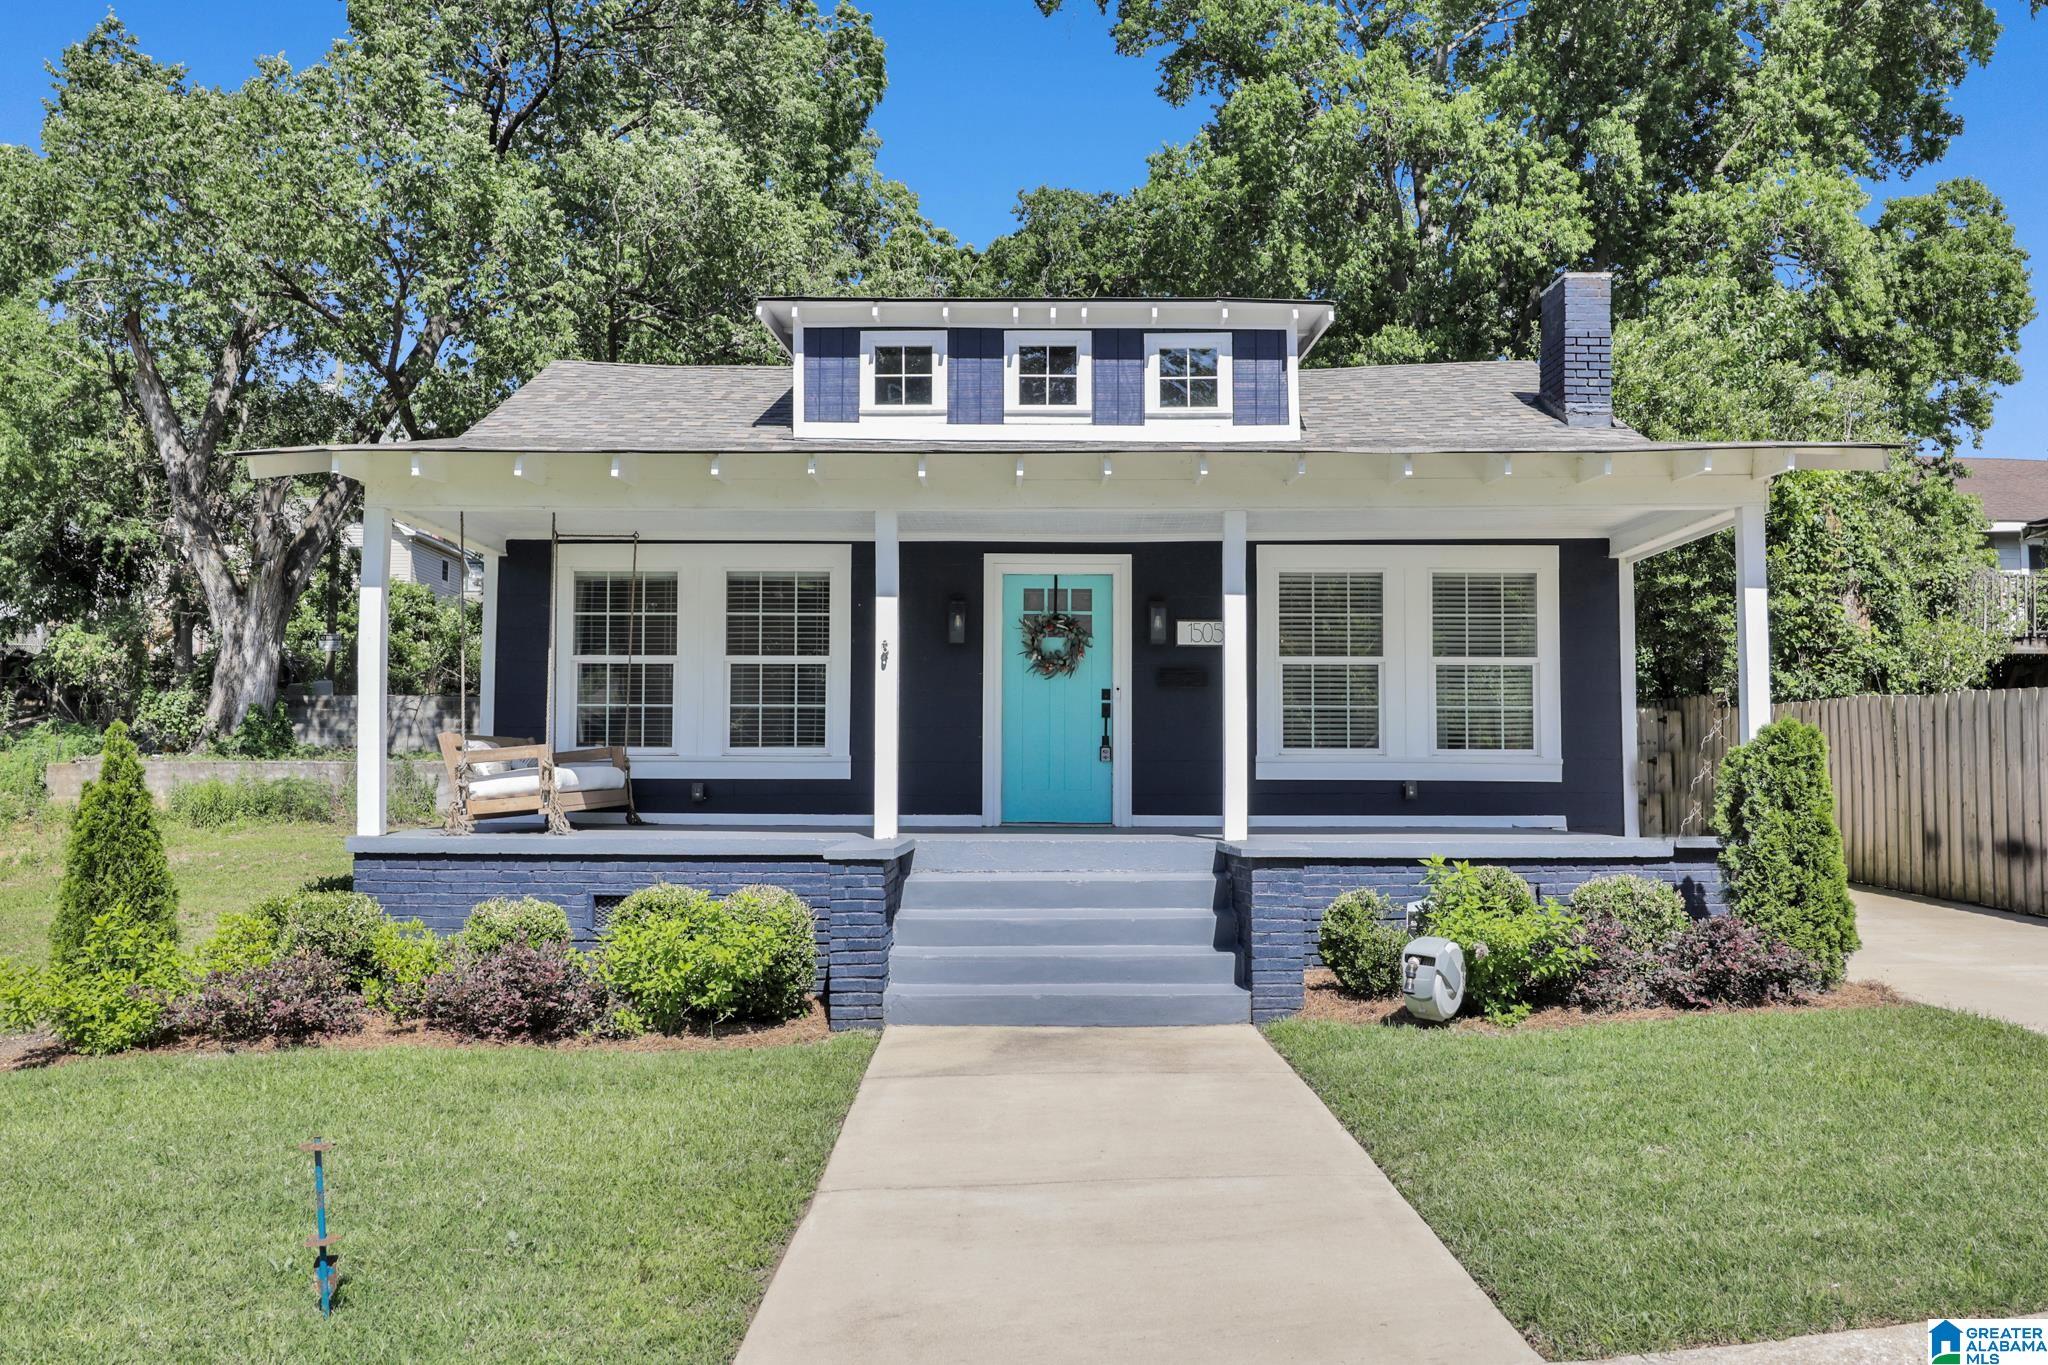
Active under contract
$324,000
3
bds
|
0
ba
|
1,327
sqft
|
built
1935
1505 36th St N, Birmingham, AL 35234
$-705
Cash flow
-11.4%
Cash-on-Cash Return
3.1%
Cap rate
0.4%
Rent to Value Ratio
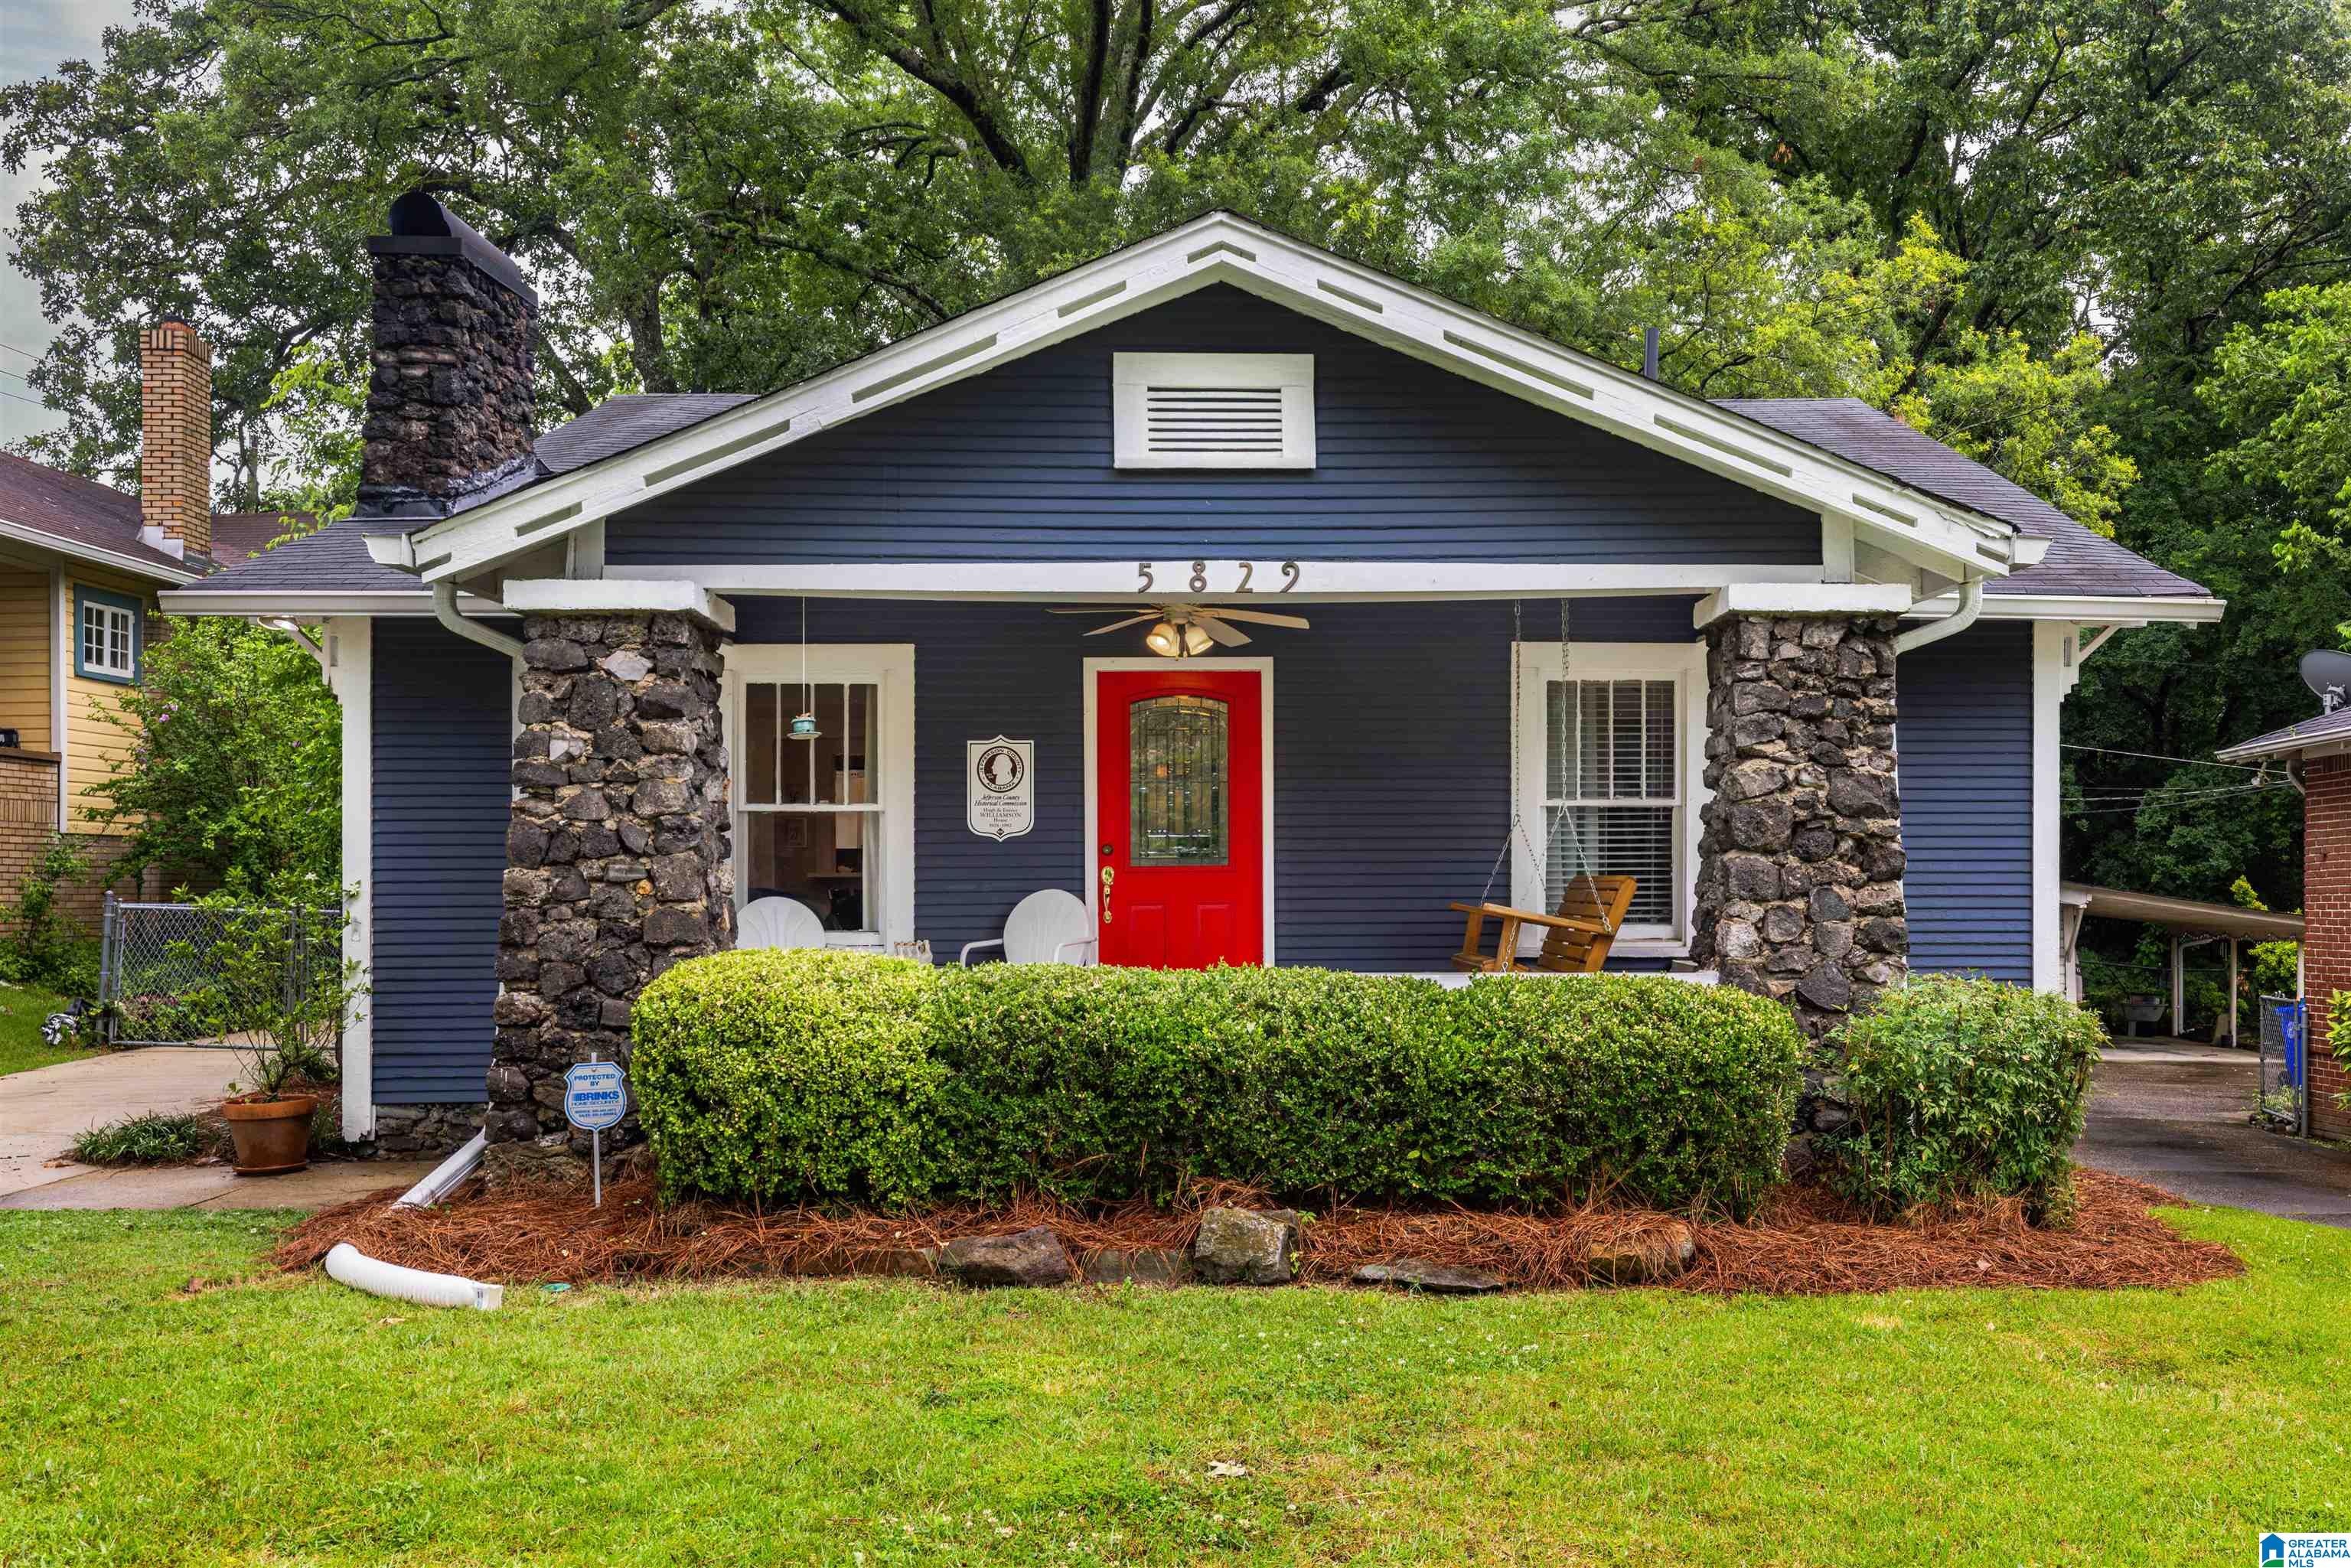
Active
$339,900
3
bds
|
0
ba
|
1,333
sqft
|
built
1924
5829 6th Ave S, Birmingham, AL 35212
$-22
Cash flow
-0.3%
Cash-on-Cash Return
5.6%
Cap rate
0.7%
Rent to Value Ratio
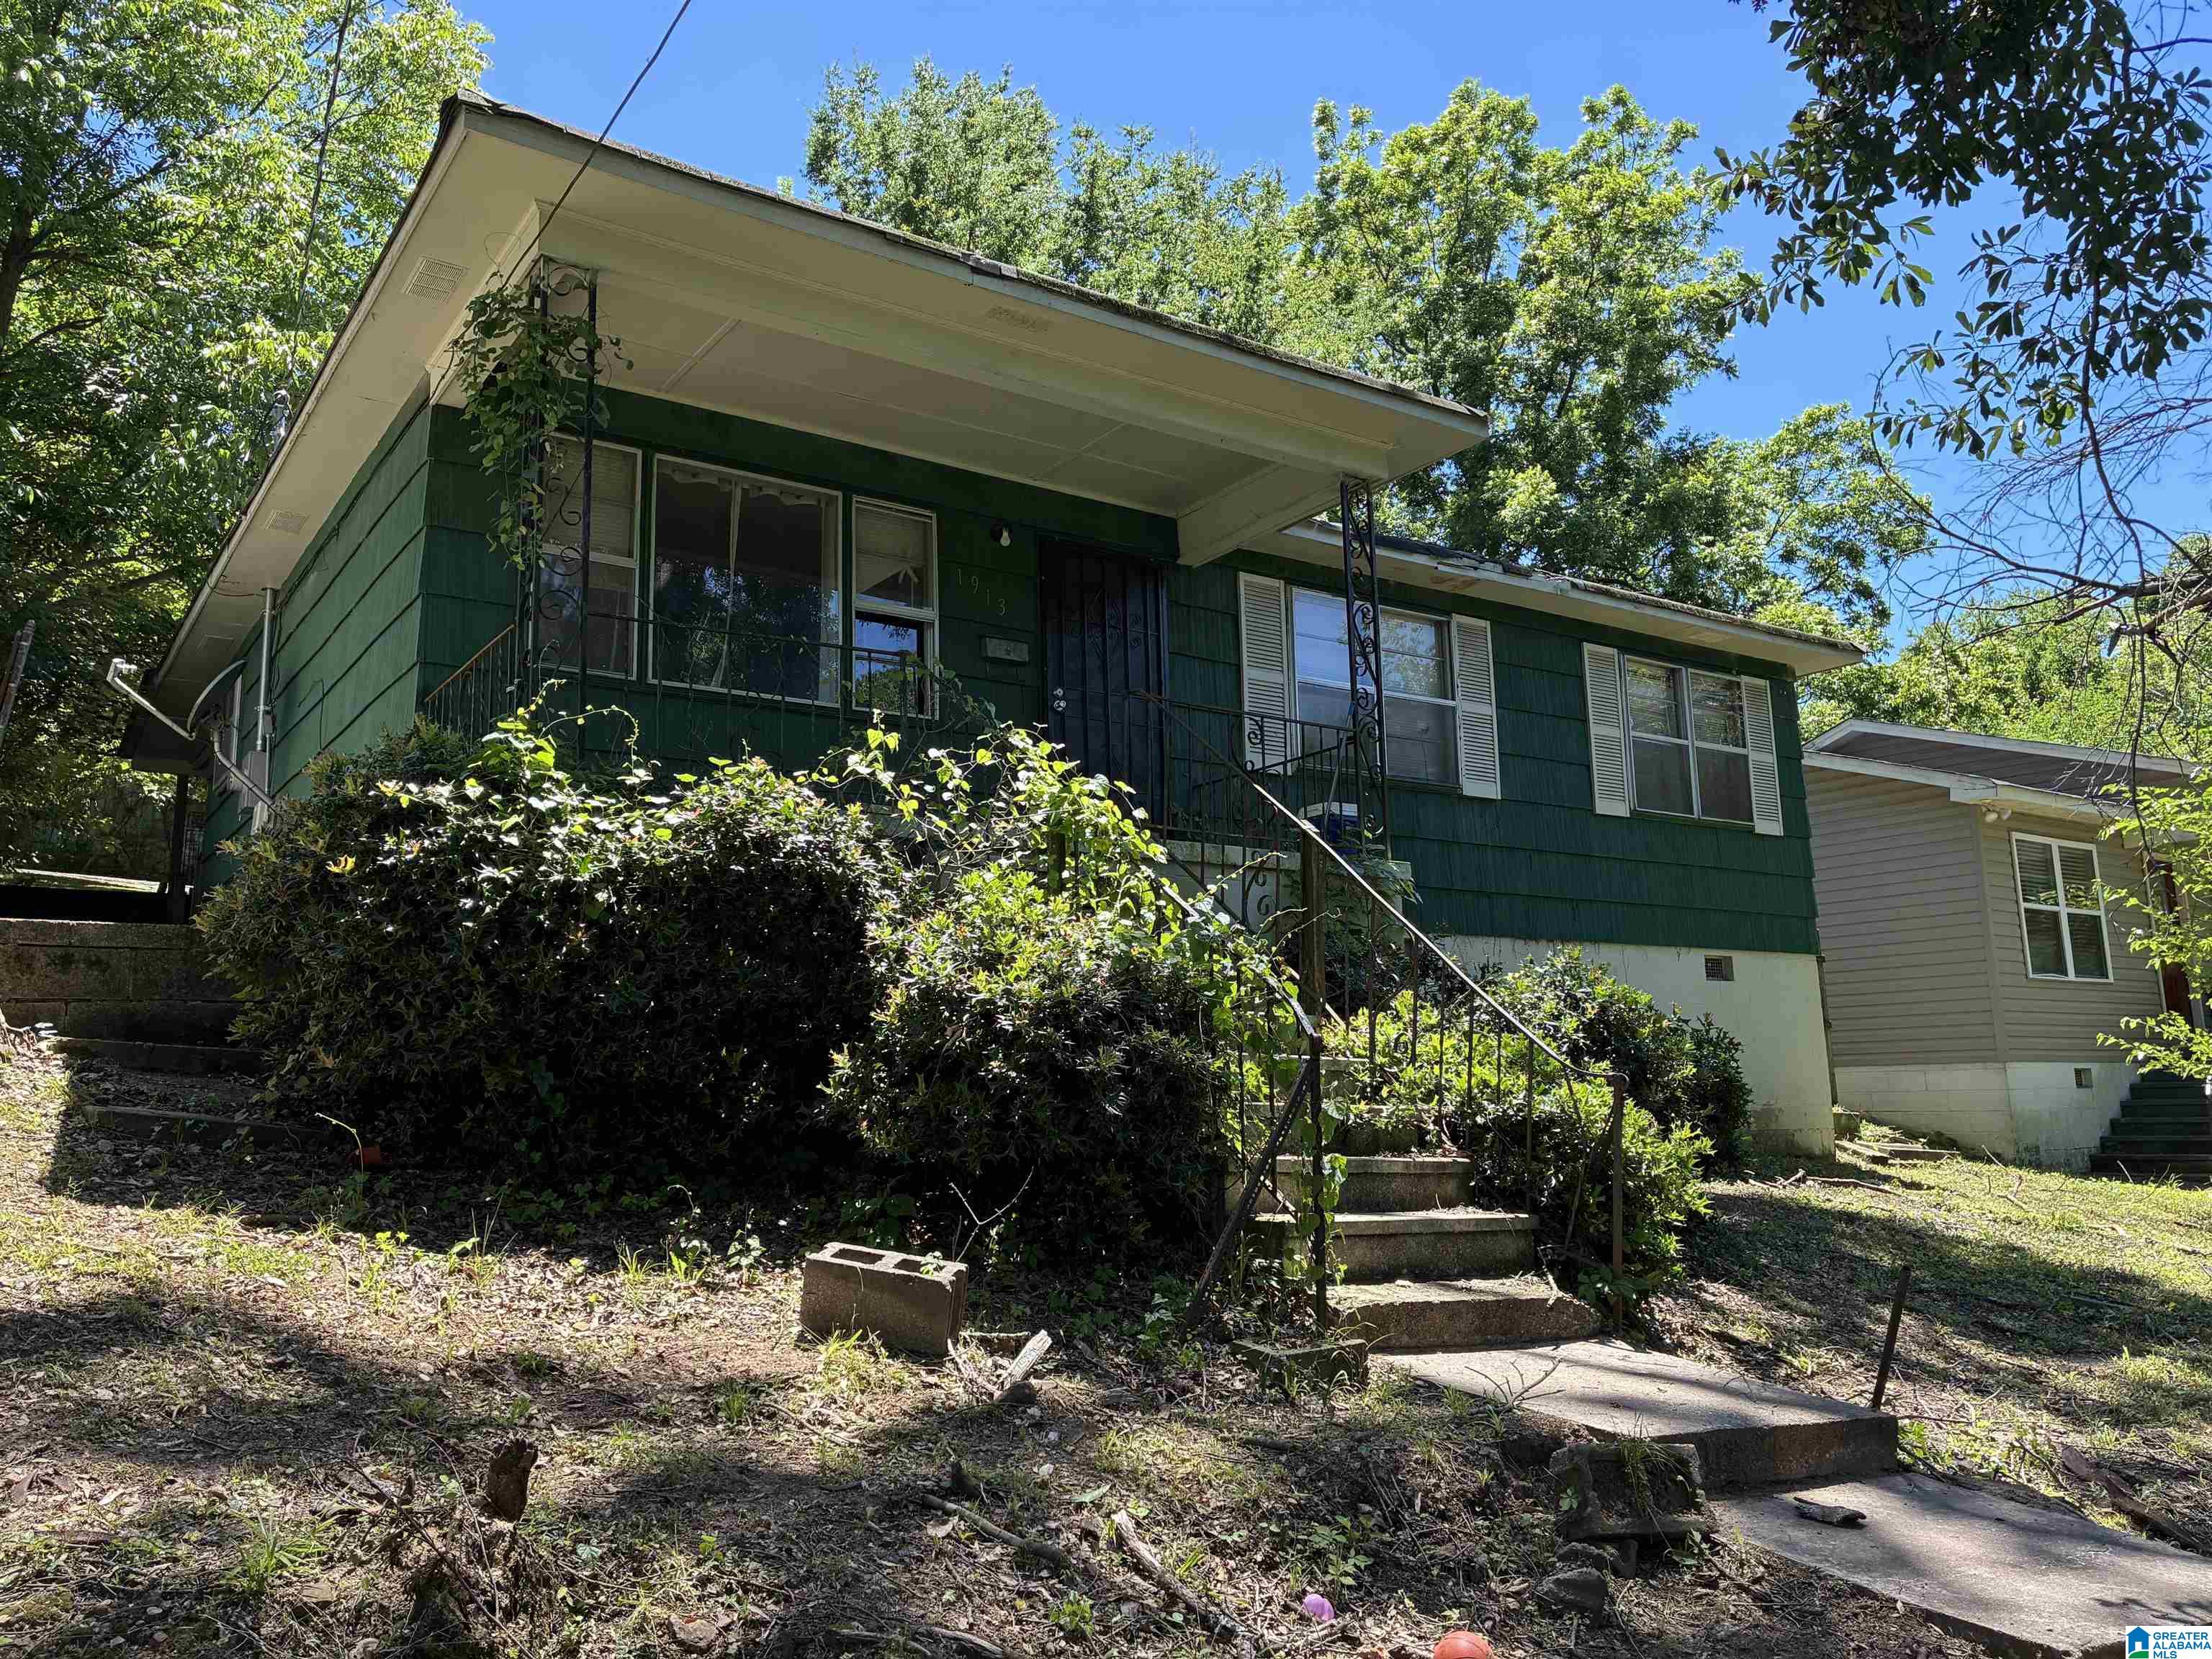
Active
$80,000
3
bds
|
0
ba
|
975
sqft
|
built
1963
1913 Day Ave, Birmingham, AL 35217
$242
Cash flow
15.8%
Cash-on-Cash Return
9.3%
Cap rate
1.1%
Rent to Value Ratio
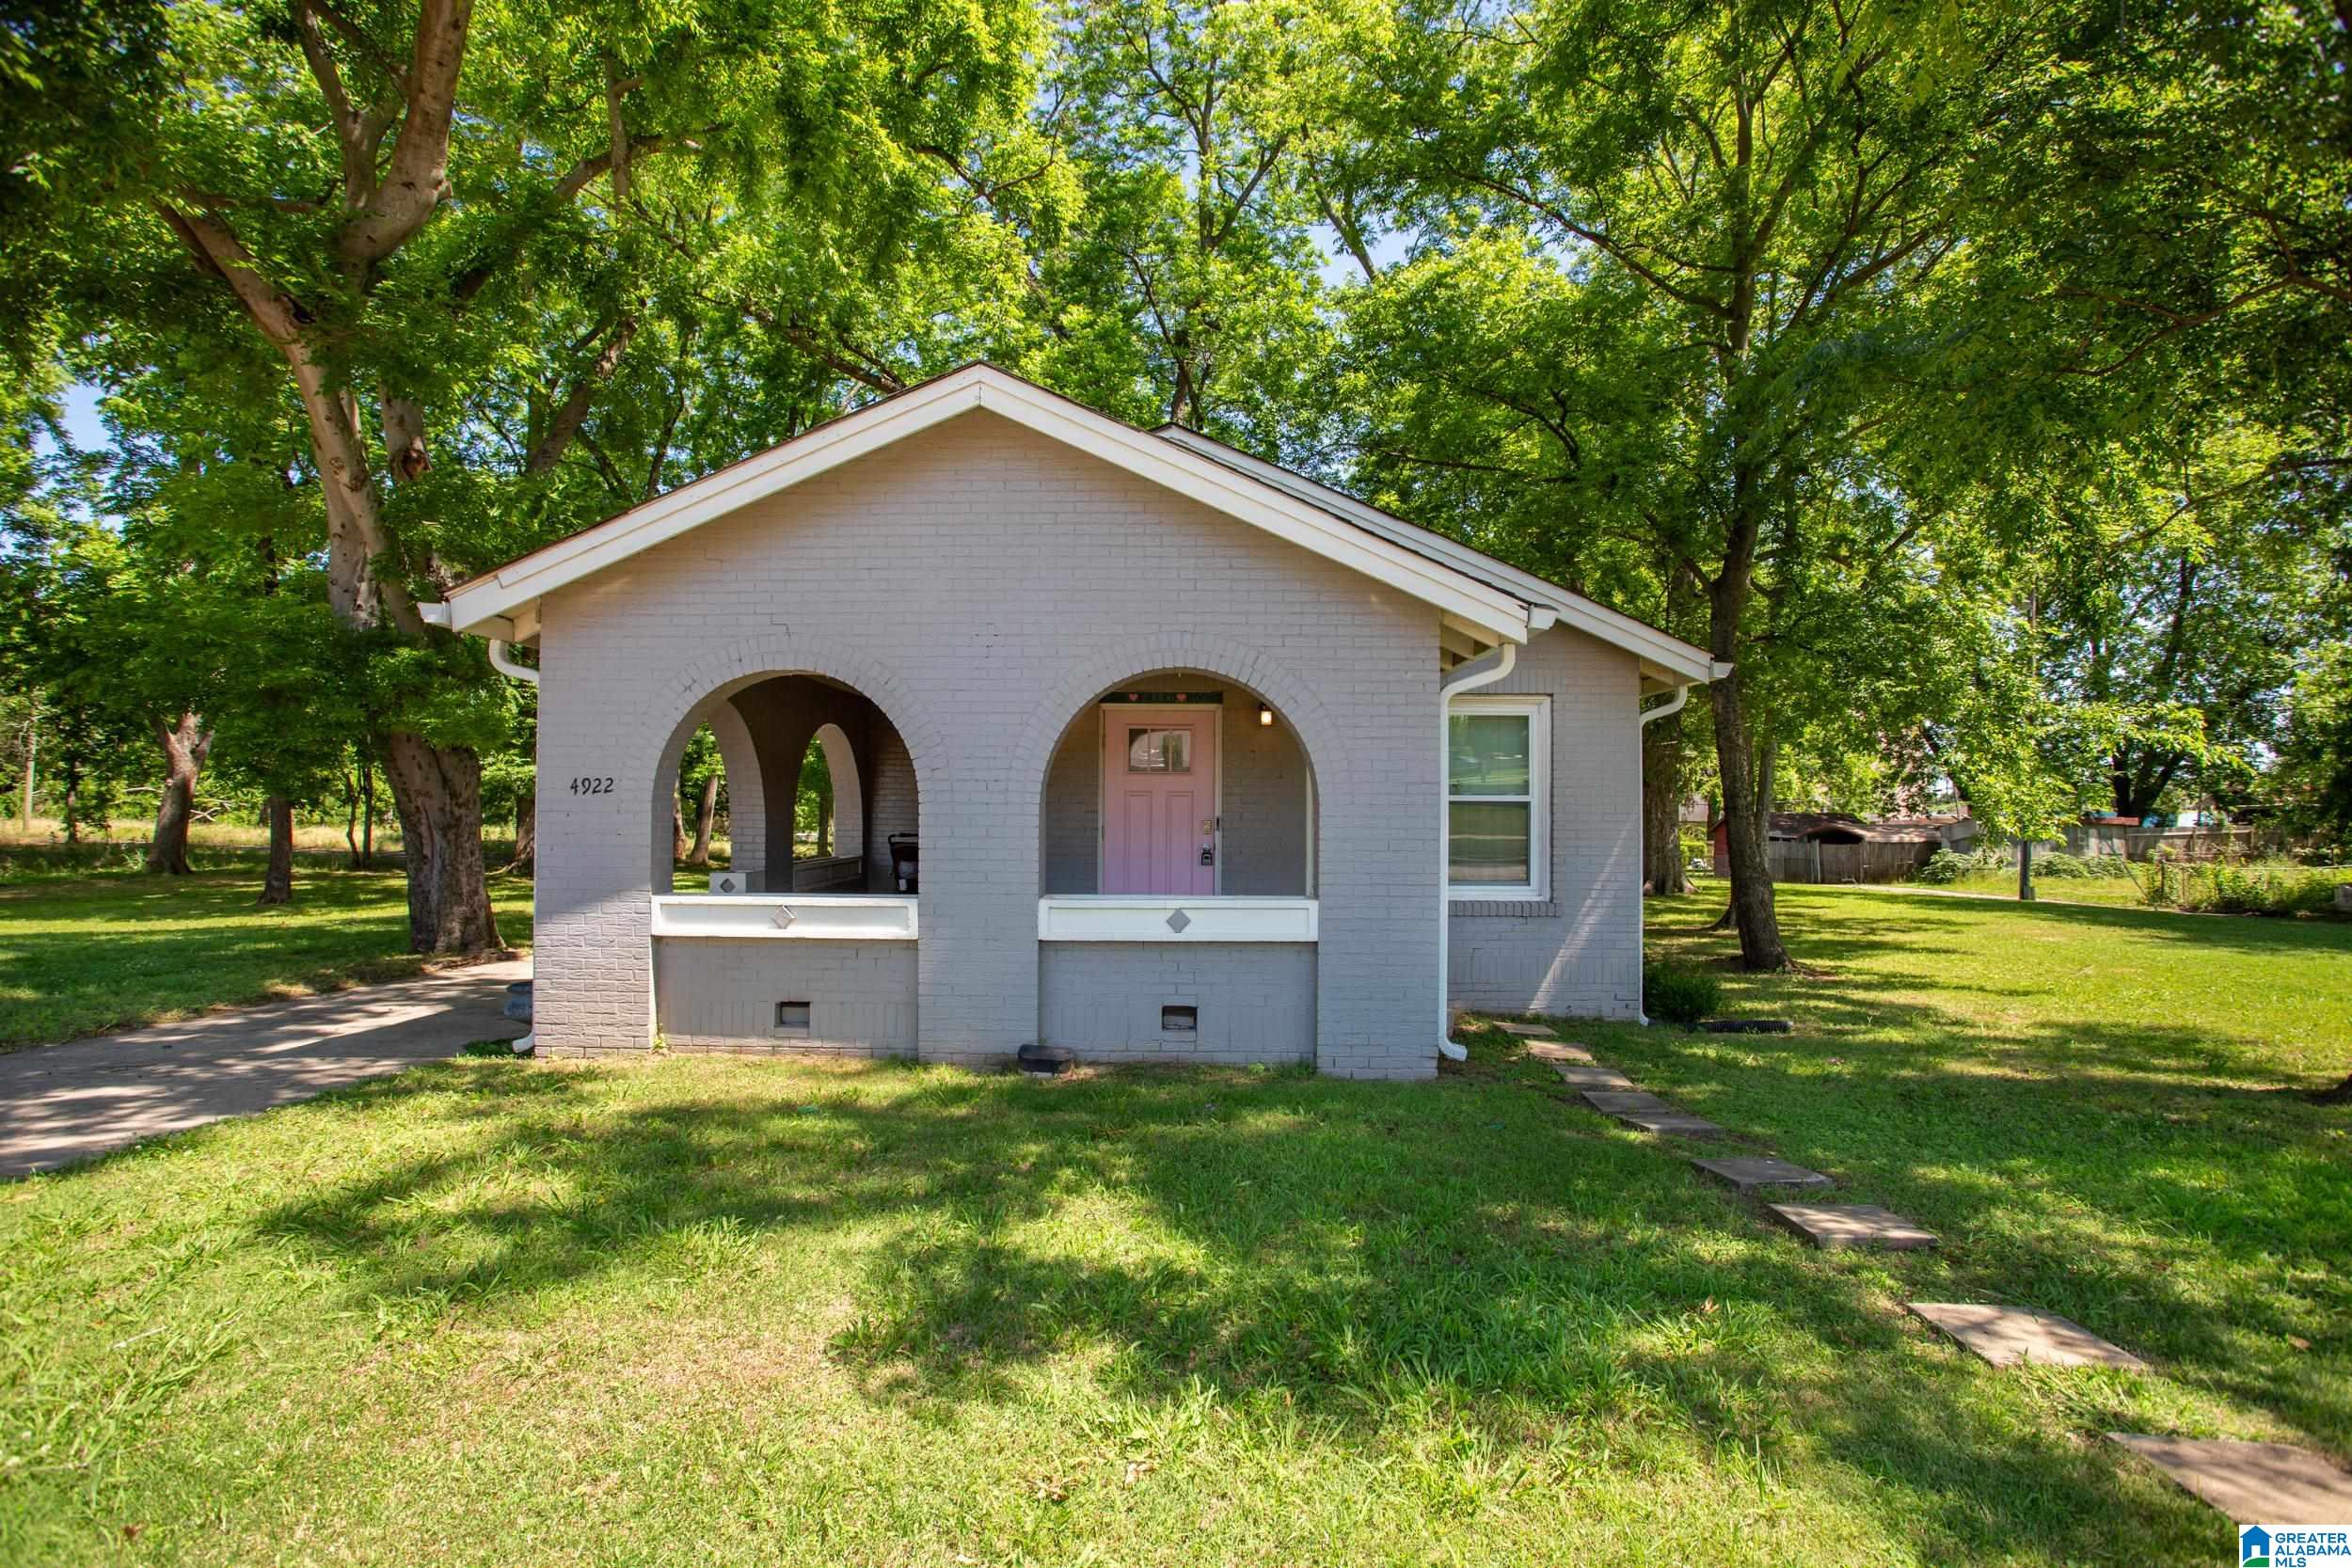
Active
$199,999
2
bds
|
0
ba
|
1,291
sqft
|
built
1935
4922 9th Ct N, Birmingham, AL 35212
$-49
Cash flow
-1.3%
Cash-on-Cash Return
5.4%
Cap rate
0.7%
Rent to Value Ratio
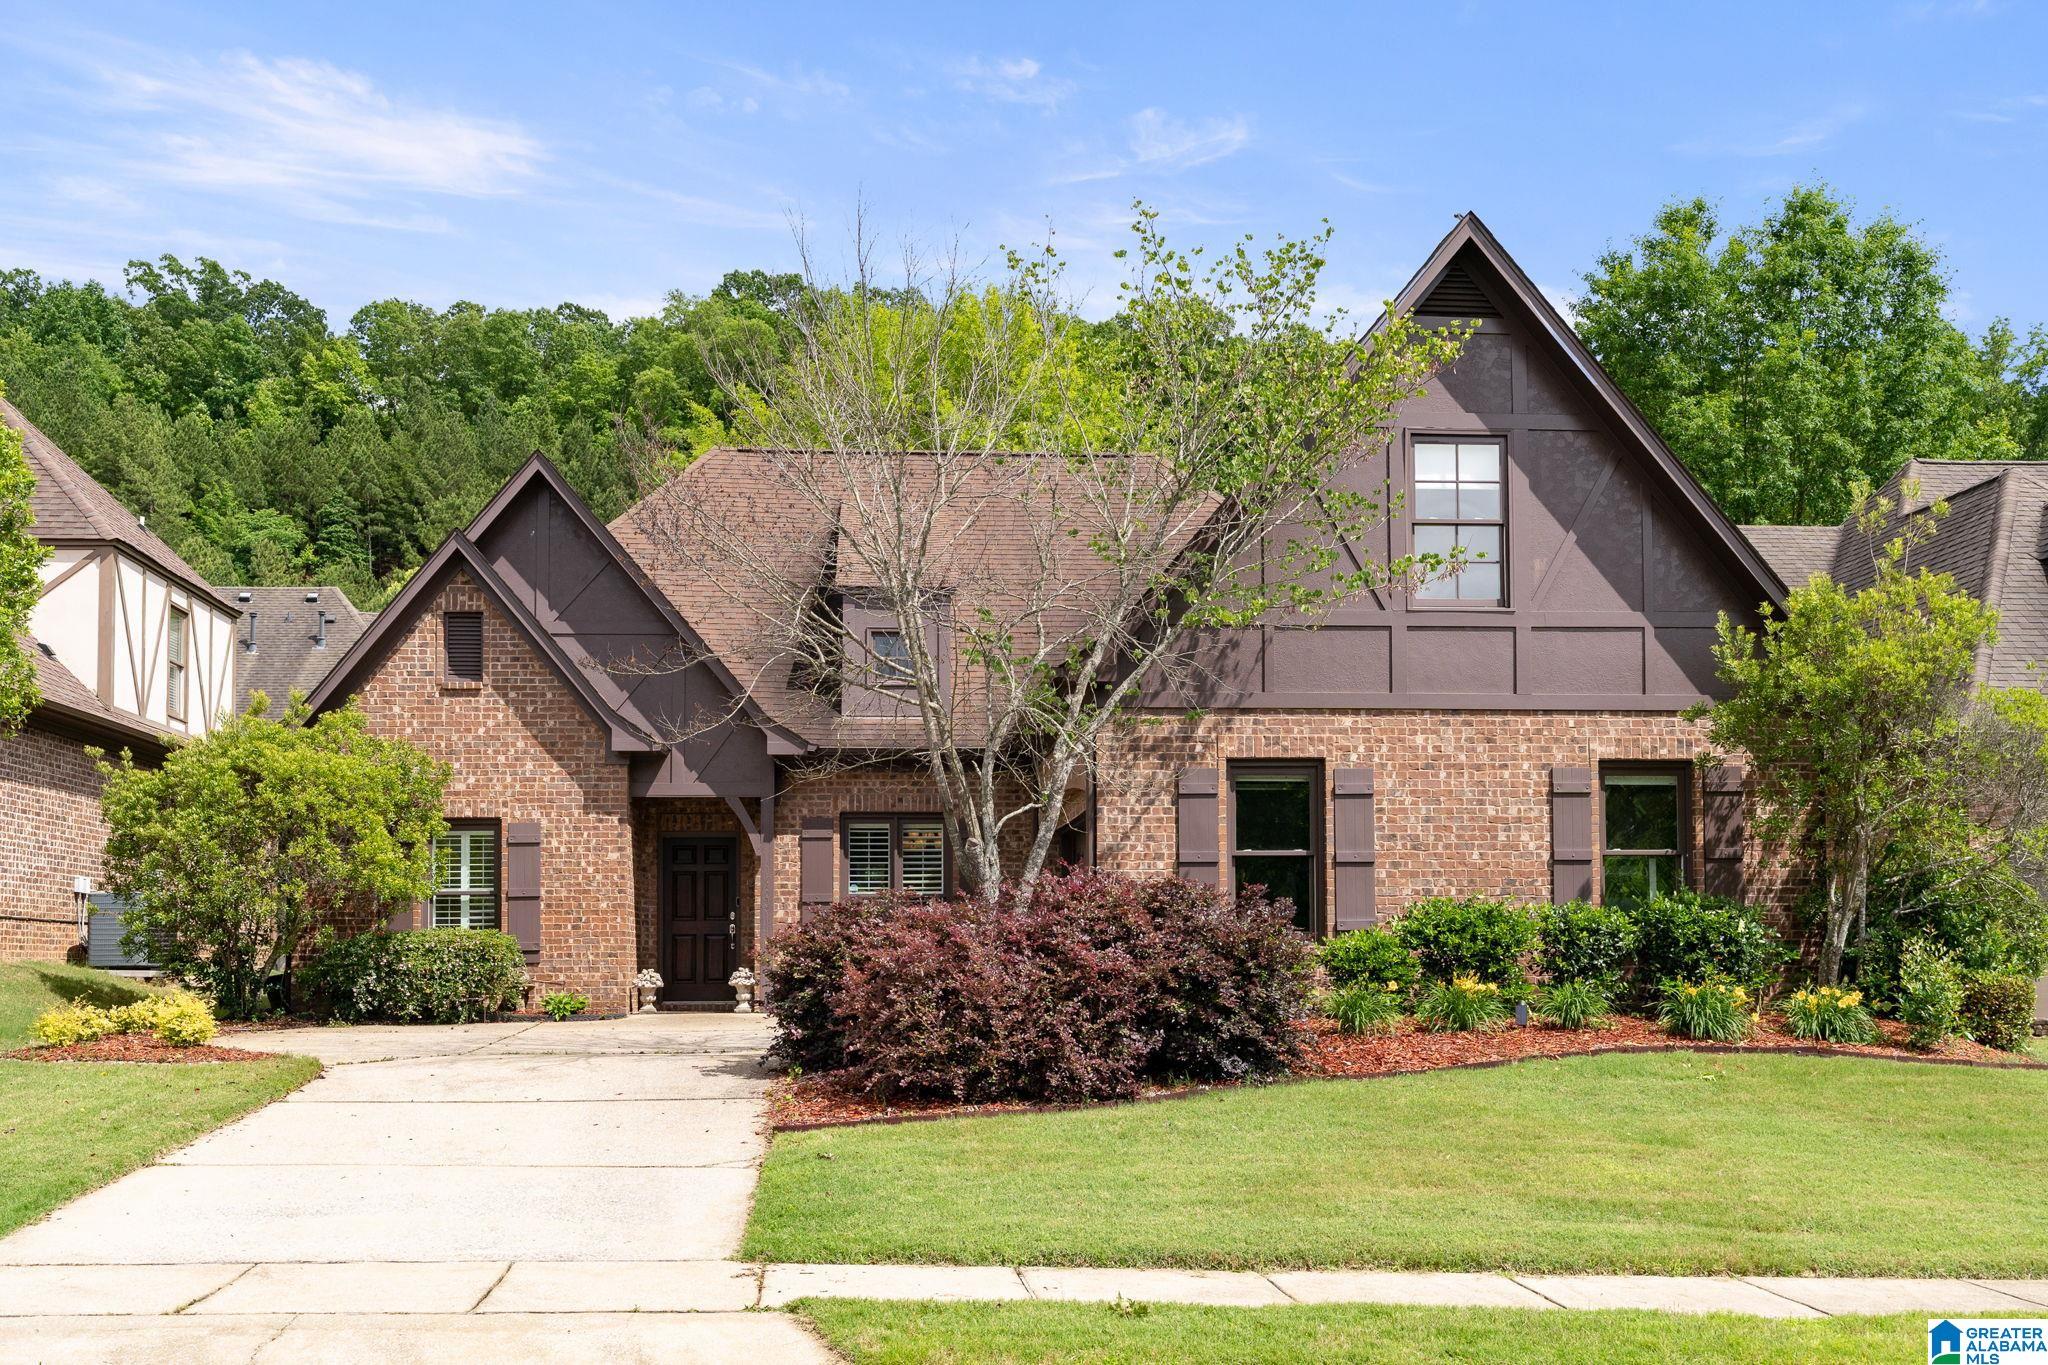
Active
$504,900
4
bds
|
0
ba
|
2,114
sqft
|
built
2005
3009 Valley Ridge Rd, Birmingham, AL 35242
$-293
Cash flow
-3.0%
Cash-on-Cash Return
5.0%
Cap rate
0.6%
Rent to Value Ratio
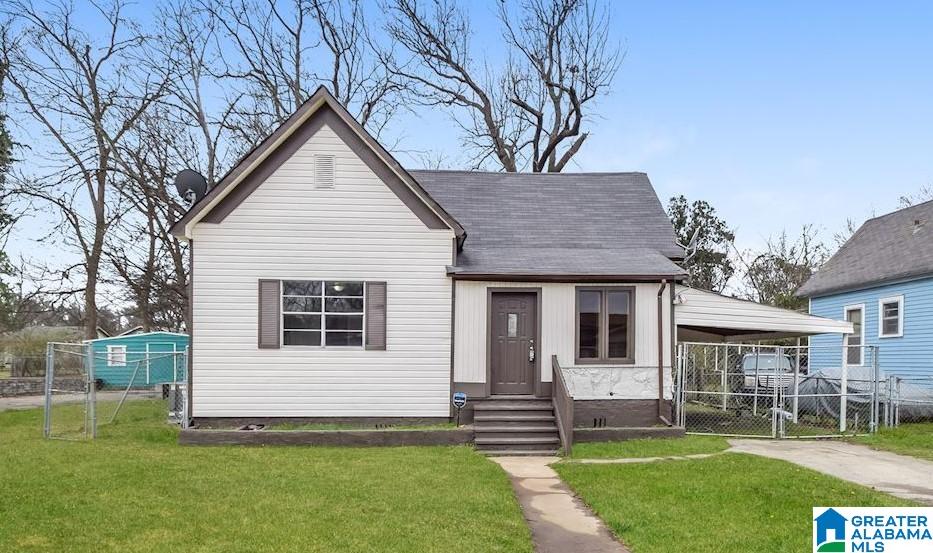
Active
$150,000
3
bds
|
0
ba
|
1,144
sqft
|
built
1920
1302 Frisco St, Birmingham, AL 35224
$49
Cash flow
1.7%
Cash-on-Cash Return
6.1%
Cap rate
0.7%
Rent to Value Ratio
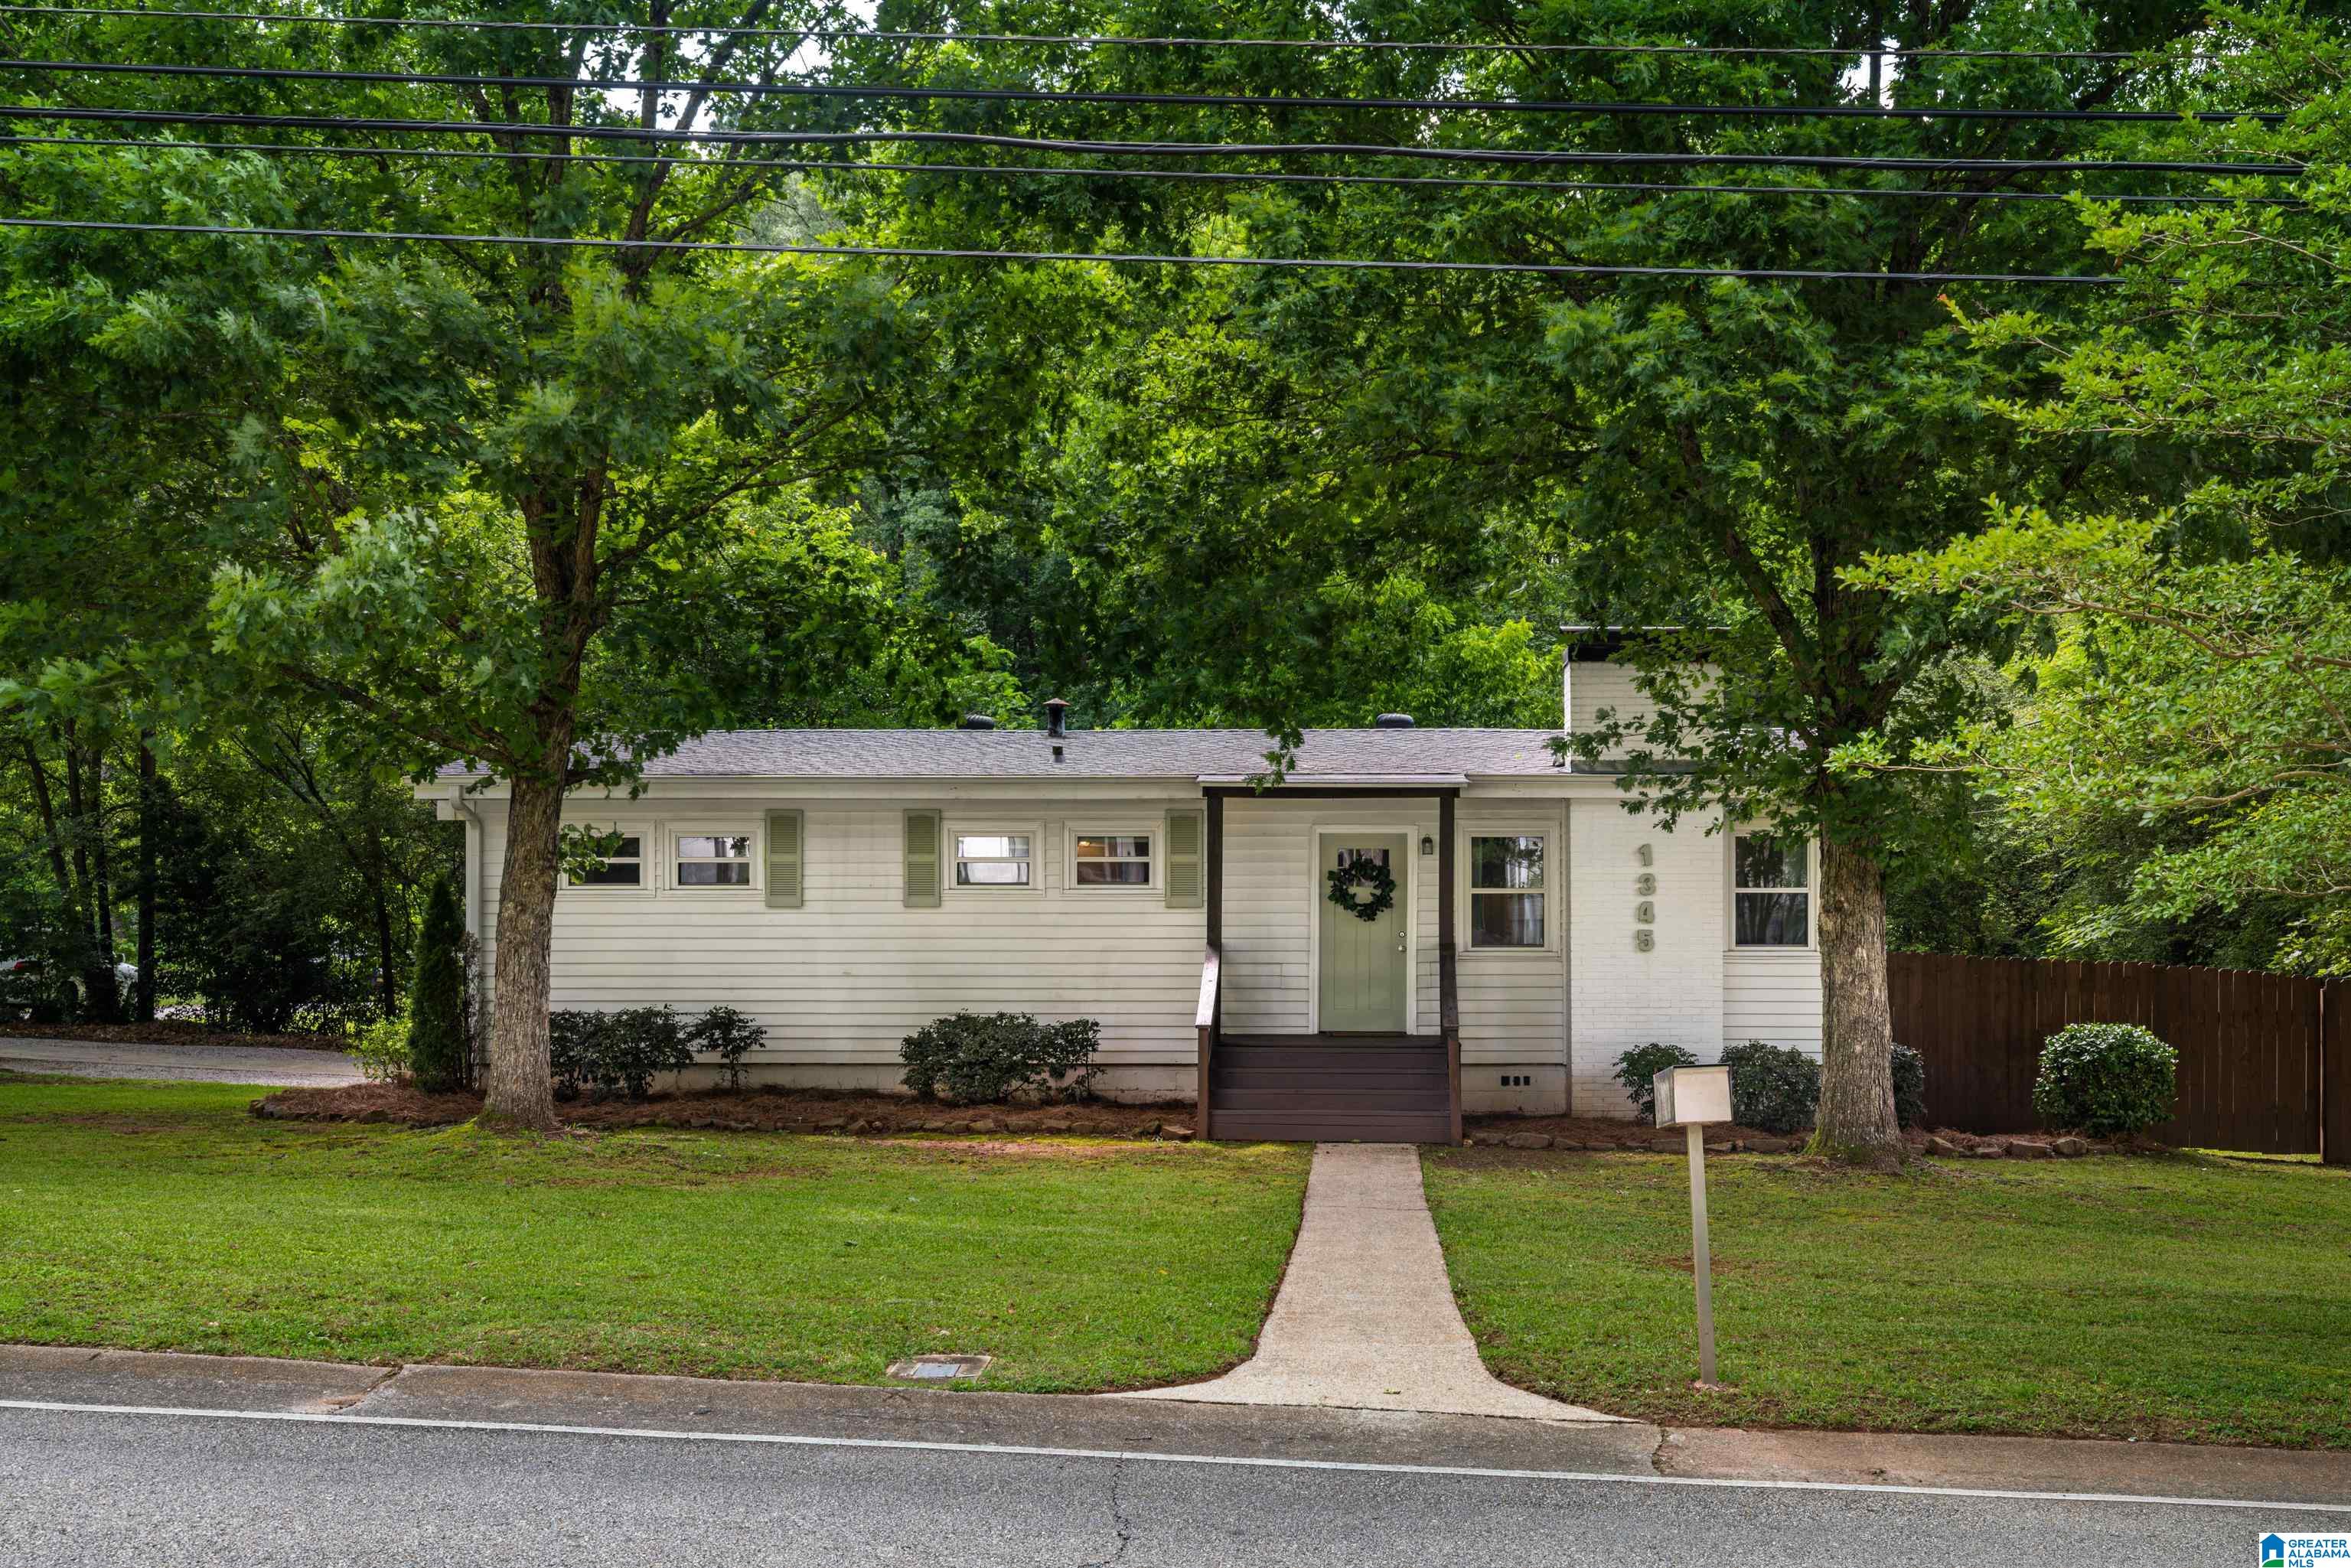
Active under contract
$325,000
3
bds
|
0
ba
|
1,245
sqft
|
built
1953
1345 Cresthill Rd, Birmingham, AL 35213
$187
Cash flow
3.0%
Cash-on-Cash Return
6.4%
Cap rate
0.8%
Rent to Value Ratio
Active
$485,000
4
bds
|
0
ba
|
2,383
sqft
|
built
2008
1517 Laurens St, Birmingham, AL 35242
$-294
Cash flow
-3.2%
Cash-on-Cash Return
5.0%
Cap rate
0.6%
Rent to Value Ratio
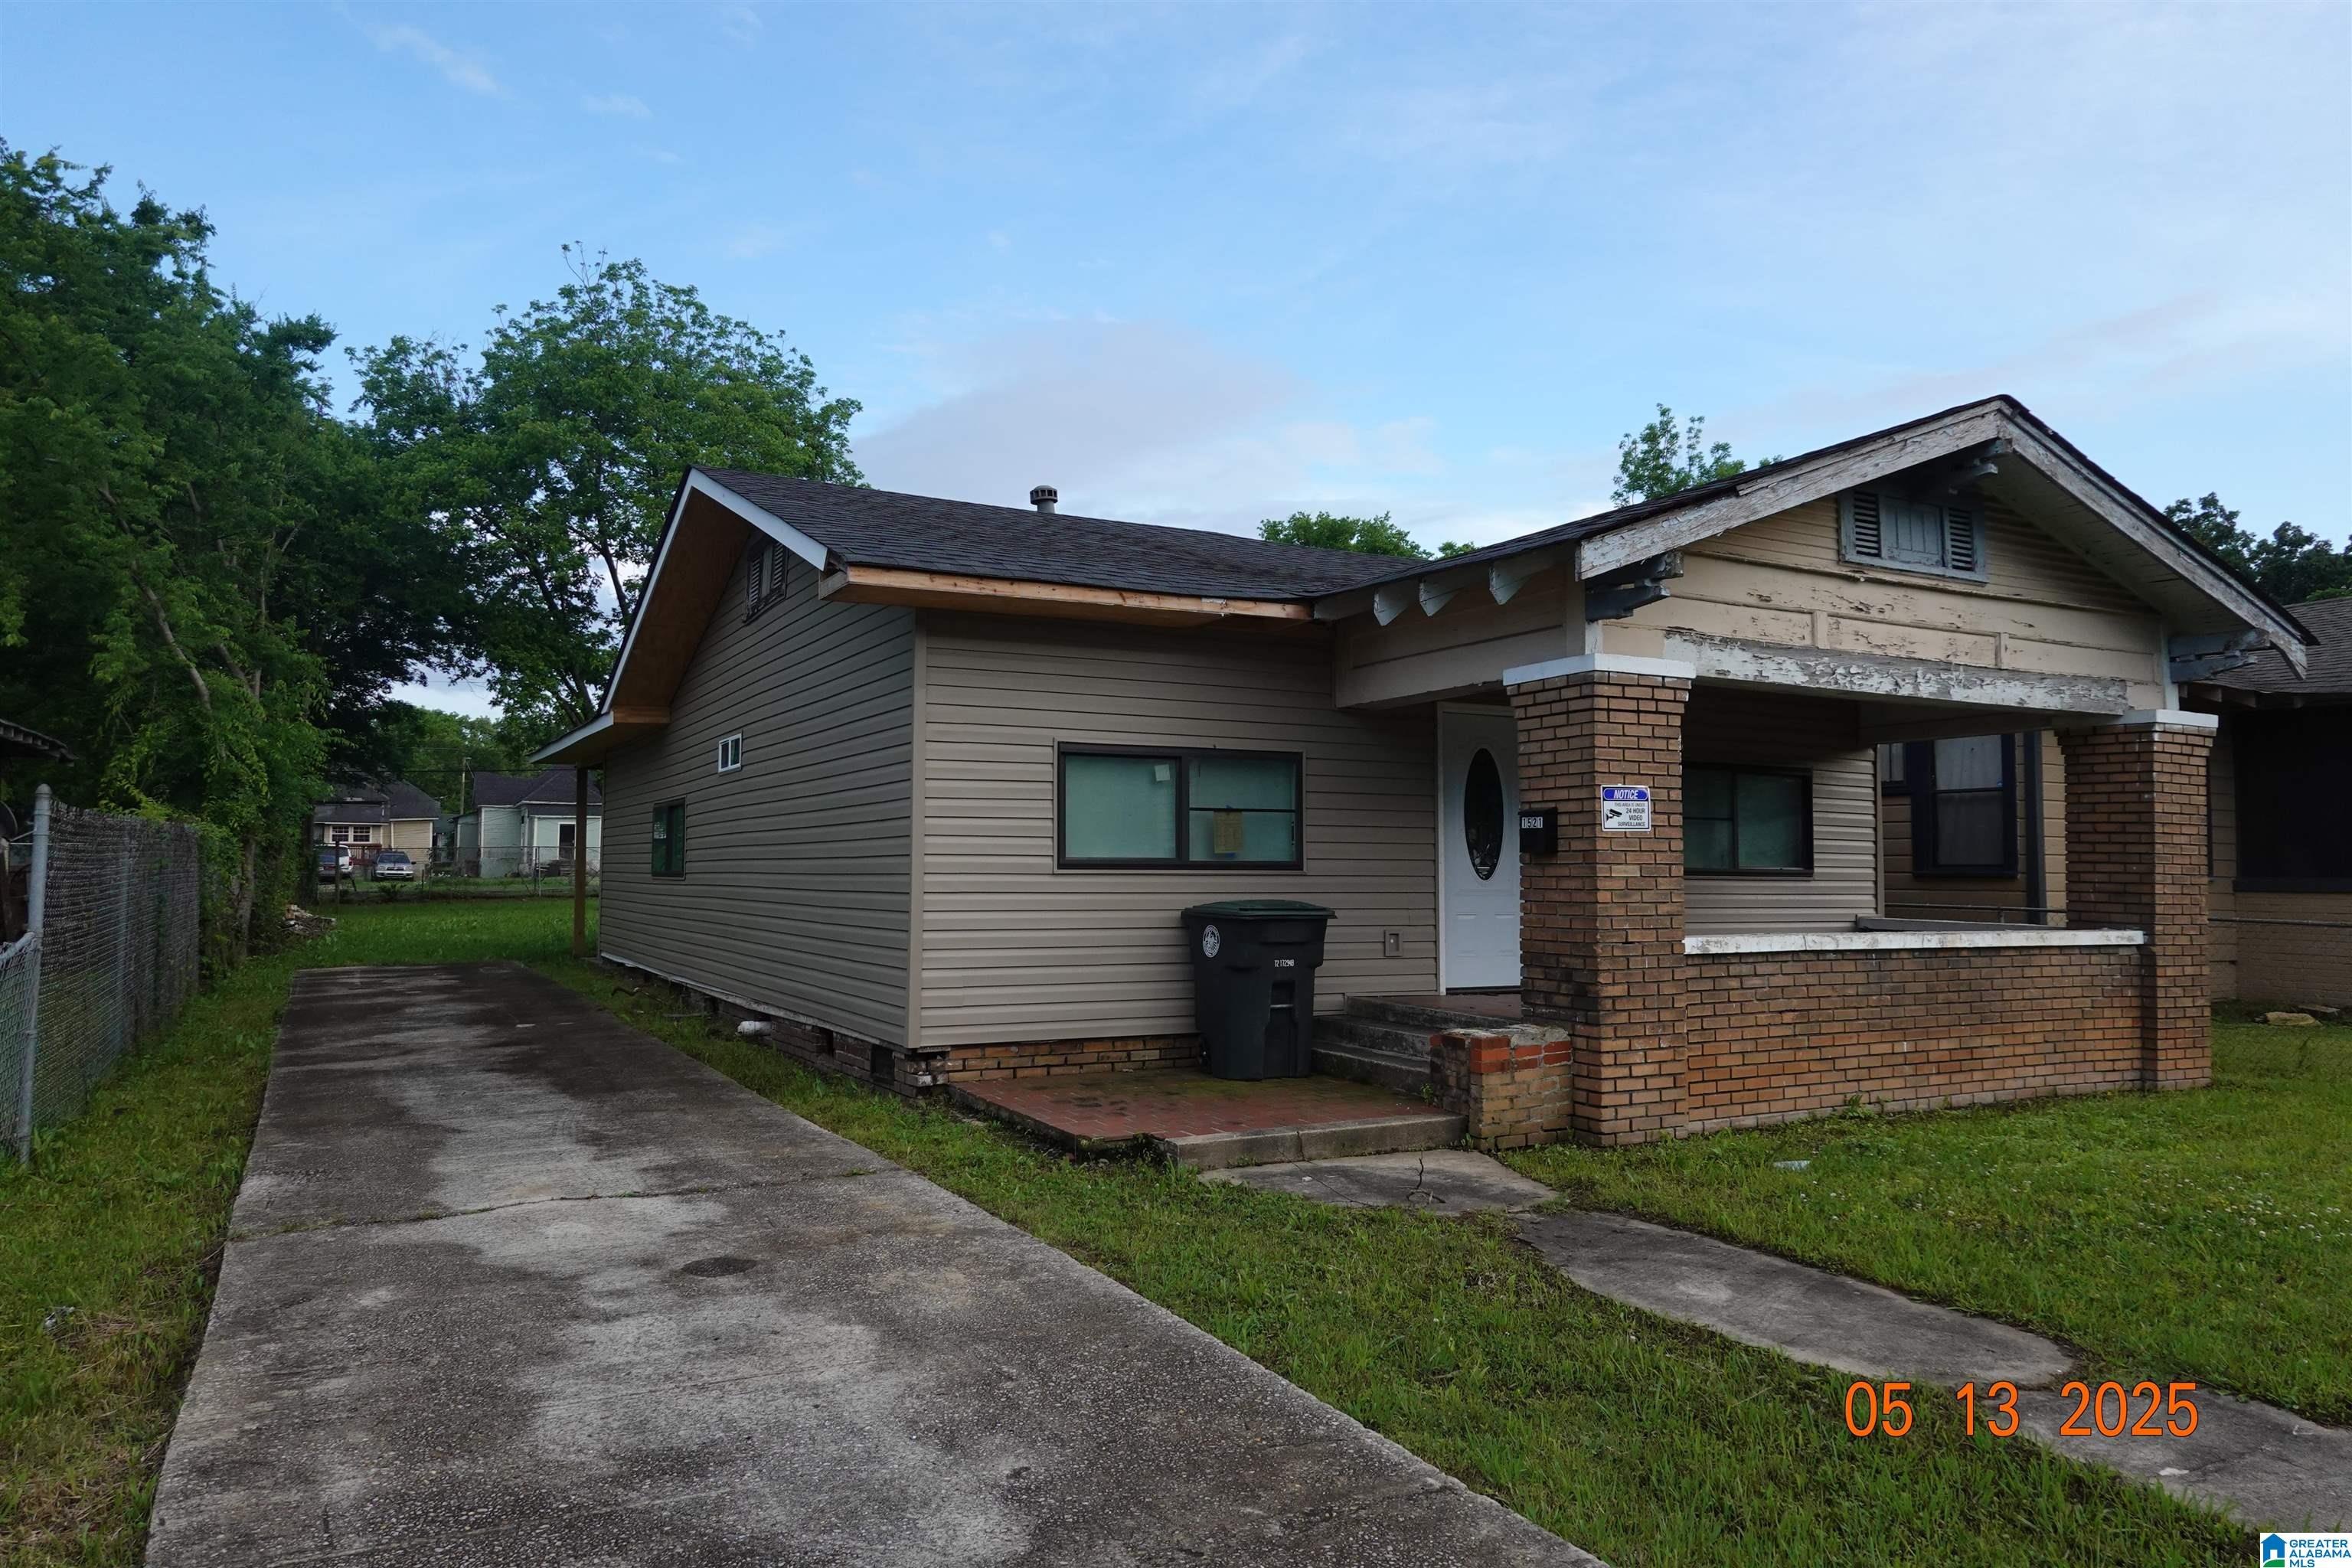
Active
$65,000
3
bds
|
0
ba
|
1,244
sqft
|
built
1930
1521 Alabama Ave SW, Birmingham, AL 35211
$621
Cash flow
11.1%
Cash-on-Cash Return
11.5%
Cap rate
1.4%
Rent to Value Ratio
Active
$699,900
3
bds
|
0
ba
|
2,566
sqft
|
built
1900
3803 Glenwood Ave, Birmingham, AL 35222
$-1,587
Cash flow
-11.8%
Cash-on-Cash Return
3.0%
Cap rate
0.4%
Rent to Value Ratio
Active
$89,900
3
bds
|
0
ba
|
1,200
sqft
|
built
1975
4018 Saint John Way NW, Birmingham, AL 35215
$541
Cash flow
31.4%
Cash-on-Cash Return
12.9%
Cap rate
1.6%
Rent to Value Ratio
Active
$157,000
3
bds
|
0
ba
|
1,323
sqft
|
built
1951
315 85th St S, Birmingham, AL 35206
$223
Cash flow
7.4%
Cash-on-Cash Return
7.4%
Cap rate
0.9%
Rent to Value Ratio
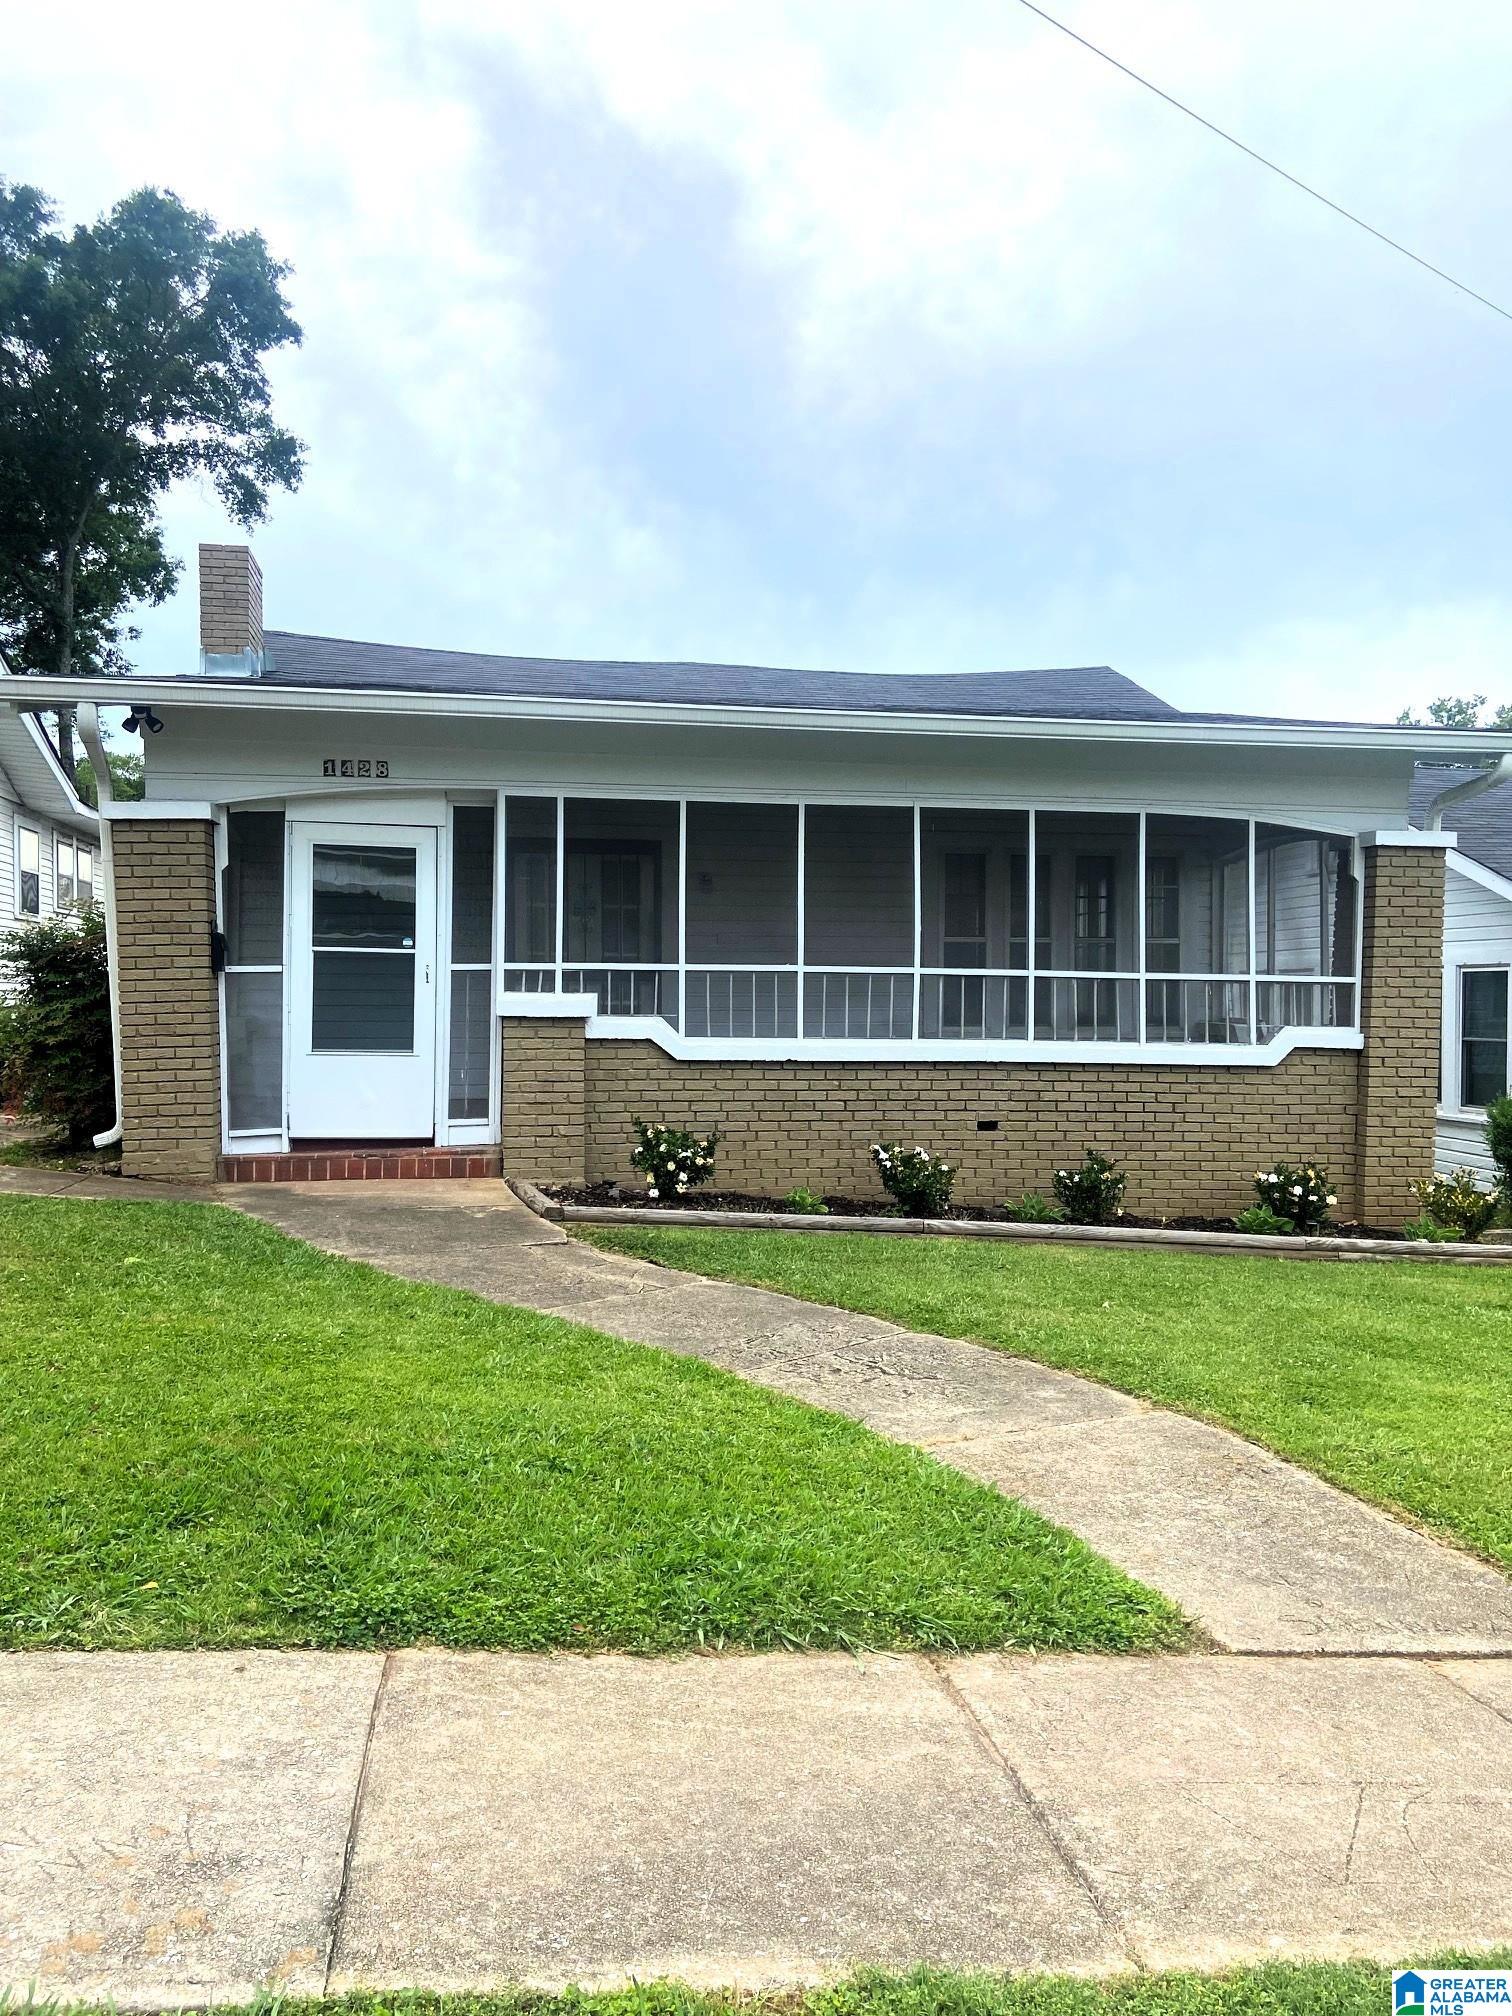
Active
$329,900
3
bds
|
0
ba
|
1,442
sqft
|
built
1920
1428 11th Pl S, Birmingham, AL 35205
$-250
Cash flow
-4.0%
Cash-on-Cash Return
4.8%
Cap rate
0.6%
Rent to Value Ratio
Active
$950,000
6
bds
|
0
ba
|
6,385
sqft
|
built
2000
4977 Eagle Crest Rd, Birmingham, AL 35242
$-1,736
Cash flow
-9.5%
Cash-on-Cash Return
3.5%
Cap rate
0.4%
Rent to Value Ratio
Active
$100,000
3
bds
|
0
ba
|
1,600
sqft
|
built
1945
4409 9th Ave, Birmingham, AL 35224
$355
Cash flow
18.5%
Cash-on-Cash Return
9.9%
Cap rate
1.2%
Rent to Value Ratio
Active
$99,500
2
bds
|
0
ba
|
886
sqft
|
built
1956
1345 Haven Dr, Birmingham, AL 35214
$150
Cash flow
7.9%
Cash-on-Cash Return
7.5%
Cap rate
0.9%
Rent to Value Ratio
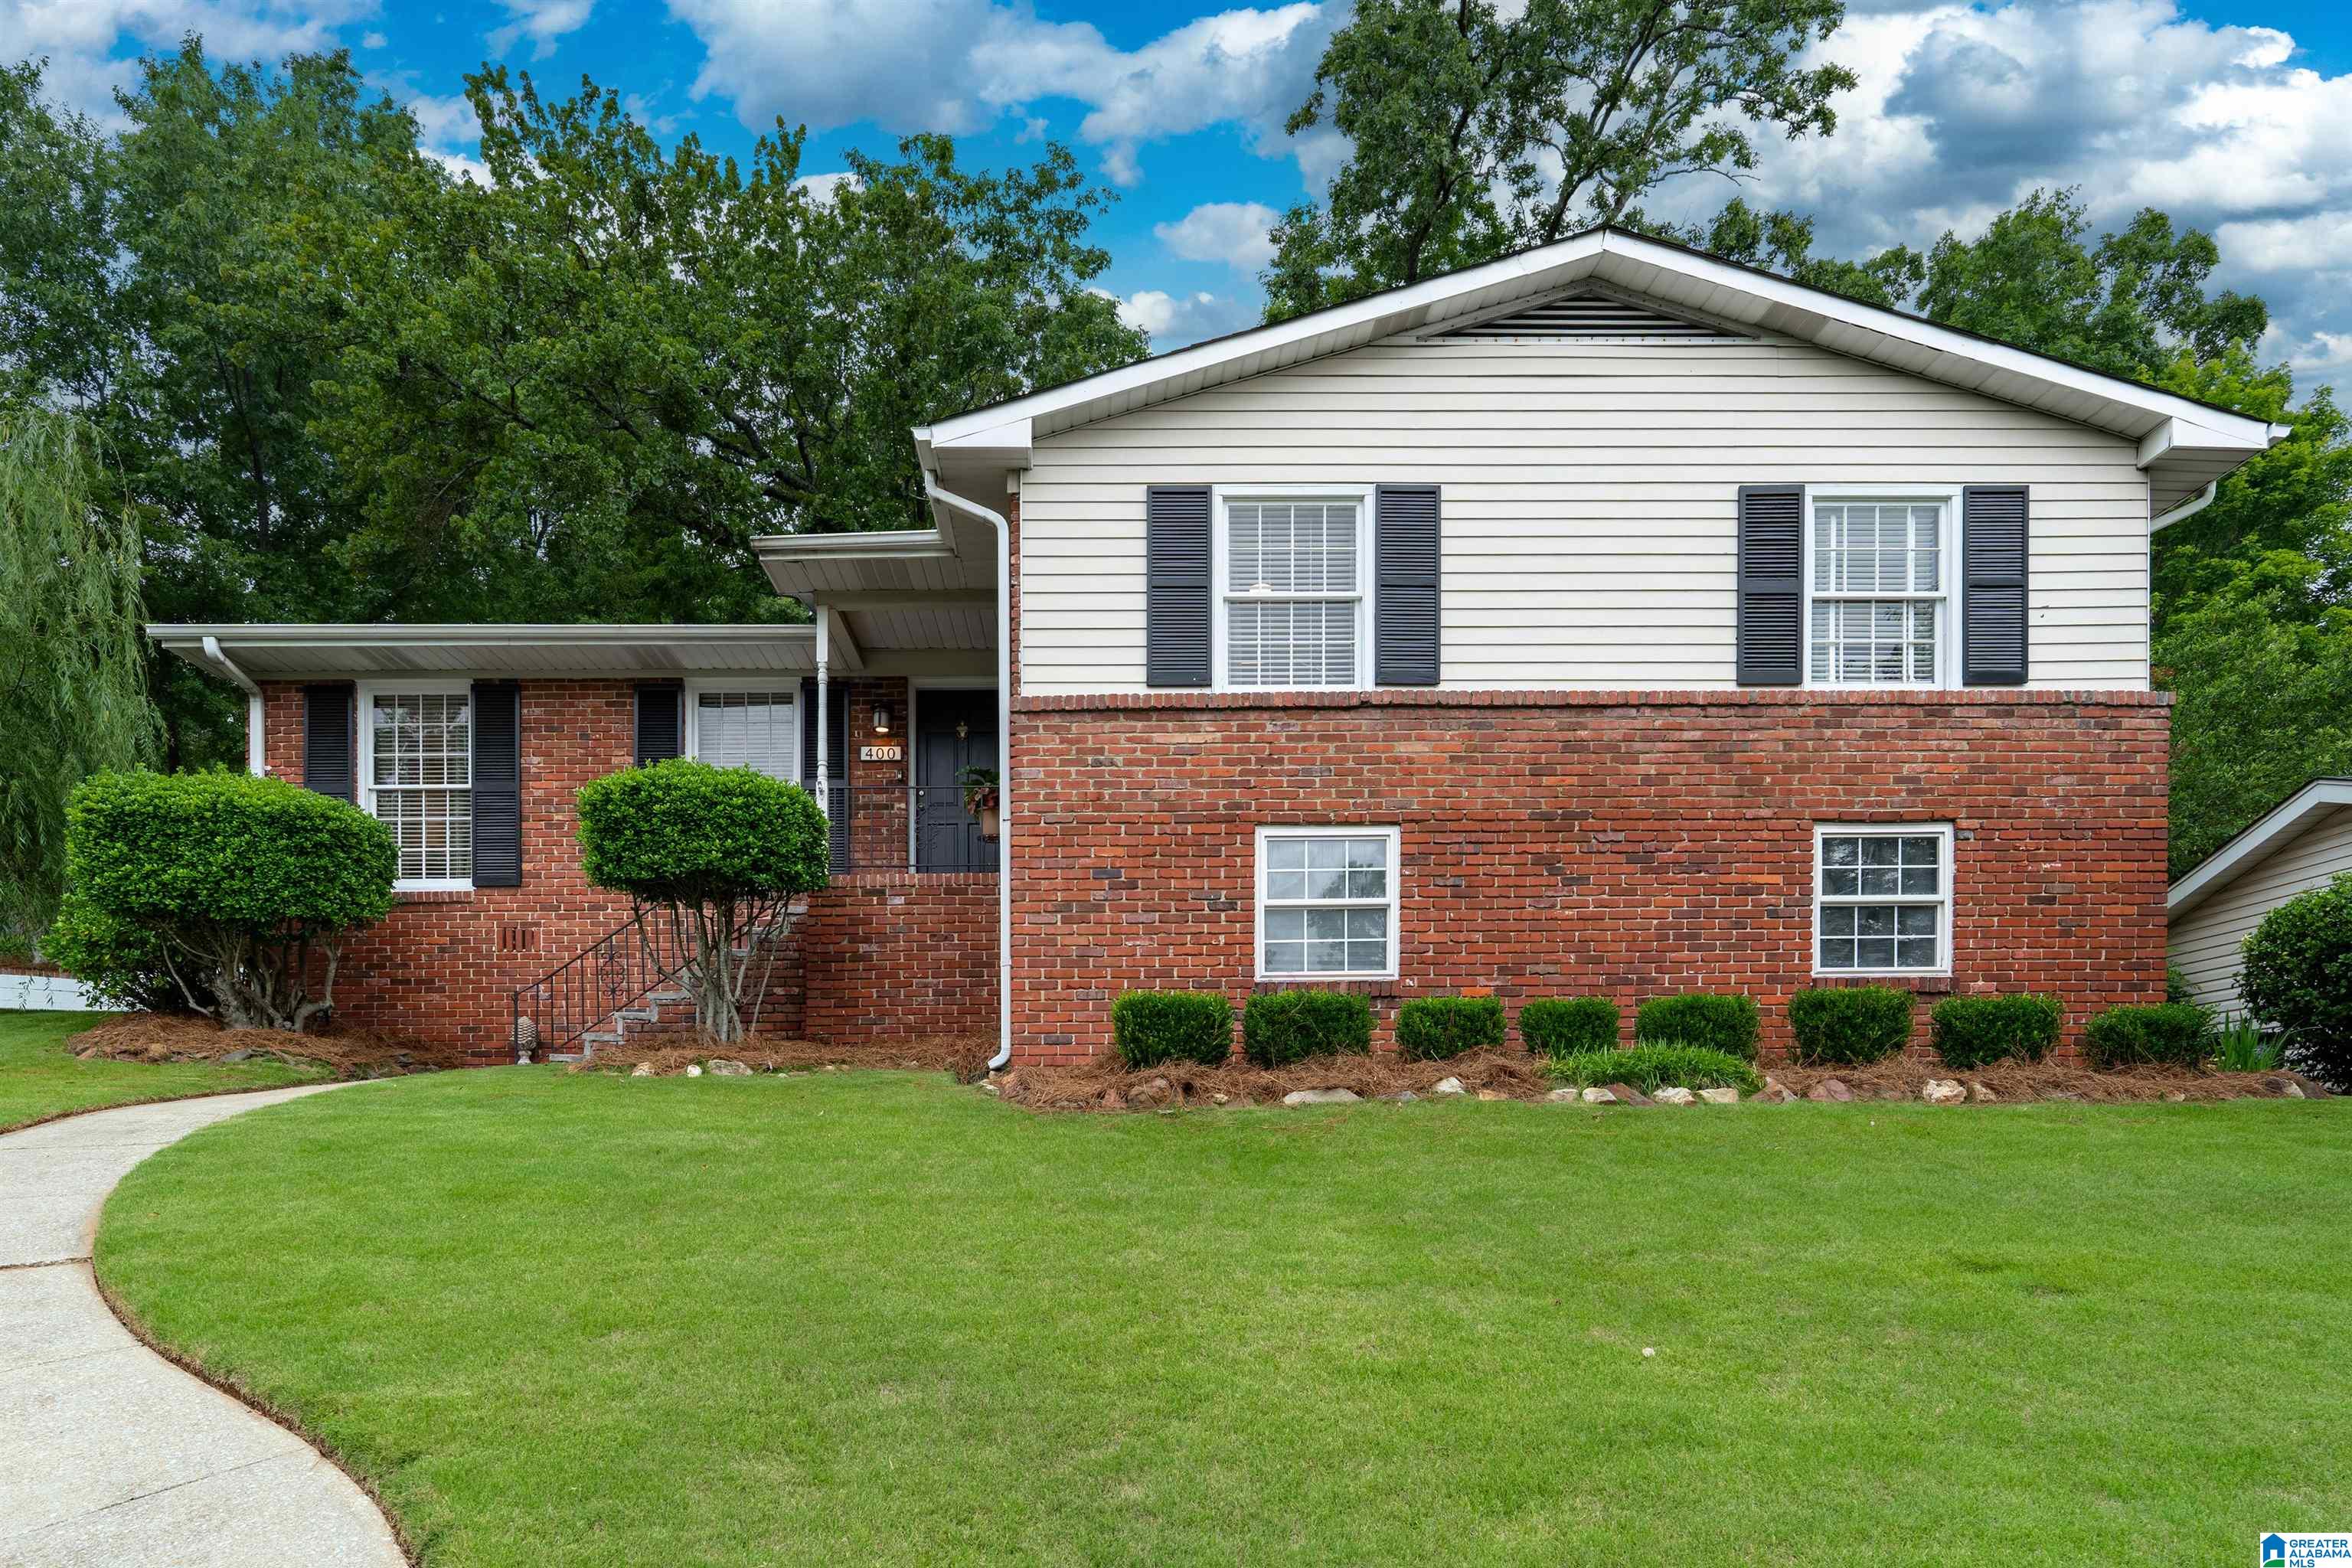
Active
$359,900
3
bds
|
0
ba
|
1,609
sqft
|
built
1965
400 Art Hanes Blvd, Birmingham, AL 35213
$22
Cash flow
0.3%
Cash-on-Cash Return
5.8%
Cap rate
0.7%
Rent to Value Ratio
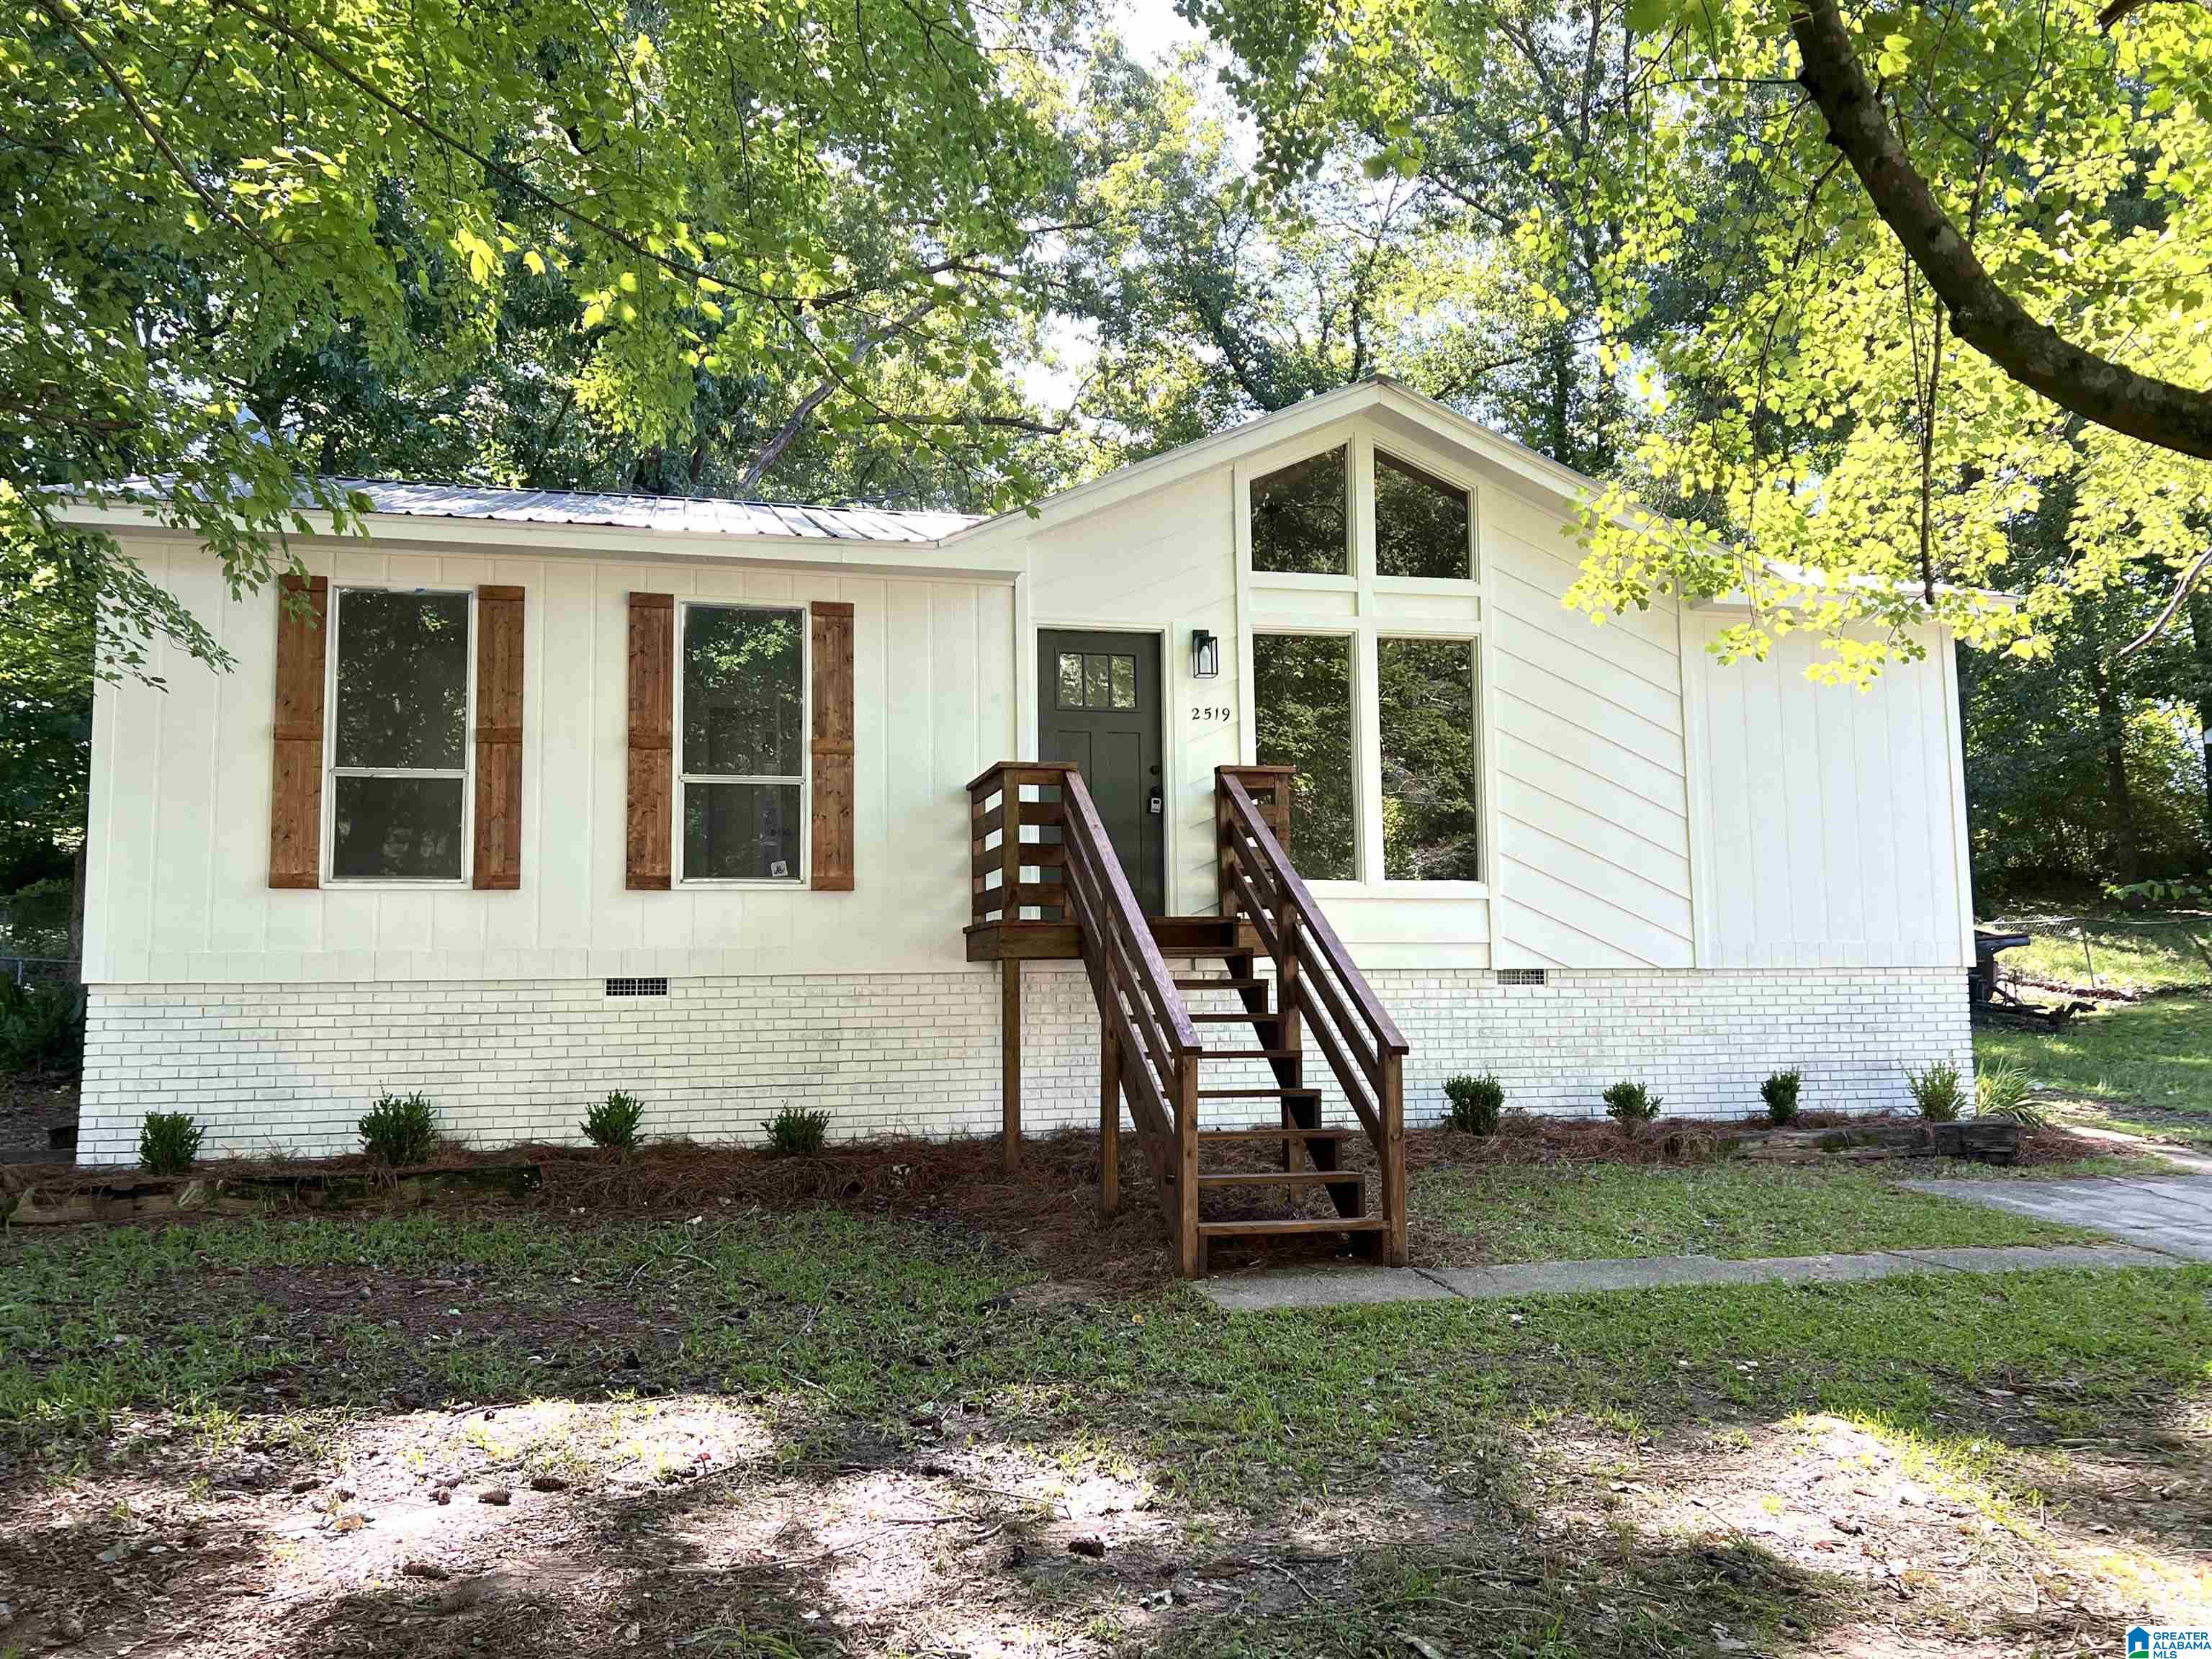
Active
$194,900
3
bds
|
0
ba
|
1,017
sqft
|
built
1980
2519 Martin Cir, Birmingham, AL 35235
$44
Cash flow
1.2%
Cash-on-Cash Return
5.9%
Cap rate
0.7%
Rent to Value Ratio
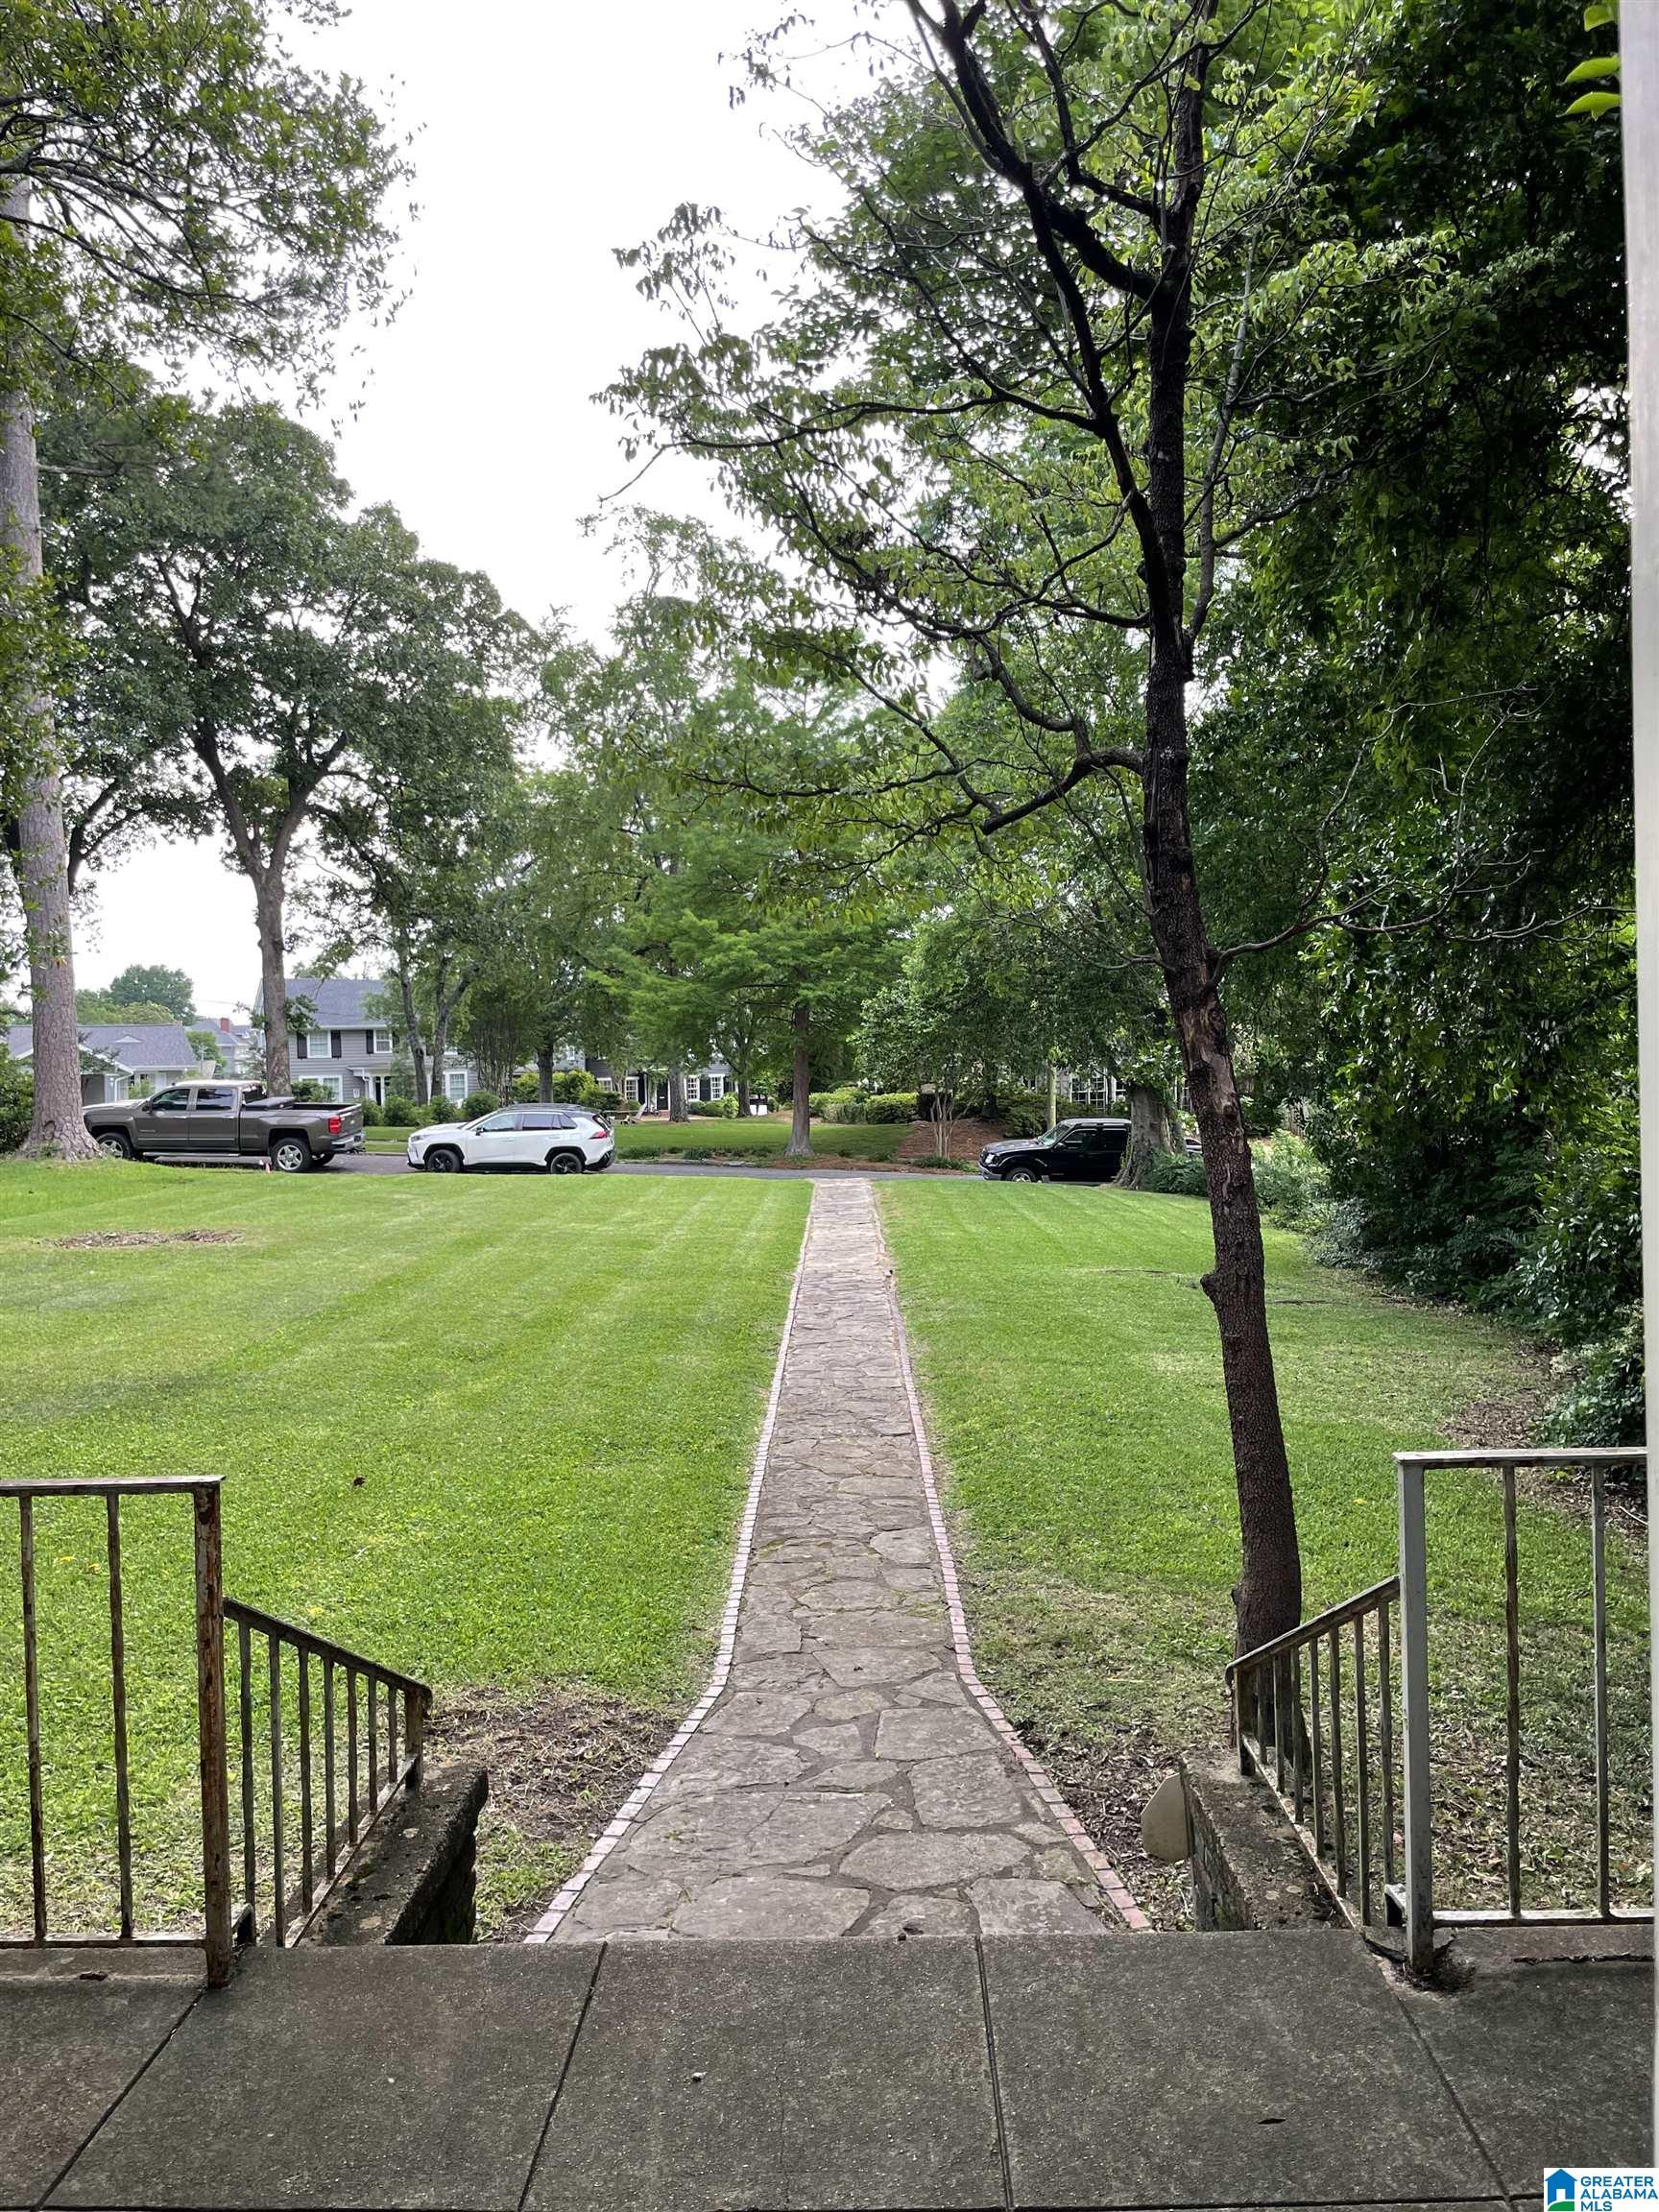
Active
$549,900
3
bds
|
0
ba
|
875
sqft
|
built
1950
1015 43rd St S, Birmingham, AL 35222
$-1,222
Cash flow
-11.6%
Cash-on-Cash Return
3.0%
Cap rate
0.4%
Rent to Value Ratio
Active
$217,900
3
bds
|
0
ba
|
1,664
sqft
|
built
1968
1718 Teakwood Ln, Birmingham, AL 35235
$349
Cash flow
8.4%
Cash-on-Cash Return
7.6%
Cap rate
0.9%
Rent to Value Ratio
Active under contract
$640,000
4
bds
|
0
ba
|
3,591
sqft
|
built
2003
1048 Eagle Hollow Dr, Birmingham, AL 35242
$-639
Cash flow
-5.2%
Cash-on-Cash Return
4.5%
Cap rate
0.5%
Rent to Value Ratio
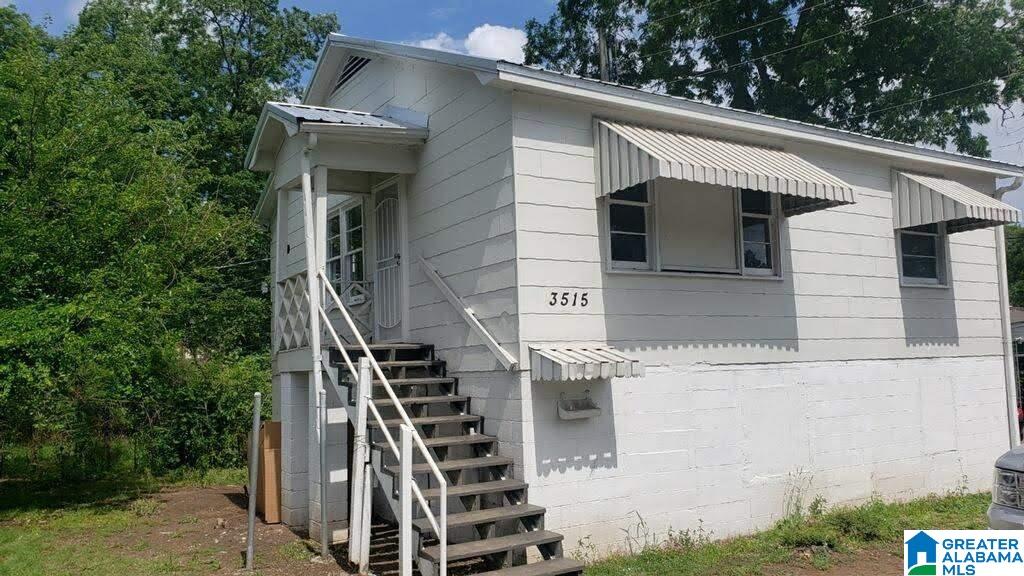
Active
$65,500
2
bds
|
0
ba
|
784
sqft
|
built
1952
3515 24th St N, Birmingham, AL 35207
$552
Cash flow
9.8%
Cash-on-Cash Return
10.1%
Cap rate
1.2%
Rent to Value Ratio
Active
$180,000
2
bds
|
0
ba
|
1,171
sqft
|
built
2004
5947 Princess Blvd, Birmingham, AL 35215
$101
Cash flow
2.9%
Cash-on-Cash Return
6.4%
Cap rate
0.8%
Rent to Value Ratio
Active
$73,500
2
bds
|
0
ba
|
713
sqft
|
built
1948
3218 Central Ave, Birmingham, AL 35224
$621
Cash flow
9.8%
Cash-on-Cash Return
10.1%
Cap rate
1.2%
Rent to Value Ratio
Active
$1,275,000
5
bds
|
0
ba
|
5,669
sqft
|
built
1999
101 Salisbury Ln, Birmingham, AL 35242
$-3,654
Cash flow
-15.0%
Cash-on-Cash Return
2.2%
Cap rate
0.3%
Rent to Value Ratio
Active
$289,999
4
bds
|
0
ba
|
1,780
sqft
|
built
1940
1233 Mays Village Rd, Birmingham, AL 35211
$-268
Cash flow
-4.8%
Cash-on-Cash Return
4.6%
Cap rate
0.6%
Rent to Value Ratio
Active
$239,900
1
bds
|
0
ba
|
770
sqft
|
built
2020
1801 2nd Ave N, Birmingham, AL 35203
$-246
Cash flow
-5.4%
Cash-on-Cash Return
4.4%
Cap rate
0.7%
Rent to Value Ratio
Active
$115,000
3
bds
|
0
ba
|
1,372
sqft
|
built
1945
4011 Walnut Ave SW, Birmingham, AL 35221
$353
Cash flow
16.0%
Cash-on-Cash Return
9.4%
Cap rate
1.1%
Rent to Value Ratio
Active
$449,000
4
bds
|
0
ba
|
2,530
sqft
|
built
1909
1601 15th Ave S, Birmingham, AL 35205
$-400
Cash flow
-4.6%
Cash-on-Cash Return
4.6%
Cap rate
0.6%
Rent to Value Ratio
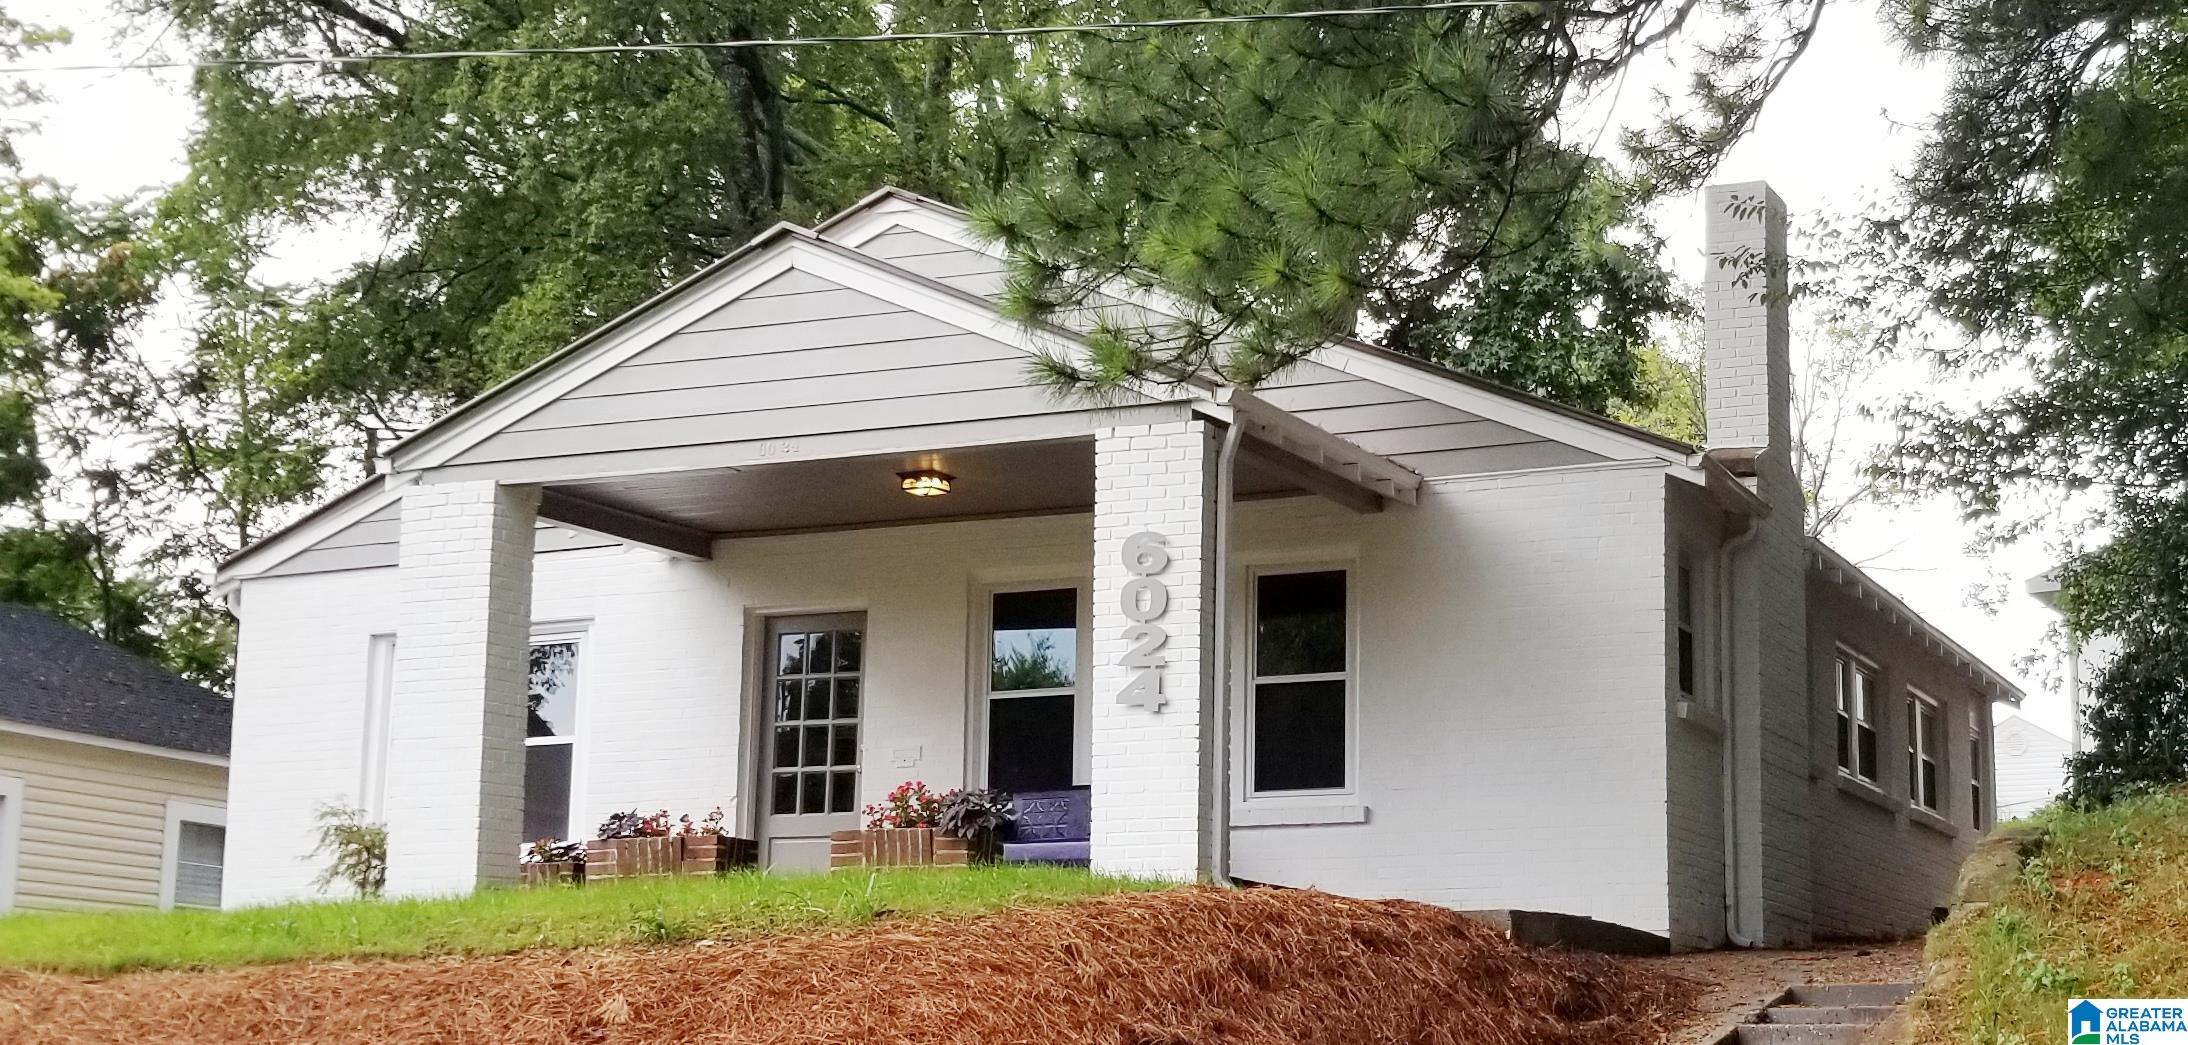
Active
$330,000
2
bds
|
0
ba
|
1,248
sqft
|
built
1941
6024 5th Ct S, Birmingham, AL 35212
$-320
Cash flow
-5.1%
Cash-on-Cash Return
4.5%
Cap rate
0.5%
Rent to Value Ratio
Active
$169,900
3
bds
|
0
ba
|
1,975
sqft
|
built
1960
2901 Jefferson Ave SW, Birmingham, AL 35211
$300
Cash flow
9.2%
Cash-on-Cash Return
7.8%
Cap rate
0.9%
Rent to Value Ratio
Active
$699,000
3
bds
|
0
ba
|
3,083
sqft
|
built
1928
1479 Milner Cres S, Birmingham, AL 35205
$-824
Cash flow
-6.2%
Cash-on-Cash Return
4.3%
Cap rate
0.5%
Rent to Value Ratio
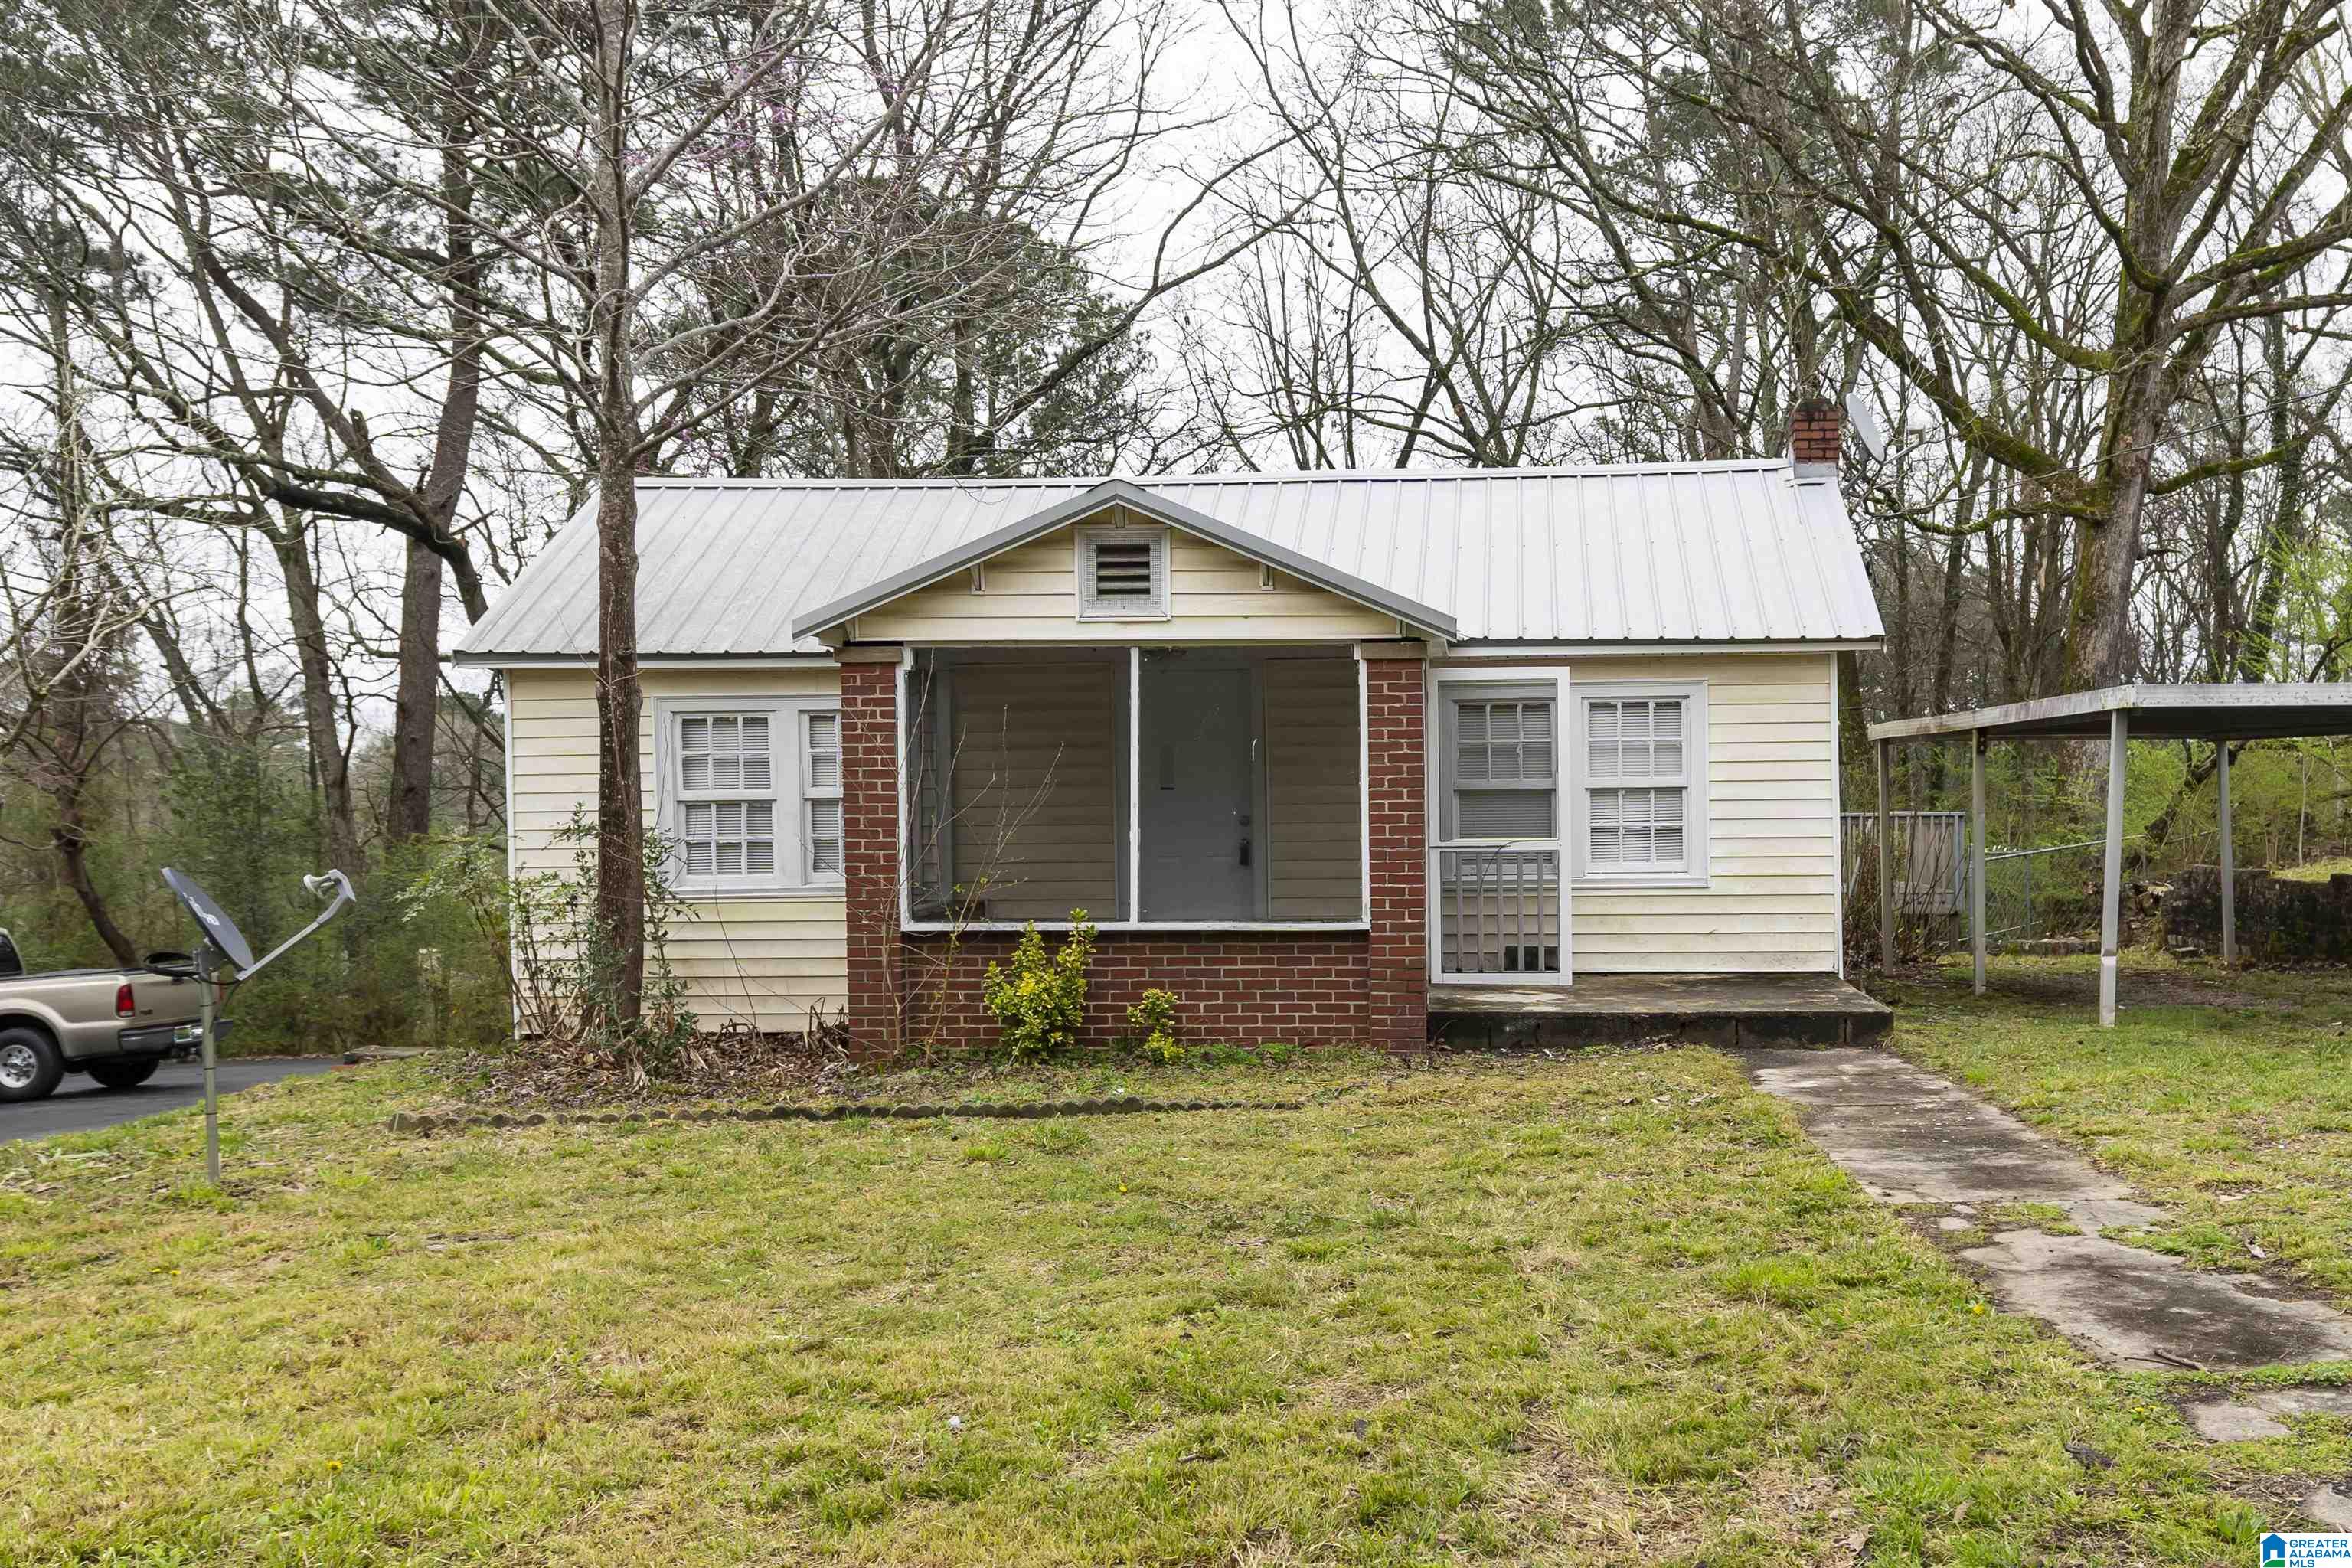
Active
$49,900
4
bds
|
0
ba
|
1,371
sqft
|
built
1935
5105 Georgia Rd, Birmingham, AL 35212
$759
Cash flow
17.7%
Cash-on-Cash Return
18.3%
Cap rate
2.2%
Rent to Value Ratio
Active
$285,000
3
bds
|
0
ba
|
1,887
sqft
|
built
1930
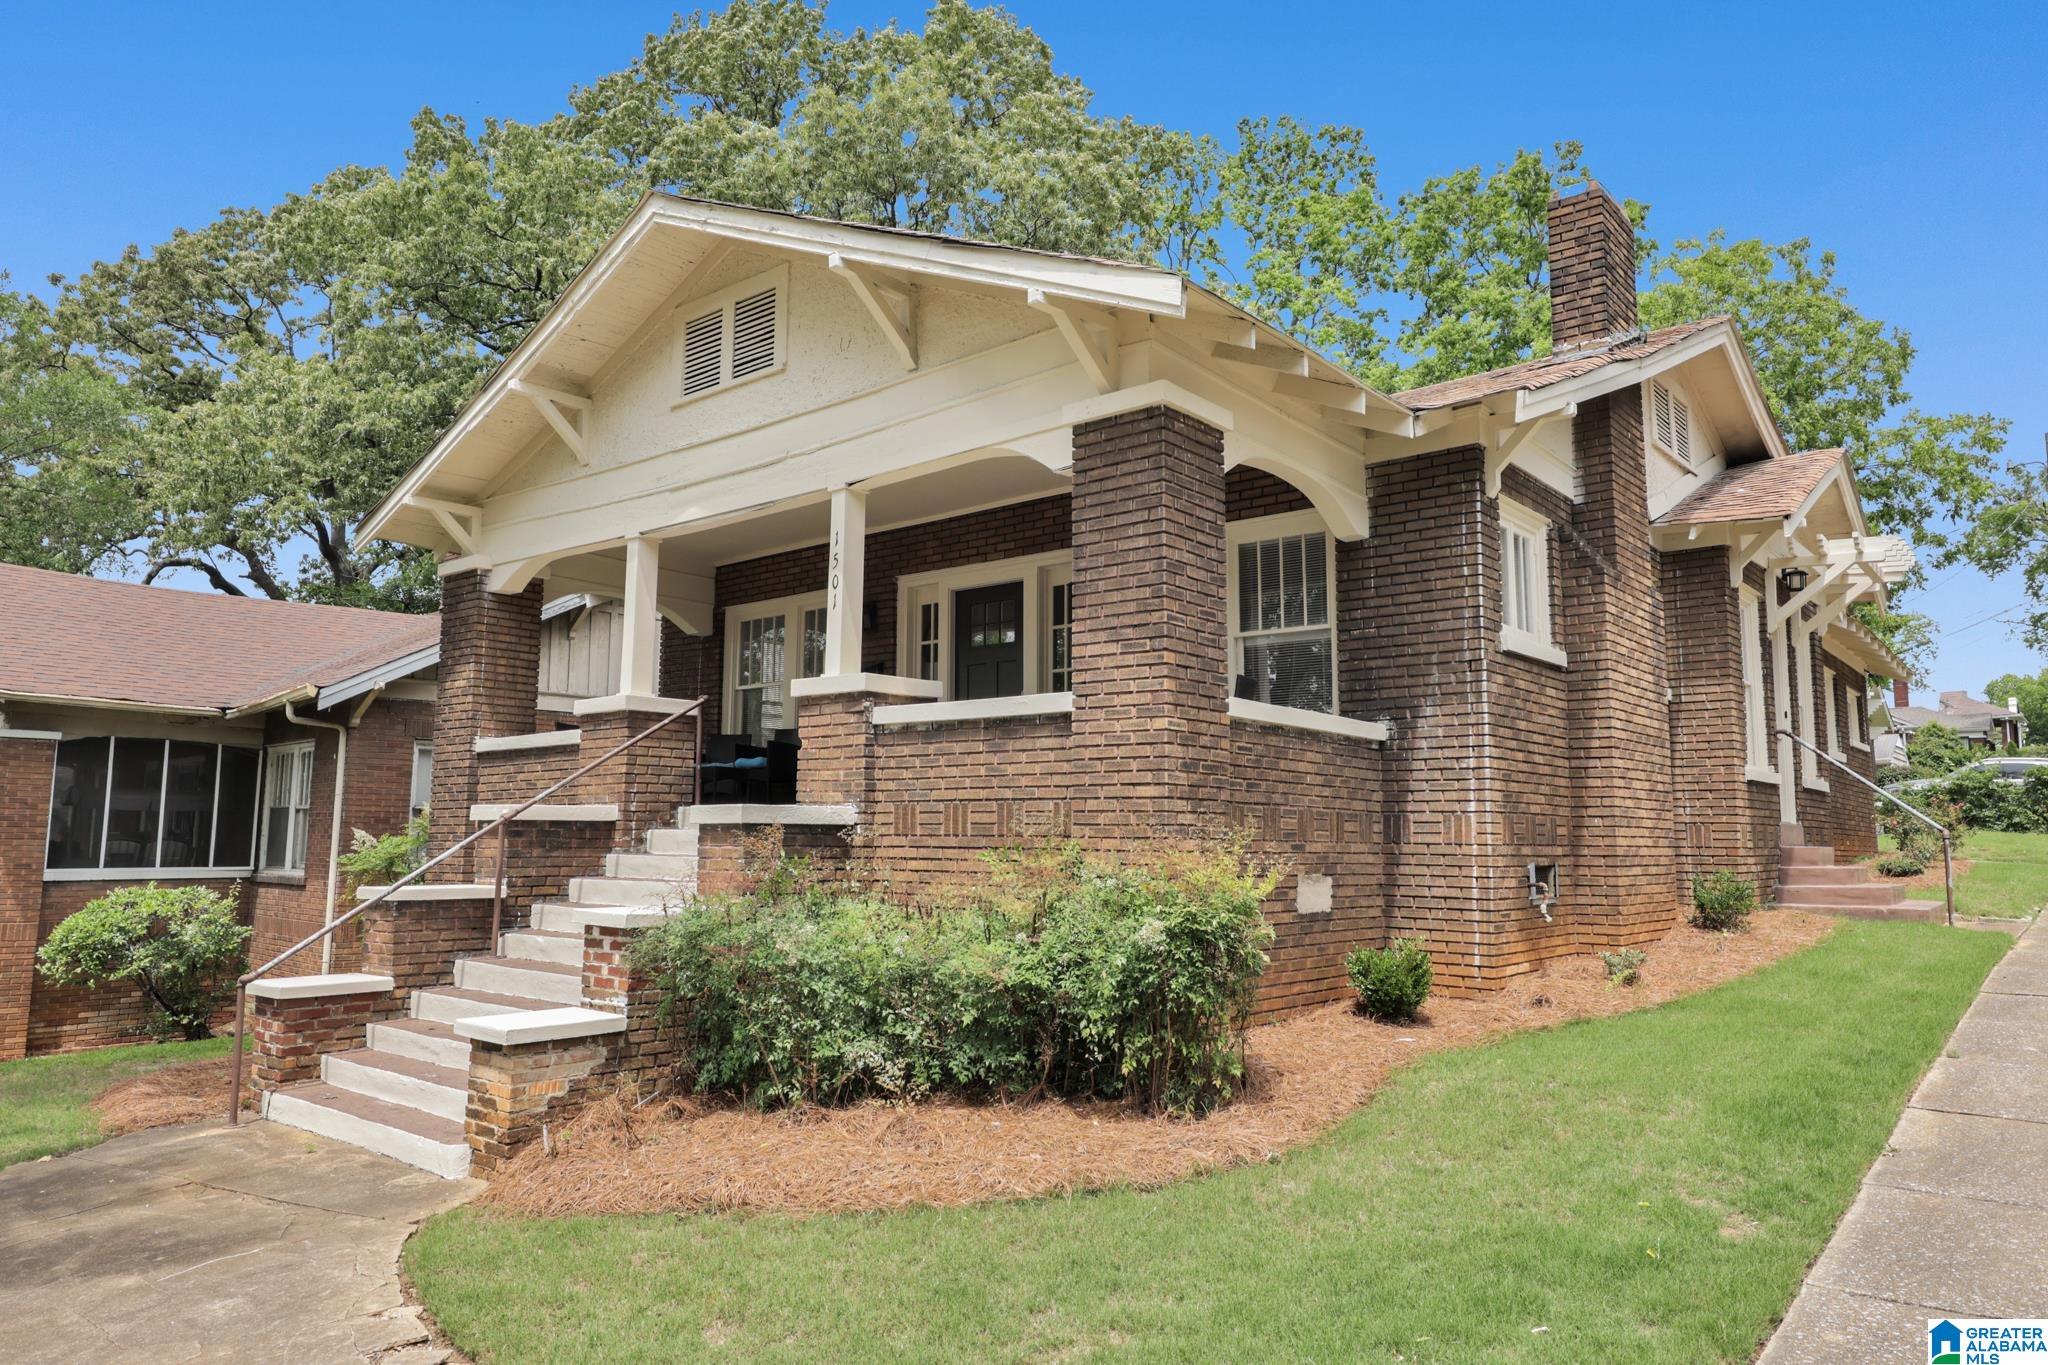
1501 34th St N, Birmingham, AL 35234
$31
Cash flow
0.6%
Cash-on-Cash Return
5.8%
Cap rate
0.7%
Rent to Value Ratio
Active
$630,000
4
bds
|
4
ba
|
0
sqft
|
built
2008
1113 Bristol Way, Birmingham, AL 35242
$-1,034
Cash flow
-8.6%
Cash-on-Cash Return
3.7%
Cap rate
0.5%
Rent to Value Ratio
Active
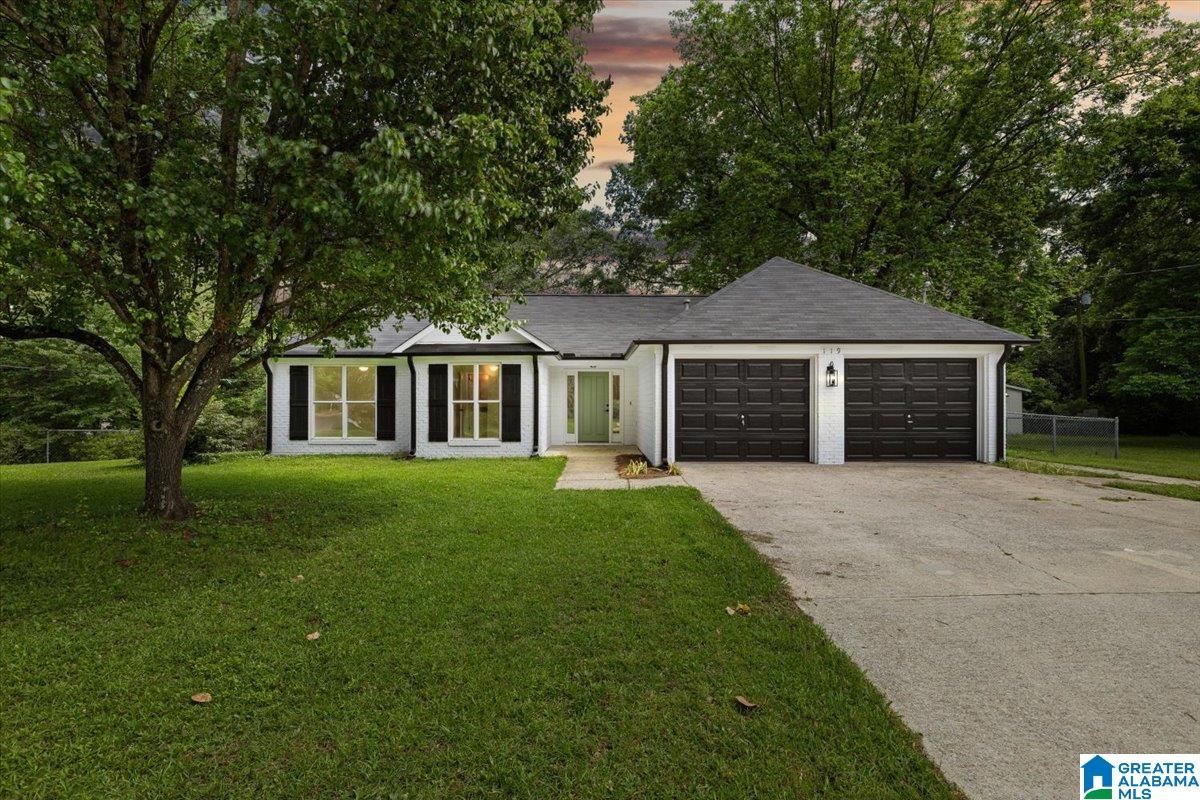
$434,900
3
bds
|
0
ba
|
1,332
sqft
|
built
1999
119 Oxmoor Rd, Birmingham, AL 35209
$-333
Cash flow
-4.0%
Cash-on-Cash Return
4.8%
Cap rate
0.6%
Rent to Value Ratio