Birmingham, AL Investment Properties for Sale
Browse homes for sale and investment properties in Birmingham, AL. Refine your search by price, property type, or more.
Best cash flowing properties in Birmingham, AL
Pending
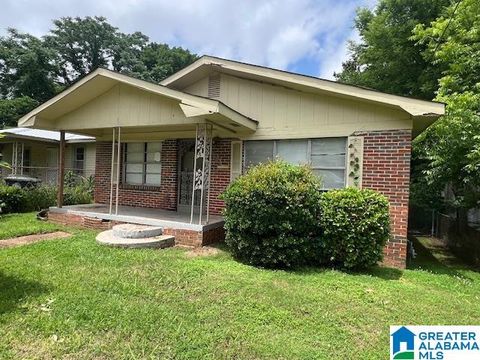
$39,900
4
bds
|
0
ba
|
1,632
sqft
|
built
1940
1449 21st St N, Birmingham, AL 35234
$897
Cash flow
26.2%
Cash-on-Cash Return
27.0%
Cap rate
3.3%
Rent to Value Ratio
Active under contract
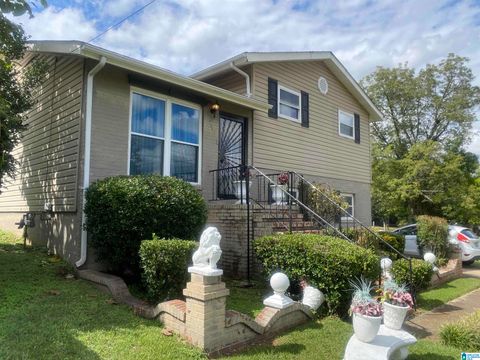
$49,000
3
bds
|
0
ba
|
3,080
sqft
|
built
1930
2623 Avenue J, Birmingham, AL 35218
$828
Cash flow
19.7%
Cash-on-Cash Return
20.3%
Cap rate
2.4%
Rent to Value Ratio
905 out of 1,019 properties for sale in Birmingham, AL
Limited Results Shown
Create a free account, or log in to reveal all property listings and enjoy the complete experience.
Active
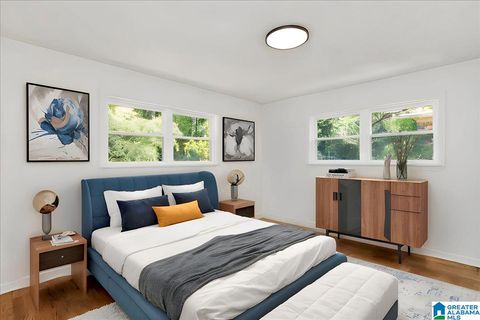
$475,000
5
bds
|
0
ba
|
2,724
sqft
|
built
1920
1710 Cullom St S, Birmingham, AL 35205
$-548
Cash flow
-6.0%
Cash-on-Cash Return
4.9%
Cap rate
0.6%
Rent to Value Ratio
Active
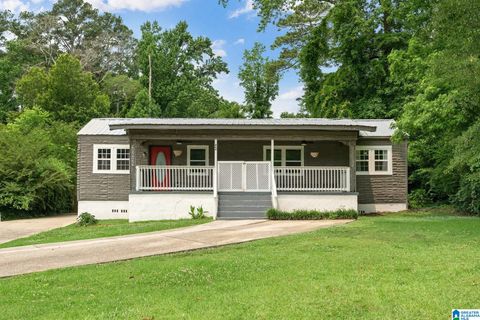
$140,000
4
bds
|
0
ba
|
1,976
sqft
|
built
1935
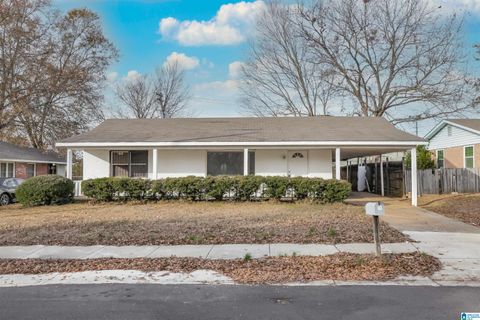
8300 7th Ter S, Birmingham, AL 35206
$235
Cash flow
8.8%
Cash-on-Cash Return
8.3%
Cap rate
1.0%
Rent to Value Ratio
Active
$160,000
4
bds
|
0
ba
|
2,058
sqft
|
built
1970
2509 Bow String Dr, Birmingham, AL 35214
$269
Cash flow
8.8%
Cash-on-Cash Return
8.3%
Cap rate
1.0%
Rent to Value Ratio
Active
$210,000
4
bds
|
0
ba
|
1,272
sqft
|
built
1932
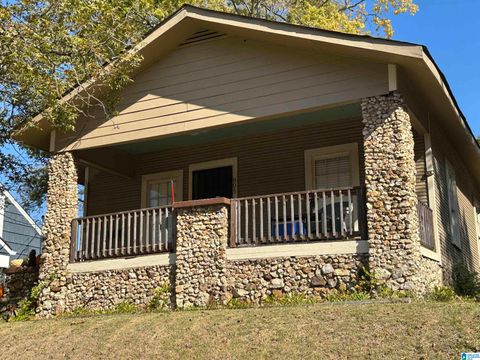
539 63rd St S, Birmingham, AL 35212
$146
Cash flow
3.6%
Cash-on-Cash Return
7.1%
Cap rate
0.9%
Rent to Value Ratio
Active
$165,000
1
bds
|
0
ba
|
276
sqft
|
built
1887
2015 1st Ave N, Birmingham, AL 35203
$91
Cash flow
2.9%
Cash-on-Cash Return
6.9%
Cap rate
0.9%
Rent to Value Ratio
Active
$279,000
3
bds
|
0
ba
|
2,208
sqft
|
built
1993
1805 Petticoat Way, Birmingham, AL 35215
$-353
Cash flow
-6.6%
Cash-on-Cash Return
4.7%
Cap rate
0.6%
Rent to Value Ratio
Active
$99,900
5
bds
|
0
ba
|
2,896
sqft
|
built
1940
2304 Mayfield Ave SW, Birmingham, AL 35211
$513
Cash flow
26.8%
Cash-on-Cash Return
12.4%
Cap rate
1.5%
Rent to Value Ratio
Active
$159,000
4
bds
|
0
ba
|
2,172
sqft
|
built
1969
1904 14th Pl SW, Birmingham, AL 35211
$343
Cash flow
11.3%
Cash-on-Cash Return
8.9%
Cap rate
1.1%
Rent to Value Ratio
Active
$250,000
4
bds
|
0
ba
|
2,818
sqft
|
built
1965
1604 Francis Ave SW, Birmingham, AL 35211
$-408
Cash flow
-8.5%
Cash-on-Cash Return
4.3%
Cap rate
0.5%
Rent to Value Ratio
Active under contract
$179,000
3
bds
|
0
ba
|
1,545
sqft
|
built
1950
444 E Forest Dr, Birmingham, AL 35235
$31
Cash flow
0.9%
Cash-on-Cash Return
6.5%
Cap rate
0.8%
Rent to Value Ratio
Active under contract
$440,000
3
bds
|
0
ba
|
1,928
sqft
|
built
1996
429 Eaton Rd, Birmingham, AL 35242
$-593
Cash flow
-7.0%
Cash-on-Cash Return
4.6%
Cap rate
0.6%
Rent to Value Ratio
Active
$130,000
3
bds
|
0
ba
|
1,286
sqft
|
built
1970
2125 Henry Crumpton Dr, Birmingham, AL 35211
$218
Cash flow
8.7%
Cash-on-Cash Return
8.3%
Cap rate
1.0%
Rent to Value Ratio
Active
$105,000
3
bds
|
0
ba
|
1,524
sqft
|
built
1939
4016 39th Ct N, Birmingham, AL 35217
$349
Cash flow
17.3%
Cash-on-Cash Return
10.3%
Cap rate
1.2%
Rent to Value Ratio

Closed
$379,000
3
bds
|
0
ba
|
1,813
sqft
|
built
1993
2731 Niazuma Ave S, Birmingham, AL 35205
$-599
Cash flow
-8.2%
Cash-on-Cash Return
4.4%
Cap rate
0.5%
Rent to Value Ratio

Active under contract
$484,900
3
bds
|
0
ba
|
1,637
sqft
|
built
2001
62 Hawthorn St, Birmingham, AL 35242
$-725
Cash flow
-7.8%
Cash-on-Cash Return
4.5%
Cap rate
0.6%
Rent to Value Ratio

Active
$310,000
1
bds
|
0
ba
|
974
sqft
|
built
1920
2201 5th Ave S, Birmingham, AL 35233
$-376
Cash flow
-6.3%
Cash-on-Cash Return
4.8%
Cap rate
0.6%
Rent to Value Ratio
Active
$269,900
4
bds
|
0
ba
|
3,530
sqft
|
built
1956
601 Elm St, Birmingham, AL 35206
$-167
Cash flow
-3.2%
Cash-on-Cash Return
5.5%
Cap rate
0.7%
Rent to Value Ratio
Active
$379,900
2
bds
|
0
ba
|
850
sqft
|
built
1950
506 Baker Dr, Birmingham, AL 35213
$-396
Cash flow
-5.4%
Cash-on-Cash Return
5.0%
Cap rate
0.6%
Rent to Value Ratio
Active
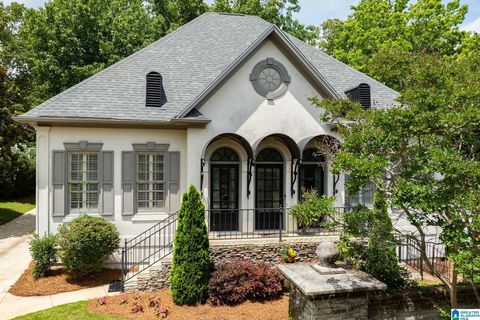
$399,900
3
bds
|
0
ba
|
2,364
sqft
|
built
1963
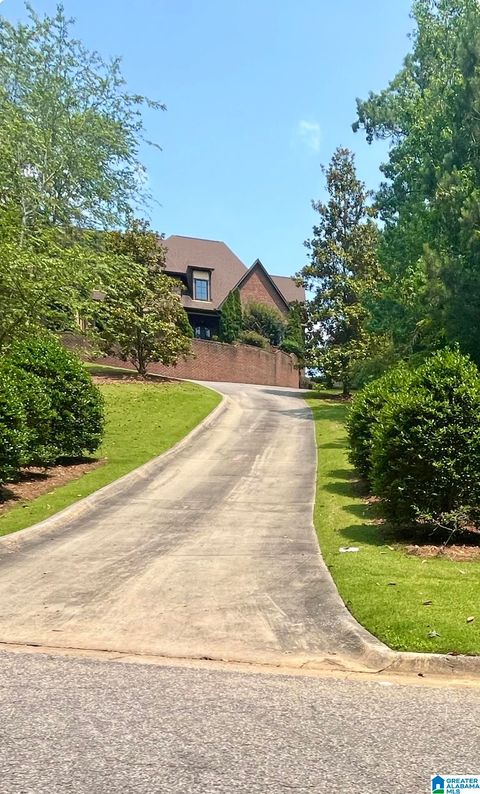
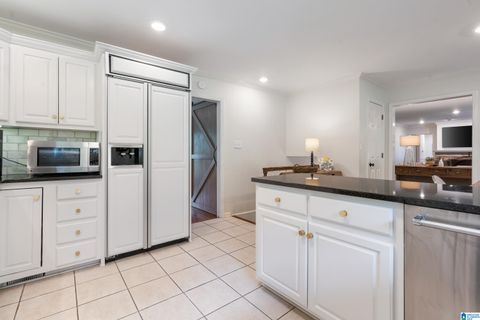
2970 Lake Park Cir, Birmingham, AL 35242
$-156
Cash flow
-2.0%
Cash-on-Cash Return
5.8%
Cap rate
0.7%
Rent to Value Ratio
Active
$559,900
4
bds
|
0
ba
|
3,092
sqft
|
built
1986
3132 Brookhill Dr, Birmingham, AL 35242
$-1,131
Cash flow
-10.5%
Cash-on-Cash Return
3.8%
Cap rate
0.5%
Rent to Value Ratio

Active
$895,000
4
bds
|
0
ba
|
3,329
sqft
|
built
1994
1557 Parkside Ct, Birmingham, AL 35209
$-1,302
Cash flow
-7.6%
Cash-on-Cash Return
4.5%
Cap rate
0.5%
Rent to Value Ratio
Active
$129,900
4
bds
|
0
ba
|
1,308
sqft
|
built
1955
1269 Elm Ave, Birmingham, AL 35217
$219
Cash flow
8.8%
Cash-on-Cash Return
8.3%
Cap rate
1.0%
Rent to Value Ratio
Active
$349,500
1
bds
|
0
ba
|
1,039
sqft
|
built
1910
2327 Morris Ave, Birmingham, AL 35203
$-759
Cash flow
-11.3%
Cash-on-Cash Return
3.7%
Cap rate
0.5%
Rent to Value Ratio
Pending
$39,900
4
bds
|
0
ba
|
1,632
sqft
|
built
1940
1449 21st St N, Birmingham, AL 35234
$897
Cash flow
26.2%
Cash-on-Cash Return
27.0%
Cap rate
3.3%
Rent to Value Ratio

Active
$399,900
3
bds
|
0
ba
|
1,392
sqft
|
built
1961
969 Oak Grove Rd, Birmingham, AL 35209
$-363
Cash flow
-4.7%
Cash-on-Cash Return
5.2%
Cap rate
0.6%
Rent to Value Ratio
Active
$269,500
3
bds
|
0
ba
|
1,447
sqft
|
built
1991
2019 Russet Meadows Ct, Birmingham, AL 35244
$-34
Cash flow
-0.7%
Cash-on-Cash Return
6.1%
Cap rate
0.7%
Rent to Value Ratio
Active
$110,500
4
bds
|
0
ba
|
1,552
sqft
|
built
1920
4725 Court R, Birmingham, AL 35208
$251
Cash flow
11.9%
Cash-on-Cash Return
9.0%
Cap rate
1.1%
Rent to Value Ratio
Active
$119,000
3
bds
|
0
ba
|
1,655
sqft
|
built
1938
1632 43rd Street Ensley, Birmingham, AL 35208
$276
Cash flow
12.1%
Cash-on-Cash Return
9.0%
Cap rate
1.1%
Rent to Value Ratio
Active
$95,000
2
bds
|
0
ba
|
1,024
sqft
|
built
1953
1508 Short St, Birmingham, AL 35228
$194
Cash flow
10.7%
Cash-on-Cash Return
8.7%
Cap rate
1.1%
Rent to Value Ratio
Active
$135,000
3
bds
|
0
ba
|
1,176
sqft
|
built
1920
805 78th St S, Birmingham, AL 35206
$261
Cash flow
10.1%
Cash-on-Cash Return
8.6%
Cap rate
1.0%
Rent to Value Ratio
Active
$1,750,000
7
bds
|
0
ba
|
7,763
sqft
|
built
2007
180 Highland View Dr, Birmingham, AL 35242
$-5,617
Cash flow
-16.7%
Cash-on-Cash Return
2.4%
Cap rate
0.3%
Rent to Value Ratio
Pending
$849,900
5
bds
|
0
ba
|
3,895
sqft
|
built
1959
140 Woodmont Dr, Birmingham, AL 35209
$-1,677
Cash flow
-10.3%
Cash-on-Cash Return
3.9%
Cap rate
0.5%
Rent to Value Ratio
Active
$525,000
3
bds
|
0
ba
|
2,755
sqft
|
built
1996
2300 Ridge Trl, Birmingham, AL 35242
$-562
Cash flow
-5.6%
Cash-on-Cash Return
5.0%
Cap rate
0.6%
Rent to Value Ratio
Active
$318,000
3
bds
|
0
ba
|
1,048
sqft
|
built
1935
4808 3rd Ave S, Birmingham, AL 35222
$-556
Cash flow
-9.1%
Cash-on-Cash Return
4.2%
Cap rate
0.5%
Rent to Value Ratio

Active
$199,000
3
bds
|
0
ba
|
1,516
sqft
|
built
1959
409 Burgundy Rd, Birmingham, AL 35215
$-73
Cash flow
-1.9%
Cash-on-Cash Return
5.8%
Cap rate
0.7%
Rent to Value Ratio
Pending
$21,000
4
bds
|
0
ba
|
1,392
sqft
|
built
1945
1211 22nd Ave N, Birmingham, AL 35204
$828
Cash flow
45.9%
Cash-on-Cash Return
47.3%
Cap rate
5.7%
Rent to Value Ratio
Active under contract
$49,000
3
bds
|
0
ba
|
3,080
sqft
|
built
1930
2623 Avenue J, Birmingham, AL 35218
$828
Cash flow
19.7%
Cash-on-Cash Return
20.3%
Cap rate
2.4%
Rent to Value Ratio
Active
$144,900
3
bds
|
0
ba
|
1,608
sqft
|
built
1947
516 85th St S, Birmingham, AL 35206
$486
Cash flow
17.5%
Cash-on-Cash Return
10.3%
Cap rate
1.2%
Rent to Value Ratio
Active under contract
$116,000
3
bds
|
0
ba
|
1,202
sqft
|
built
1930
7300 3rd Ave N, Birmingham, AL 35206
$84
Cash flow
3.8%
Cash-on-Cash Return
7.1%
Cap rate
0.9%
Rent to Value Ratio
Active
$90,000
3
bds
|
0
ba
|
1,481
sqft
|
built
1927
1809 Saint Charles Ct SW, Birmingham, AL 35211
$358
Cash flow
20.8%
Cash-on-Cash Return
11.0%
Cap rate
1.3%
Rent to Value Ratio