Birmingham, AL Investment Properties for Sale
Browse homes for sale and investment properties in Birmingham, AL. Refine your search by price, property type, or more.
Best cash flowing properties in Birmingham, AL
Active
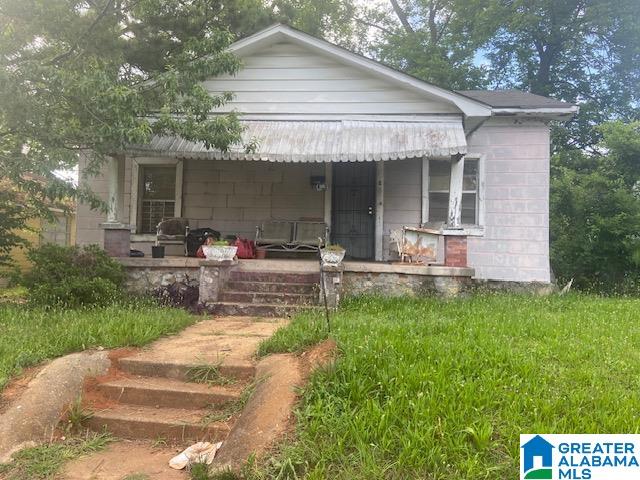
$36,000
3
bds
|
0
ba
|
1,368
sqft
|
built
1940
2308 17th Street Ensley, Birmingham, AL 35208
$897
Cash flow
29.0%
Cash-on-Cash Return
29.9%
Cap rate
3.6%
Rent to Value Ratio
Active
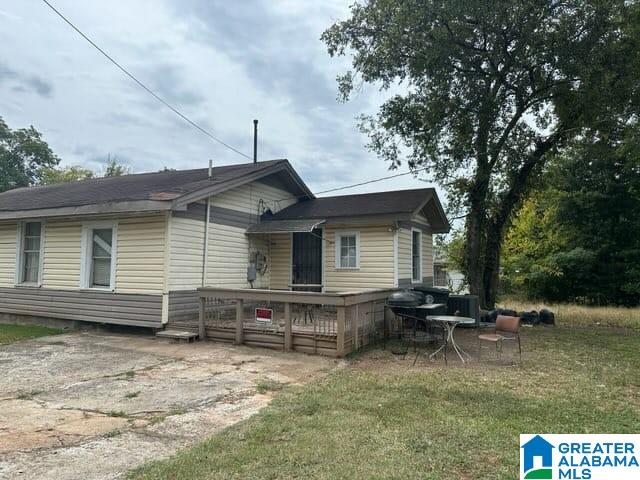
$45,000
3
bds
|
0
ba
|
1,068
sqft
|
built
1945
2100 Dawson Ave SW, Birmingham, AL 35211
$828
Cash flow
21.4%
Cash-on-Cash Return
22.1%
Cap rate
2.7%
Rent to Value Ratio
915 out of 1,030 properties for sale in Birmingham, AL
Limited Results Shown
Create a free account, or log in to reveal all property listings and enjoy the complete experience.
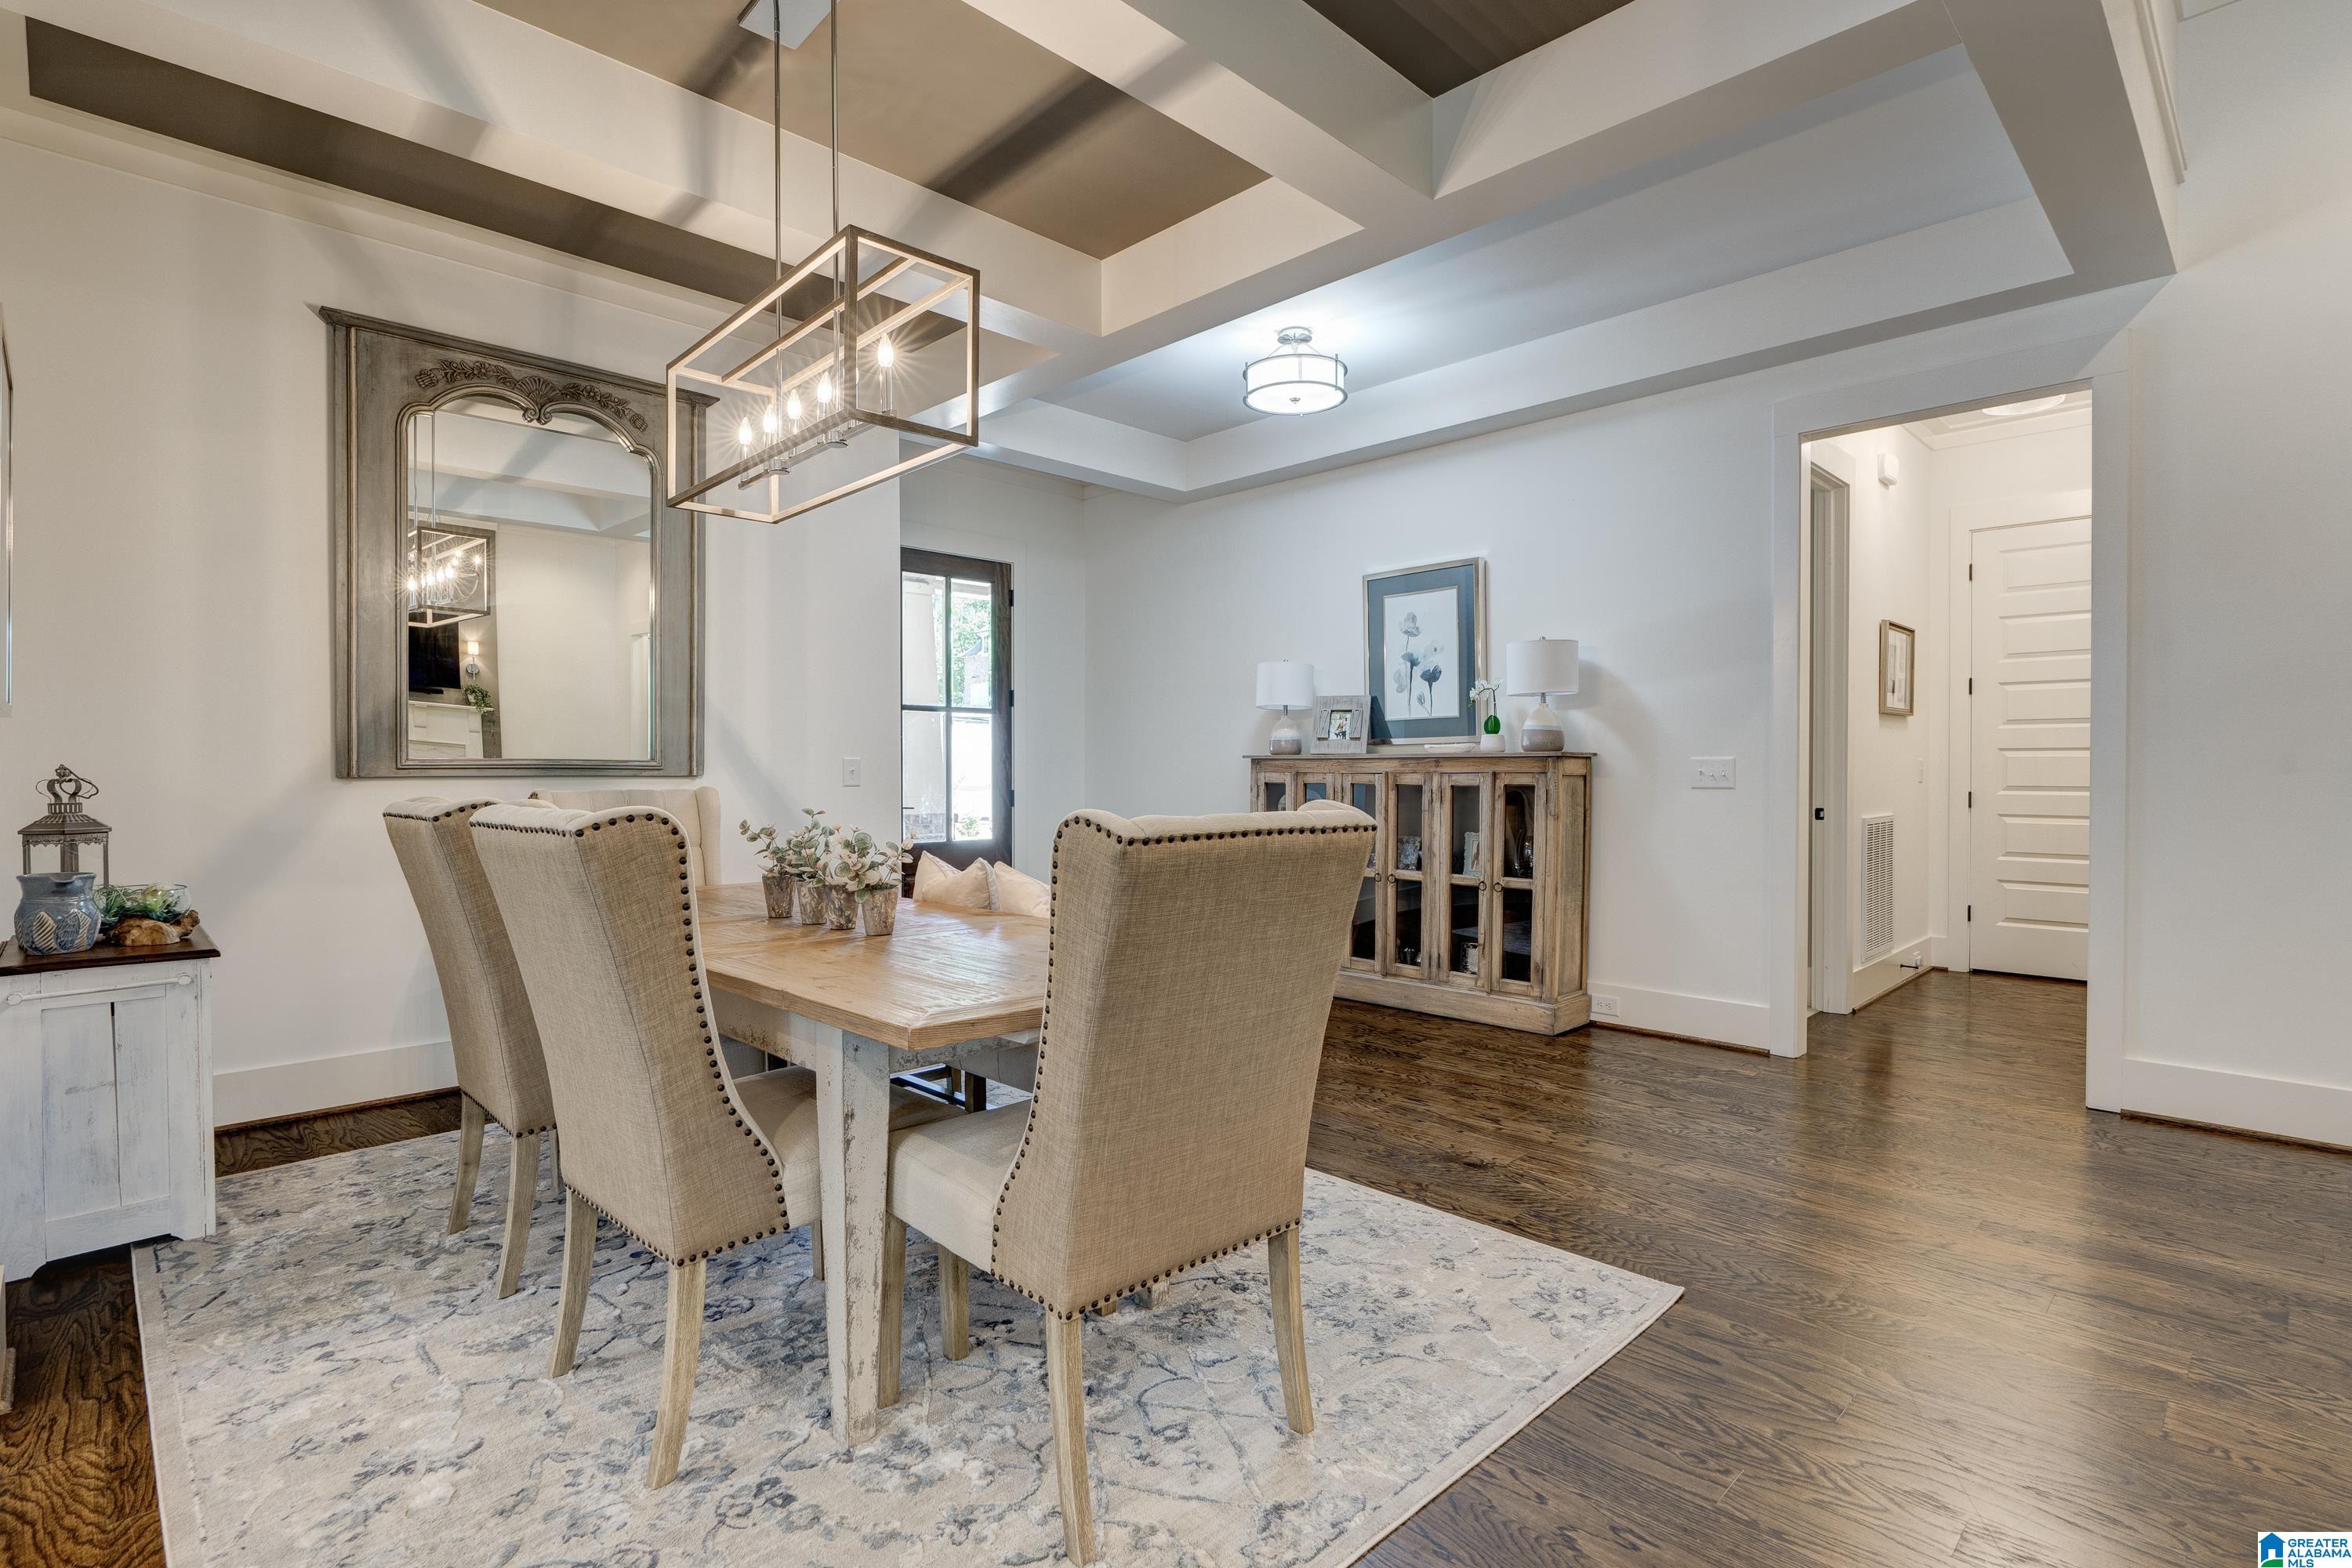
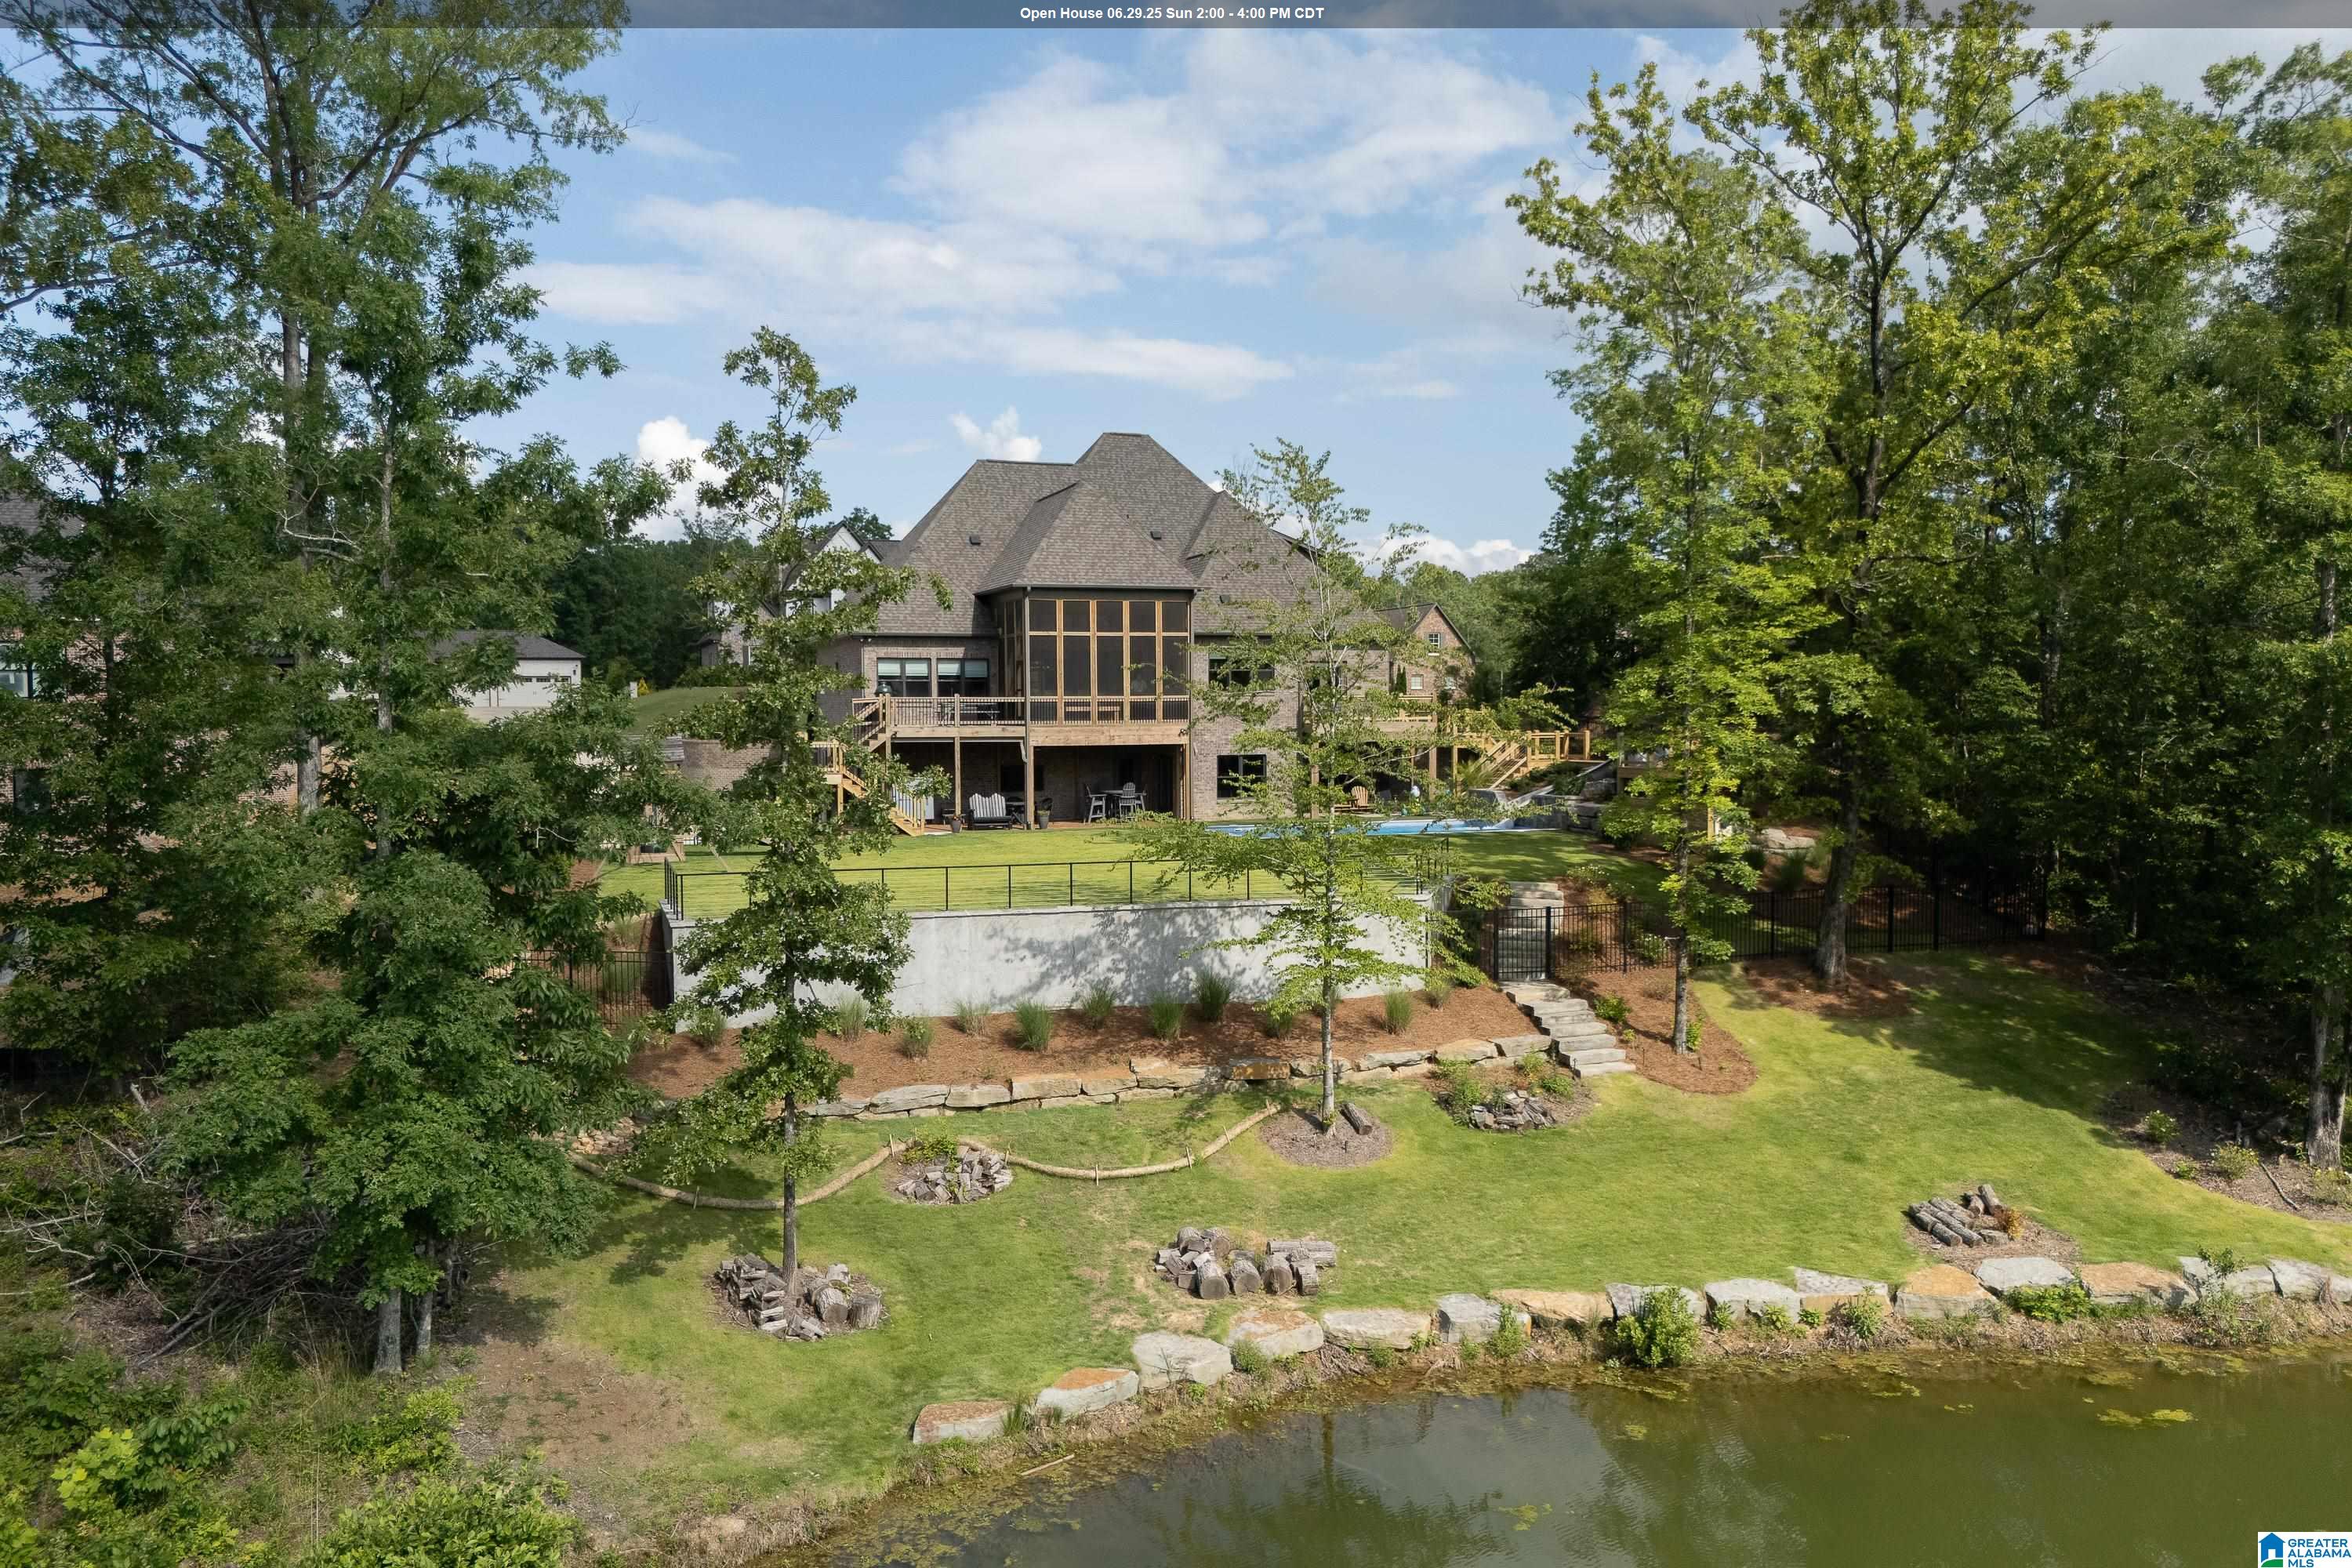
Active
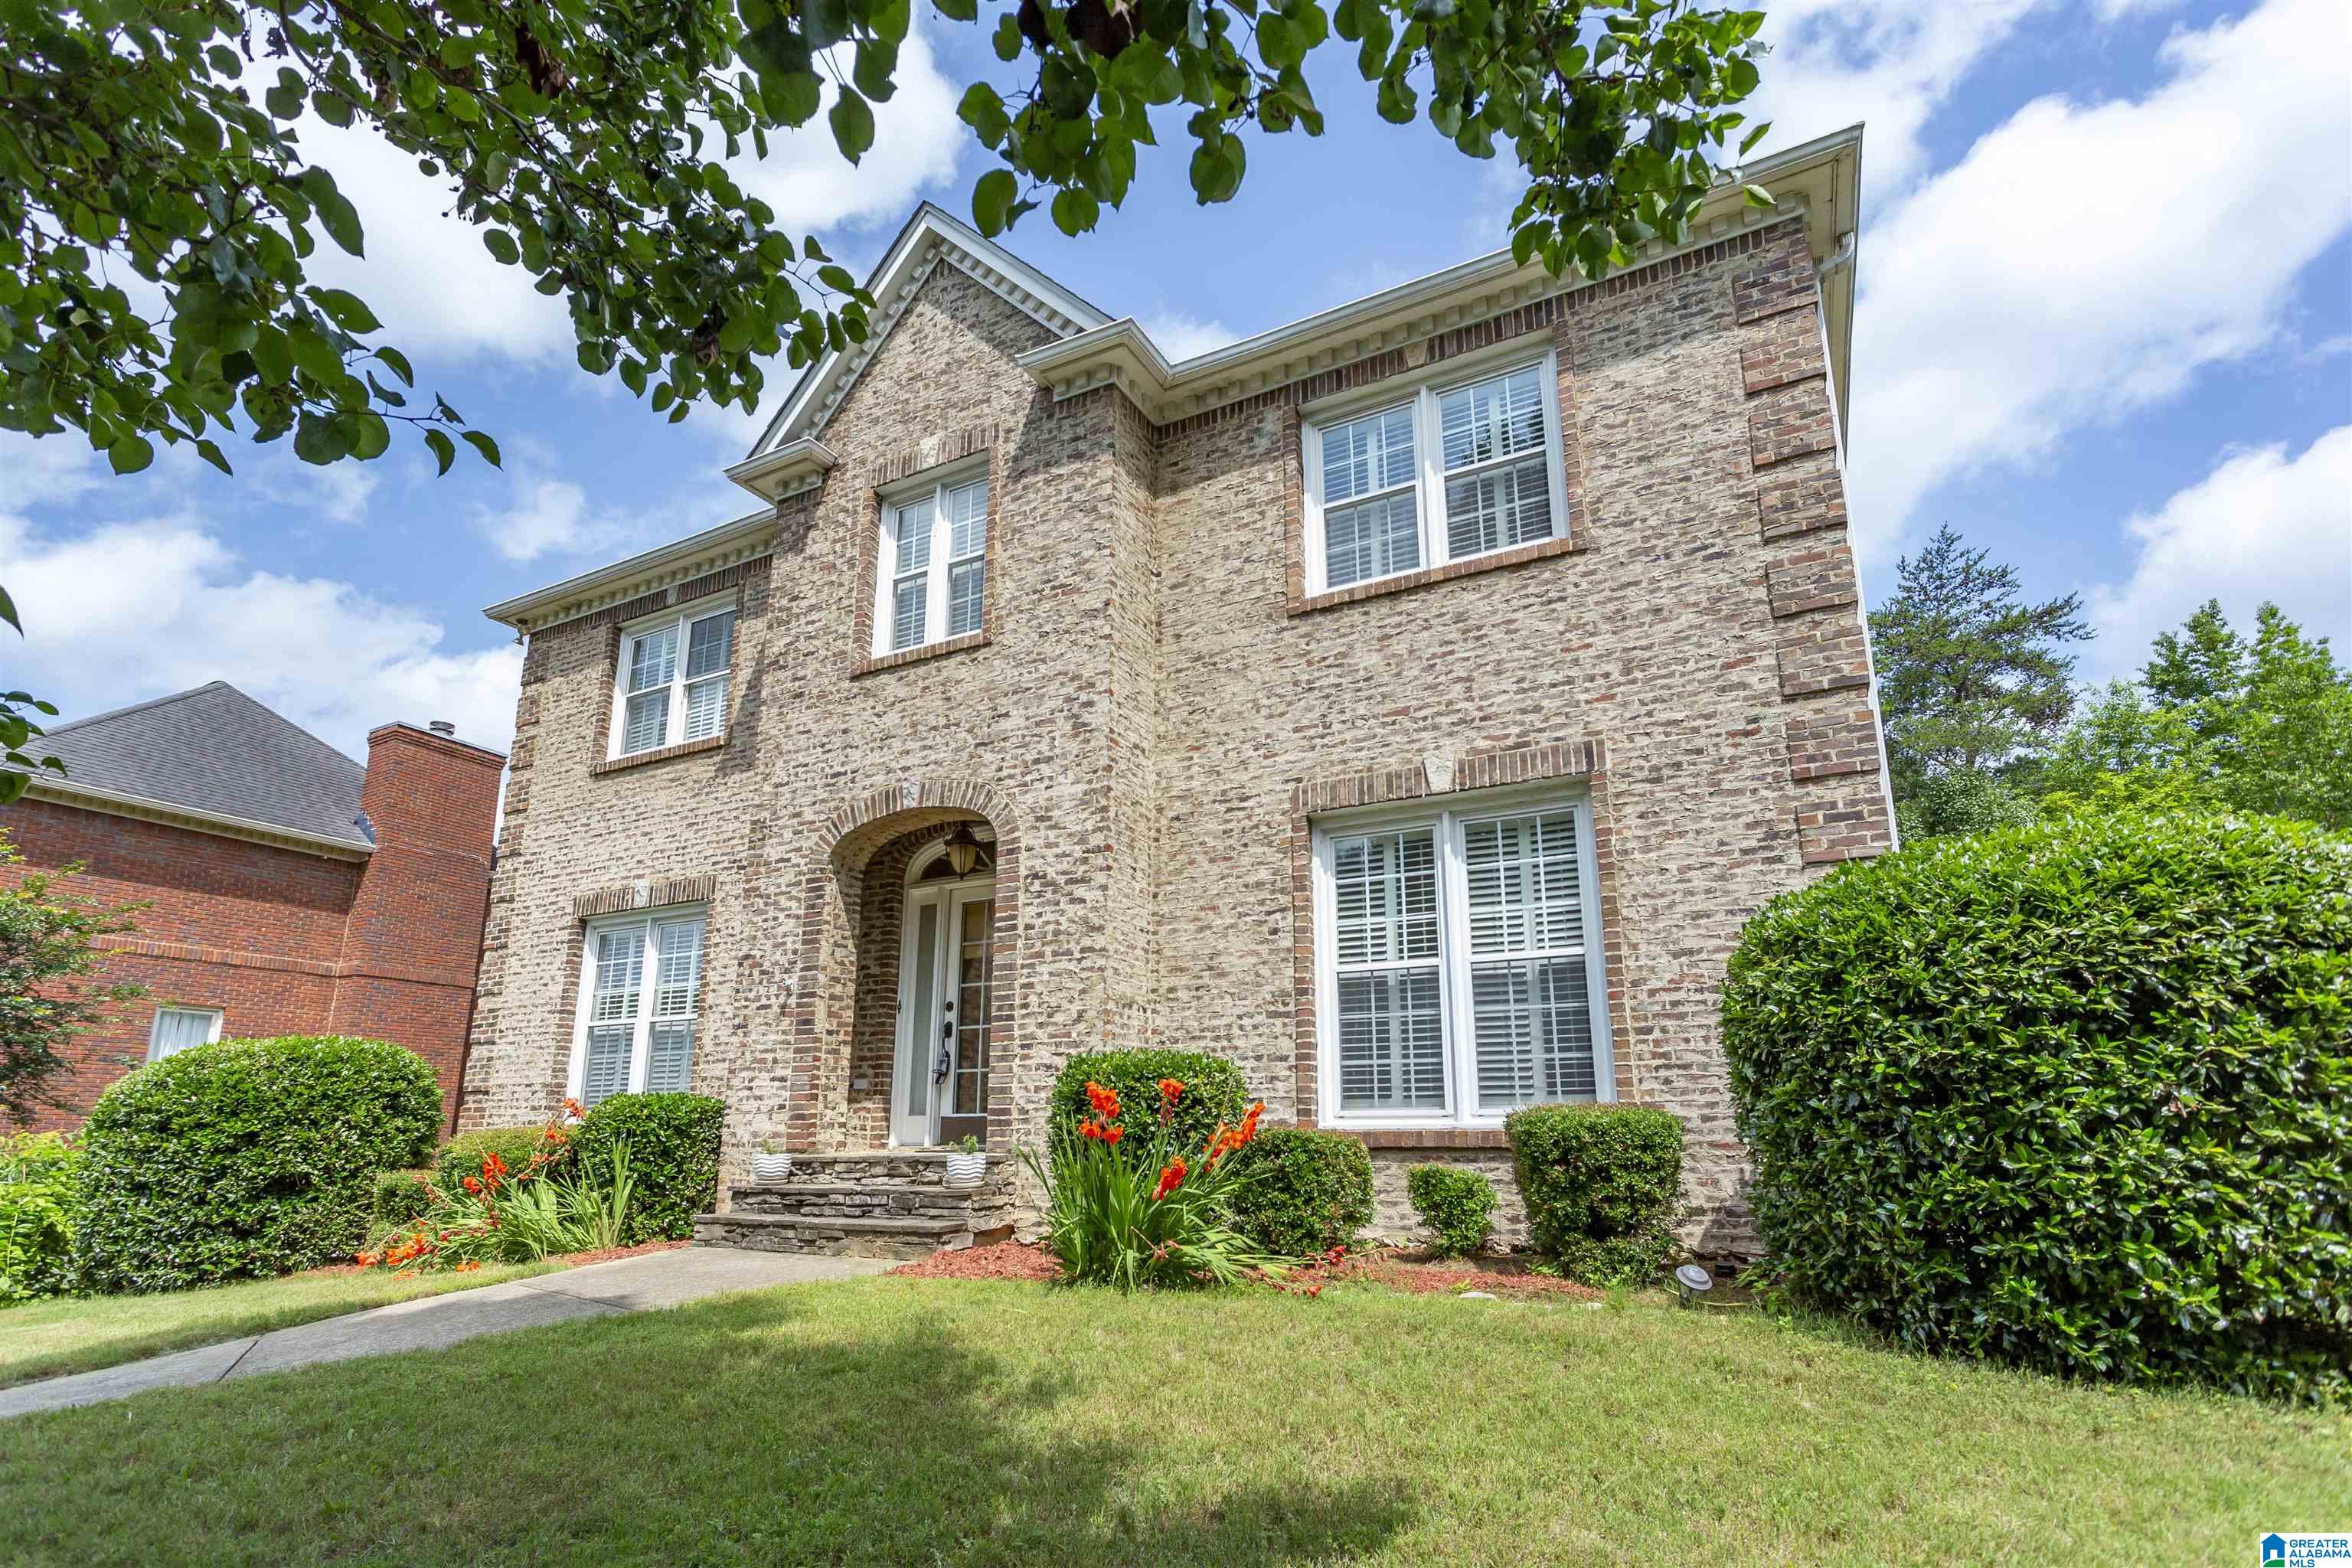
$1,275,000
6
bds
|
0
ba
|
5,706
sqft
|
built
2018
121 Elyton Dr, Birmingham, AL 35242
$-2,640
Cash flow
-10.8%
Cash-on-Cash Return
3.2%
Cap rate
0.4%
Rent to Value Ratio
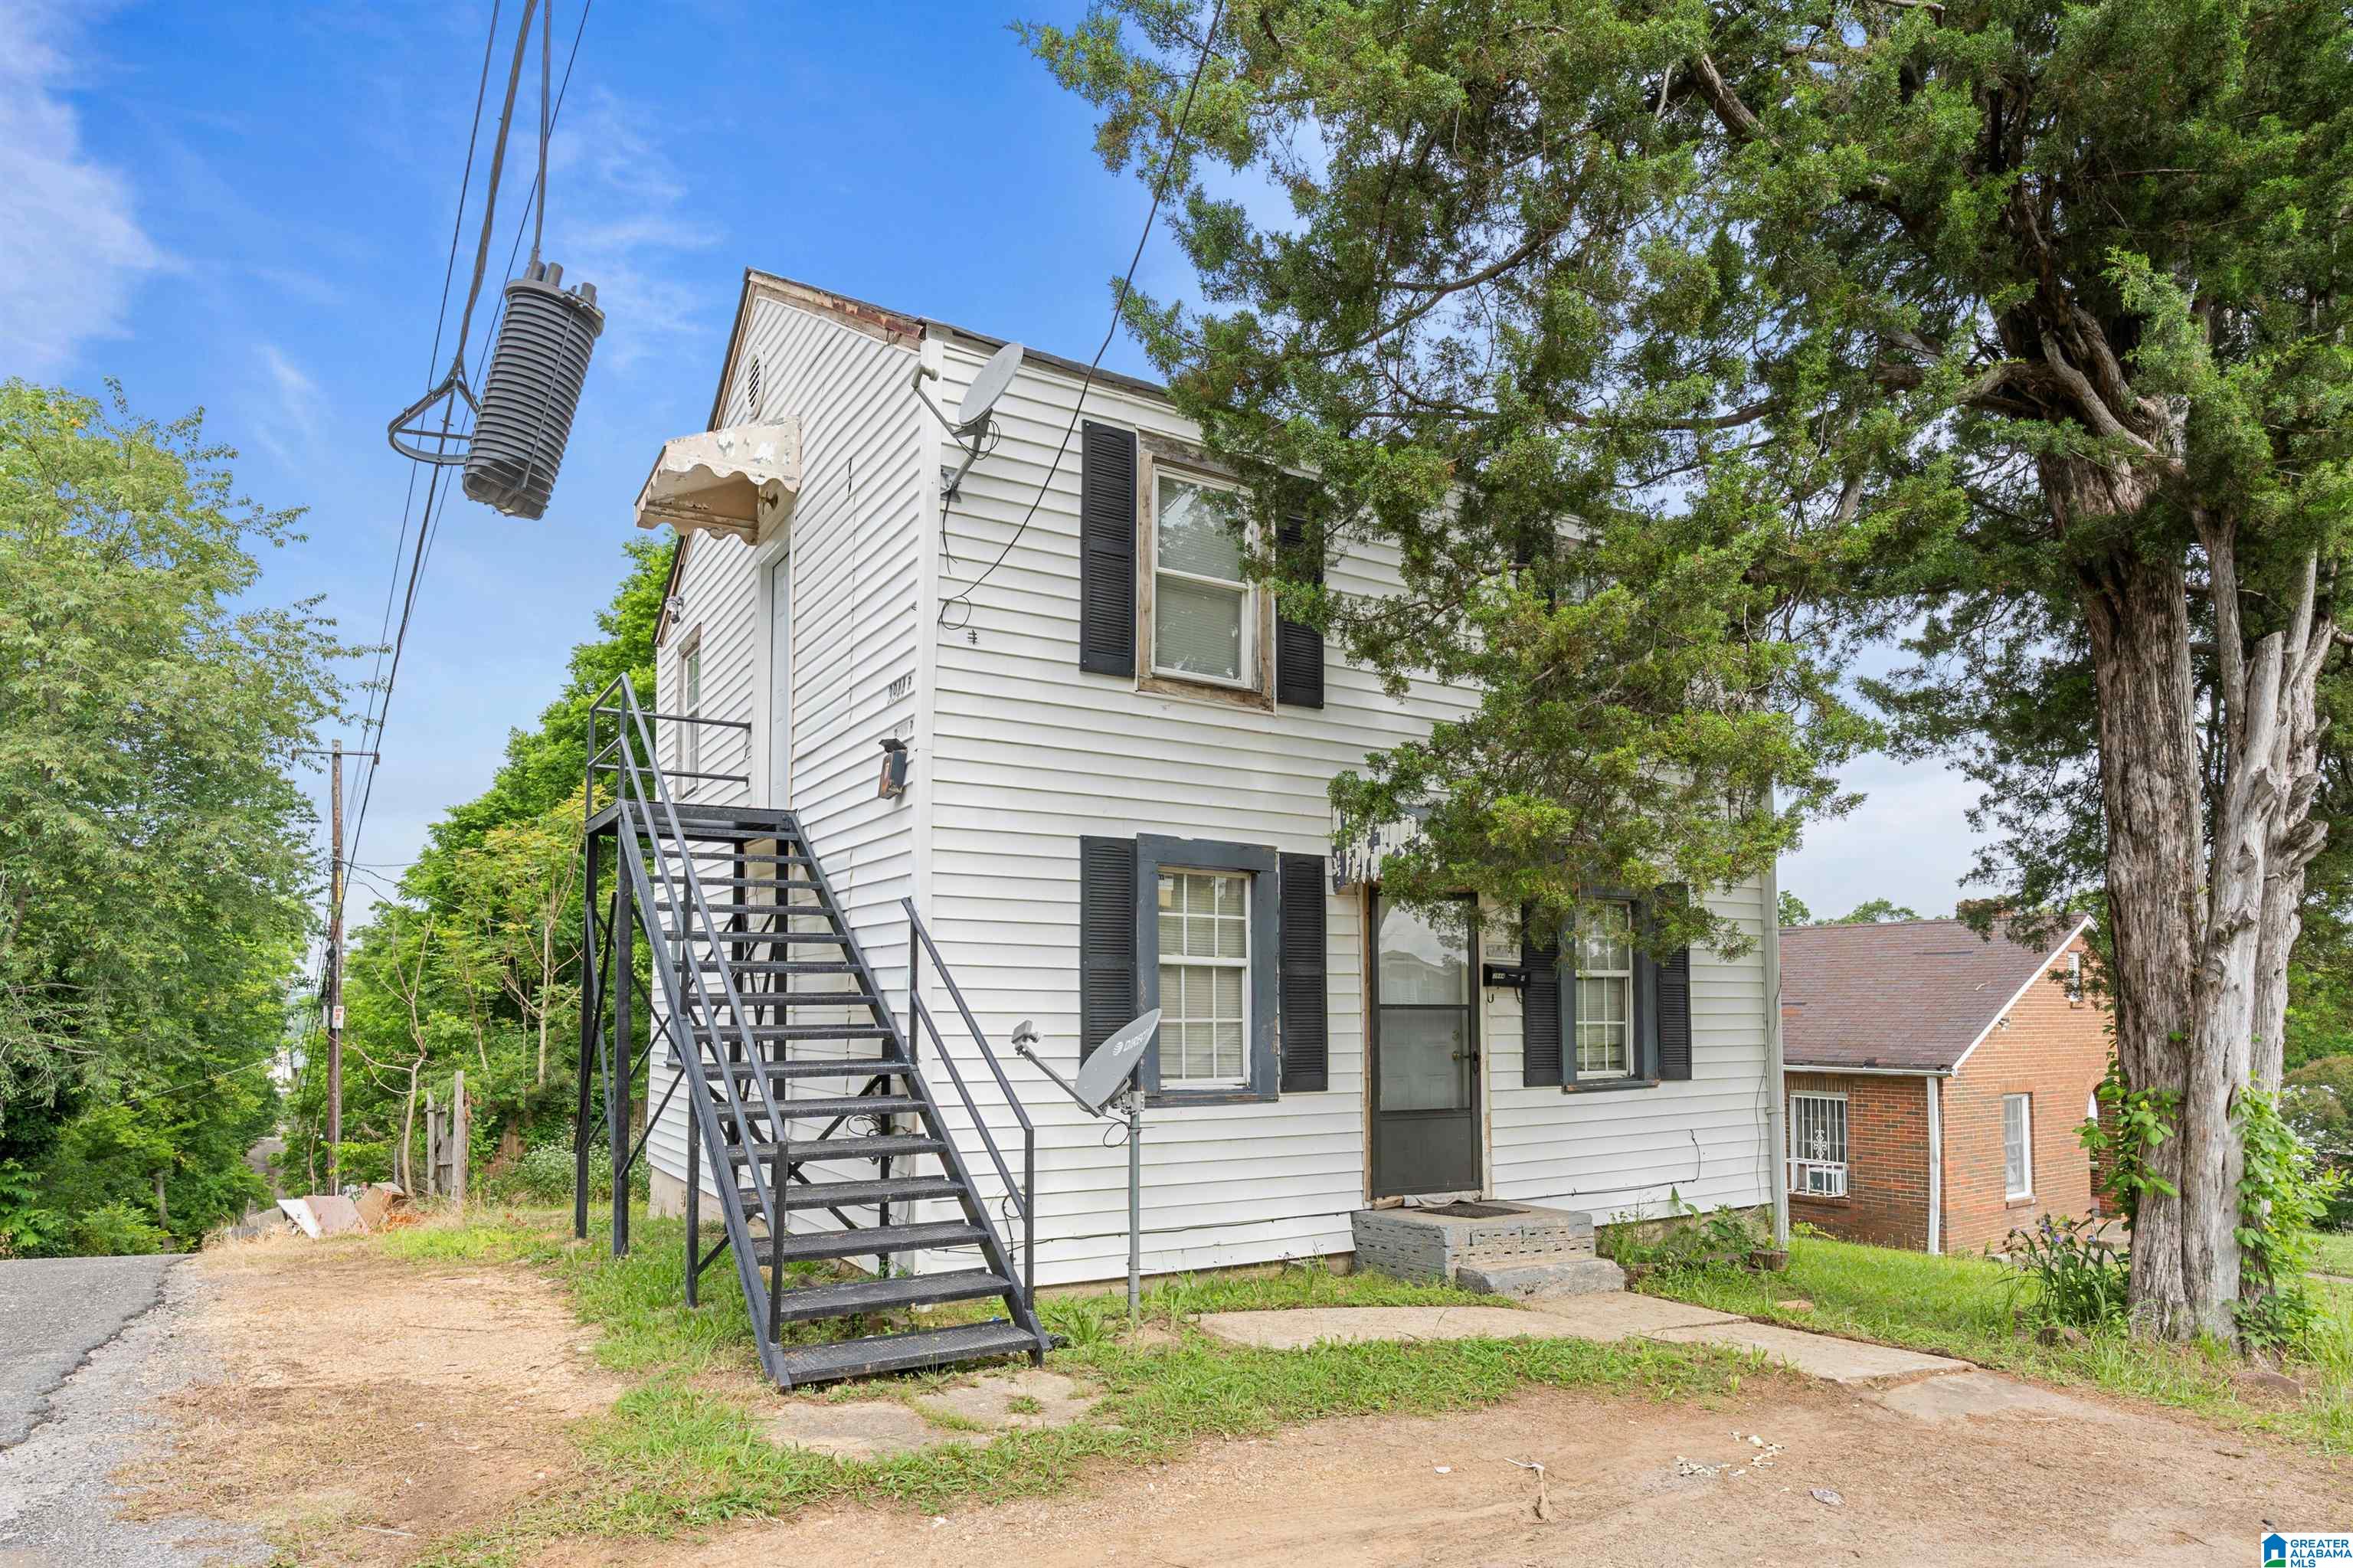
Pending
$104,900
4
bds
|
0
ba
|
0
sqft
|
built
1939
3944 40th St N, Birmingham, AL 35217
$263
Cash flow
13.1%
Cash-on-Cash Return
8.7%
Cap rate
1.0%
Rent to Value Ratio
Active
$159,900
3
bds
|
0
ba
|
1,836
sqft
|
built
1950
2436 Thomas St, Birmingham, AL 35217
$347
Cash flow
11.3%
Cash-on-Cash Return
8.3%
Cap rate
1.0%
Rent to Value Ratio
Active
$169,000
3
bds
|
0
ba
|
1,918
sqft
|
built
1958
233 Walker Rd, Birmingham, AL 35214
$442
Cash flow
13.6%
Cash-on-Cash Return
8.8%
Cap rate
1.1%
Rent to Value Ratio
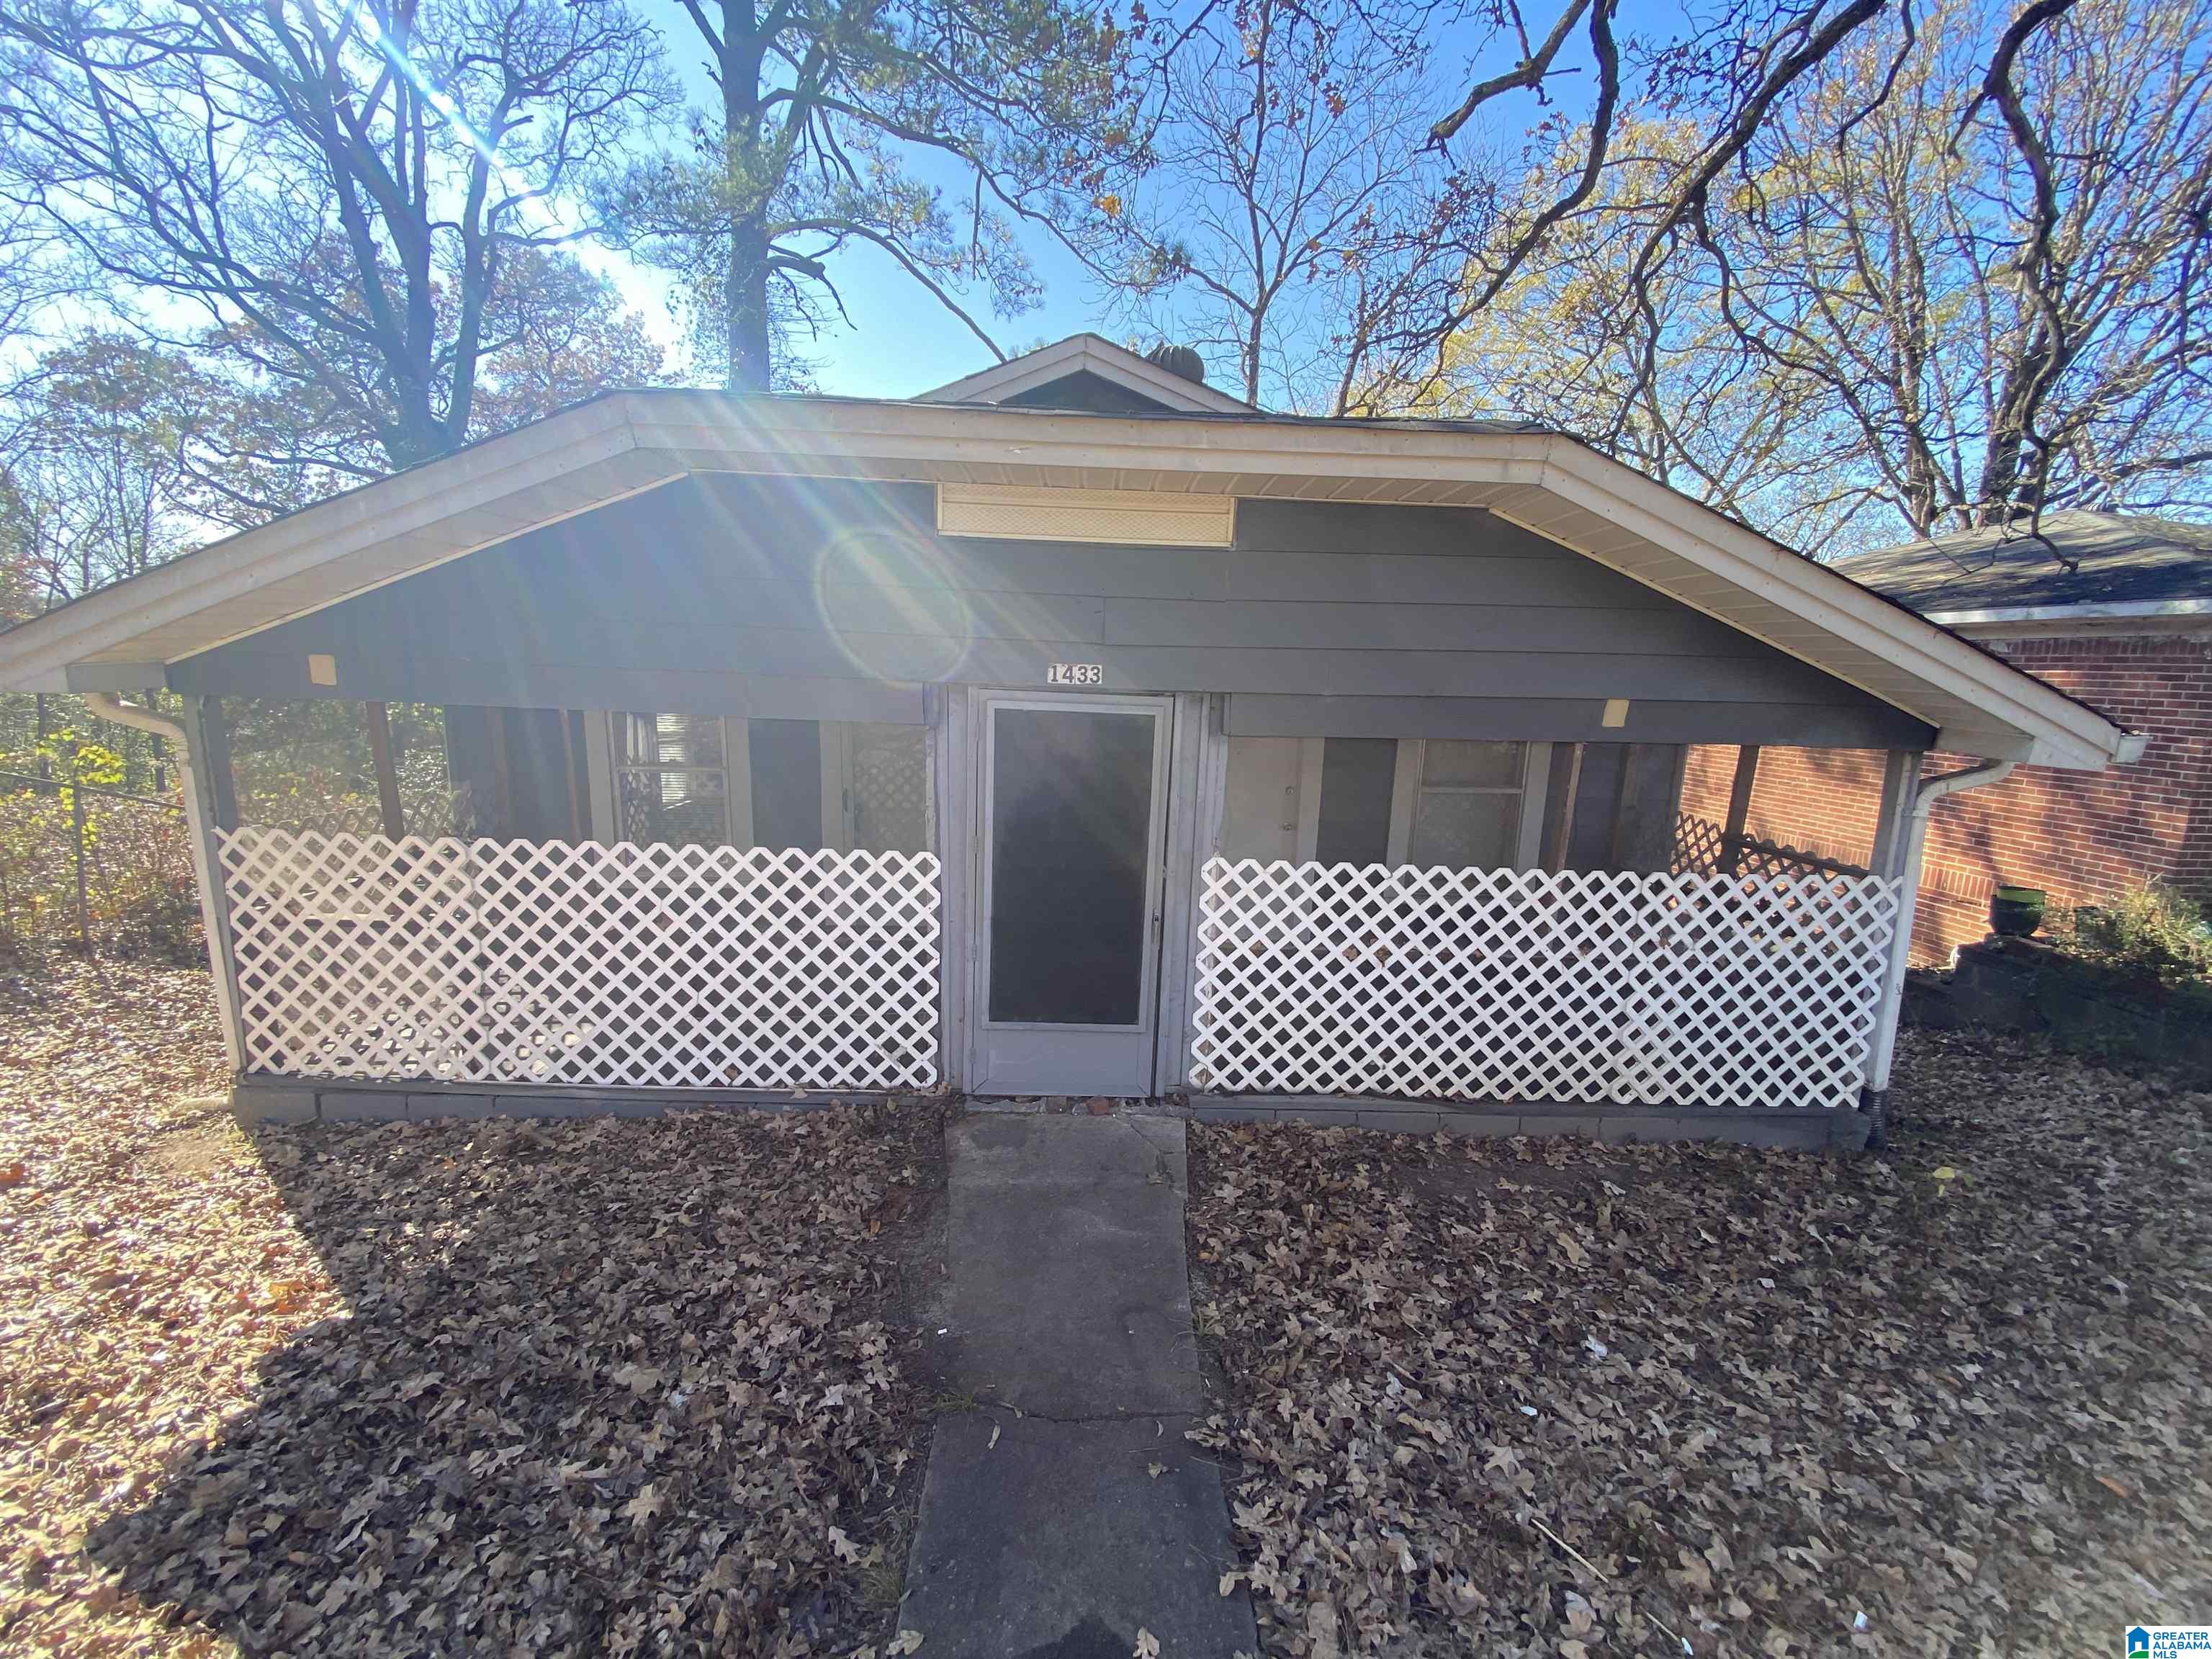
Active
$96,000
3
bds
|
0
ba
|
1,372
sqft
|
built
1930
1433 Ford Ave, Birmingham, AL 35217
$374
Cash flow
20.3%
Cash-on-Cash Return
10.4%
Cap rate
1.3%
Rent to Value Ratio
Active
$69,000
2
bds
|
0
ba
|
0
sqft
|
built
1957
1125 Thomason Ave, Birmingham, AL 35217
$690
Cash flow
11.7%
Cash-on-Cash Return
12.0%
Cap rate
1.4%
Rent to Value Ratio
Pending
$445,000
3
bds
|
0
ba
|
1,385
sqft
|
built
1958
4232 Warren Rd, Birmingham, AL 35213
$33
Cash flow
0.4%
Cash-on-Cash Return
5.8%
Cap rate
0.7%
Rent to Value Ratio
Active under contract
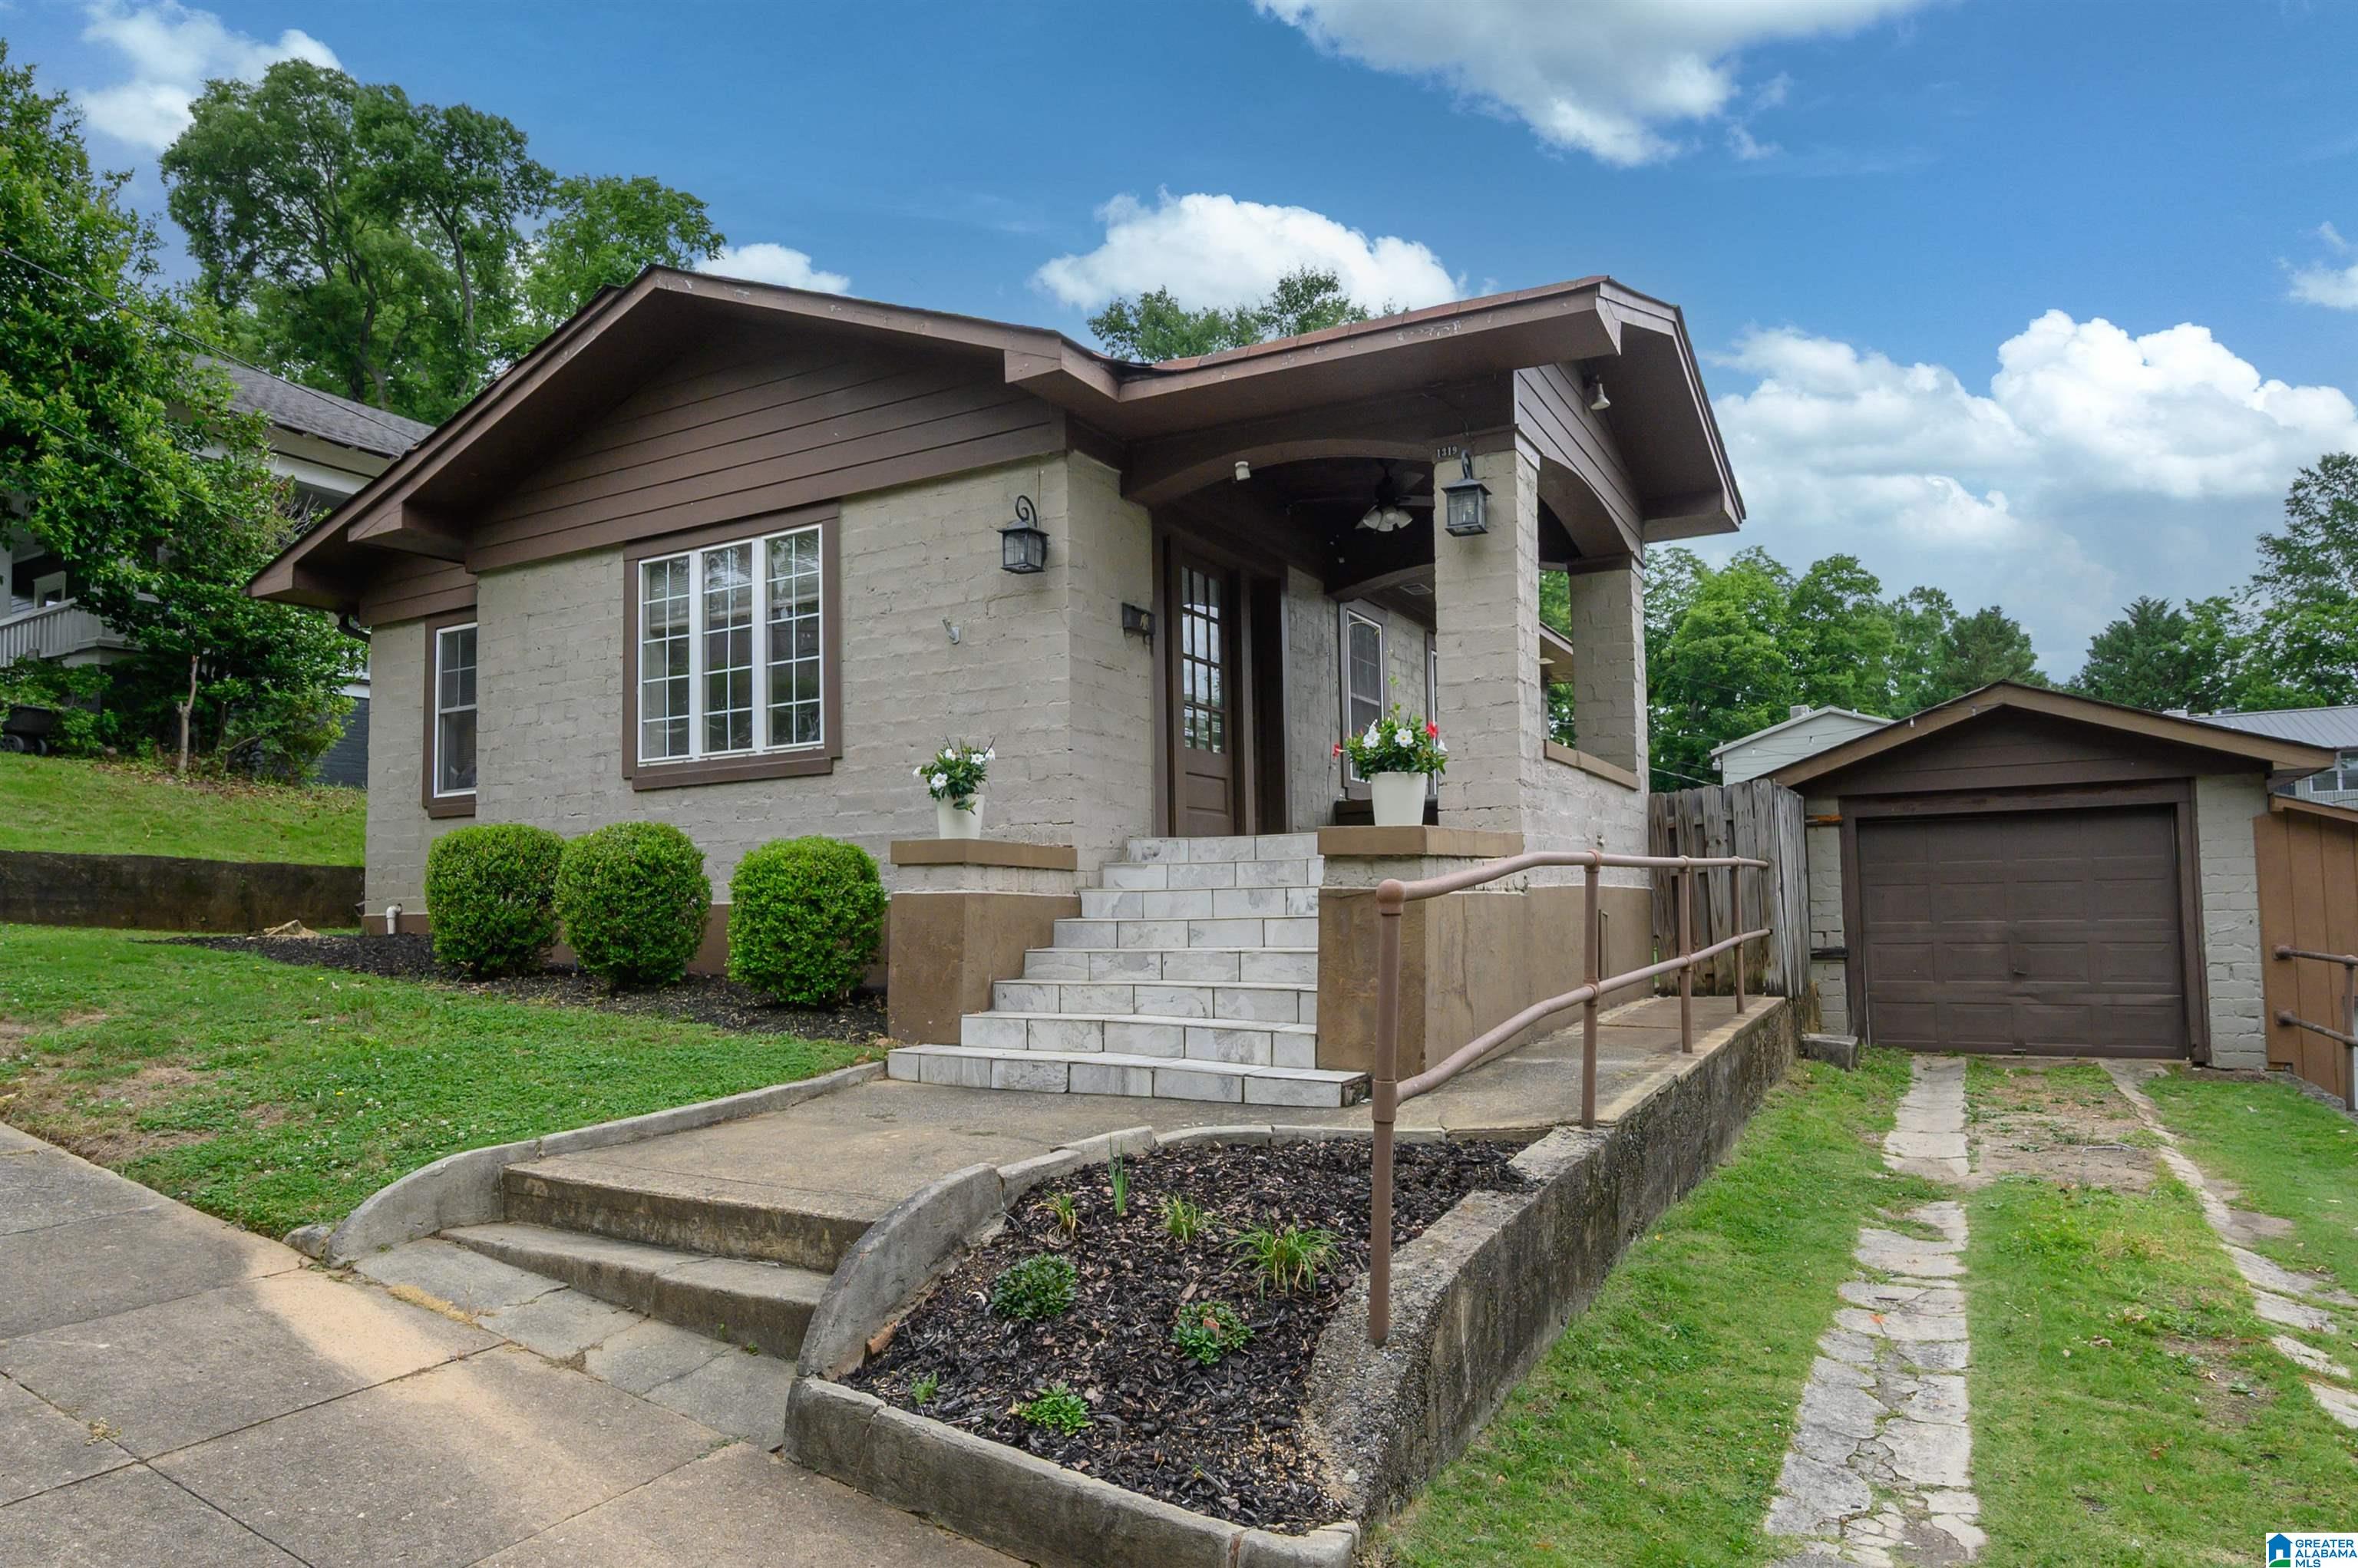
$229,900
2
bds
|
0
ba
|
915
sqft
|
built
1915
1319 17th St S, Birmingham, AL 35205
$154
Cash flow
3.5%
Cash-on-Cash Return
6.5%
Cap rate
0.8%
Rent to Value Ratio
Active
$99,000
2
bds
|
0
ba
|
826
sqft
|
built
1900
527 Lexington St, Birmingham, AL 35224
$221
Cash flow
11.6%
Cash-on-Cash Return
8.4%
Cap rate
1.0%
Rent to Value Ratio
Active under contract
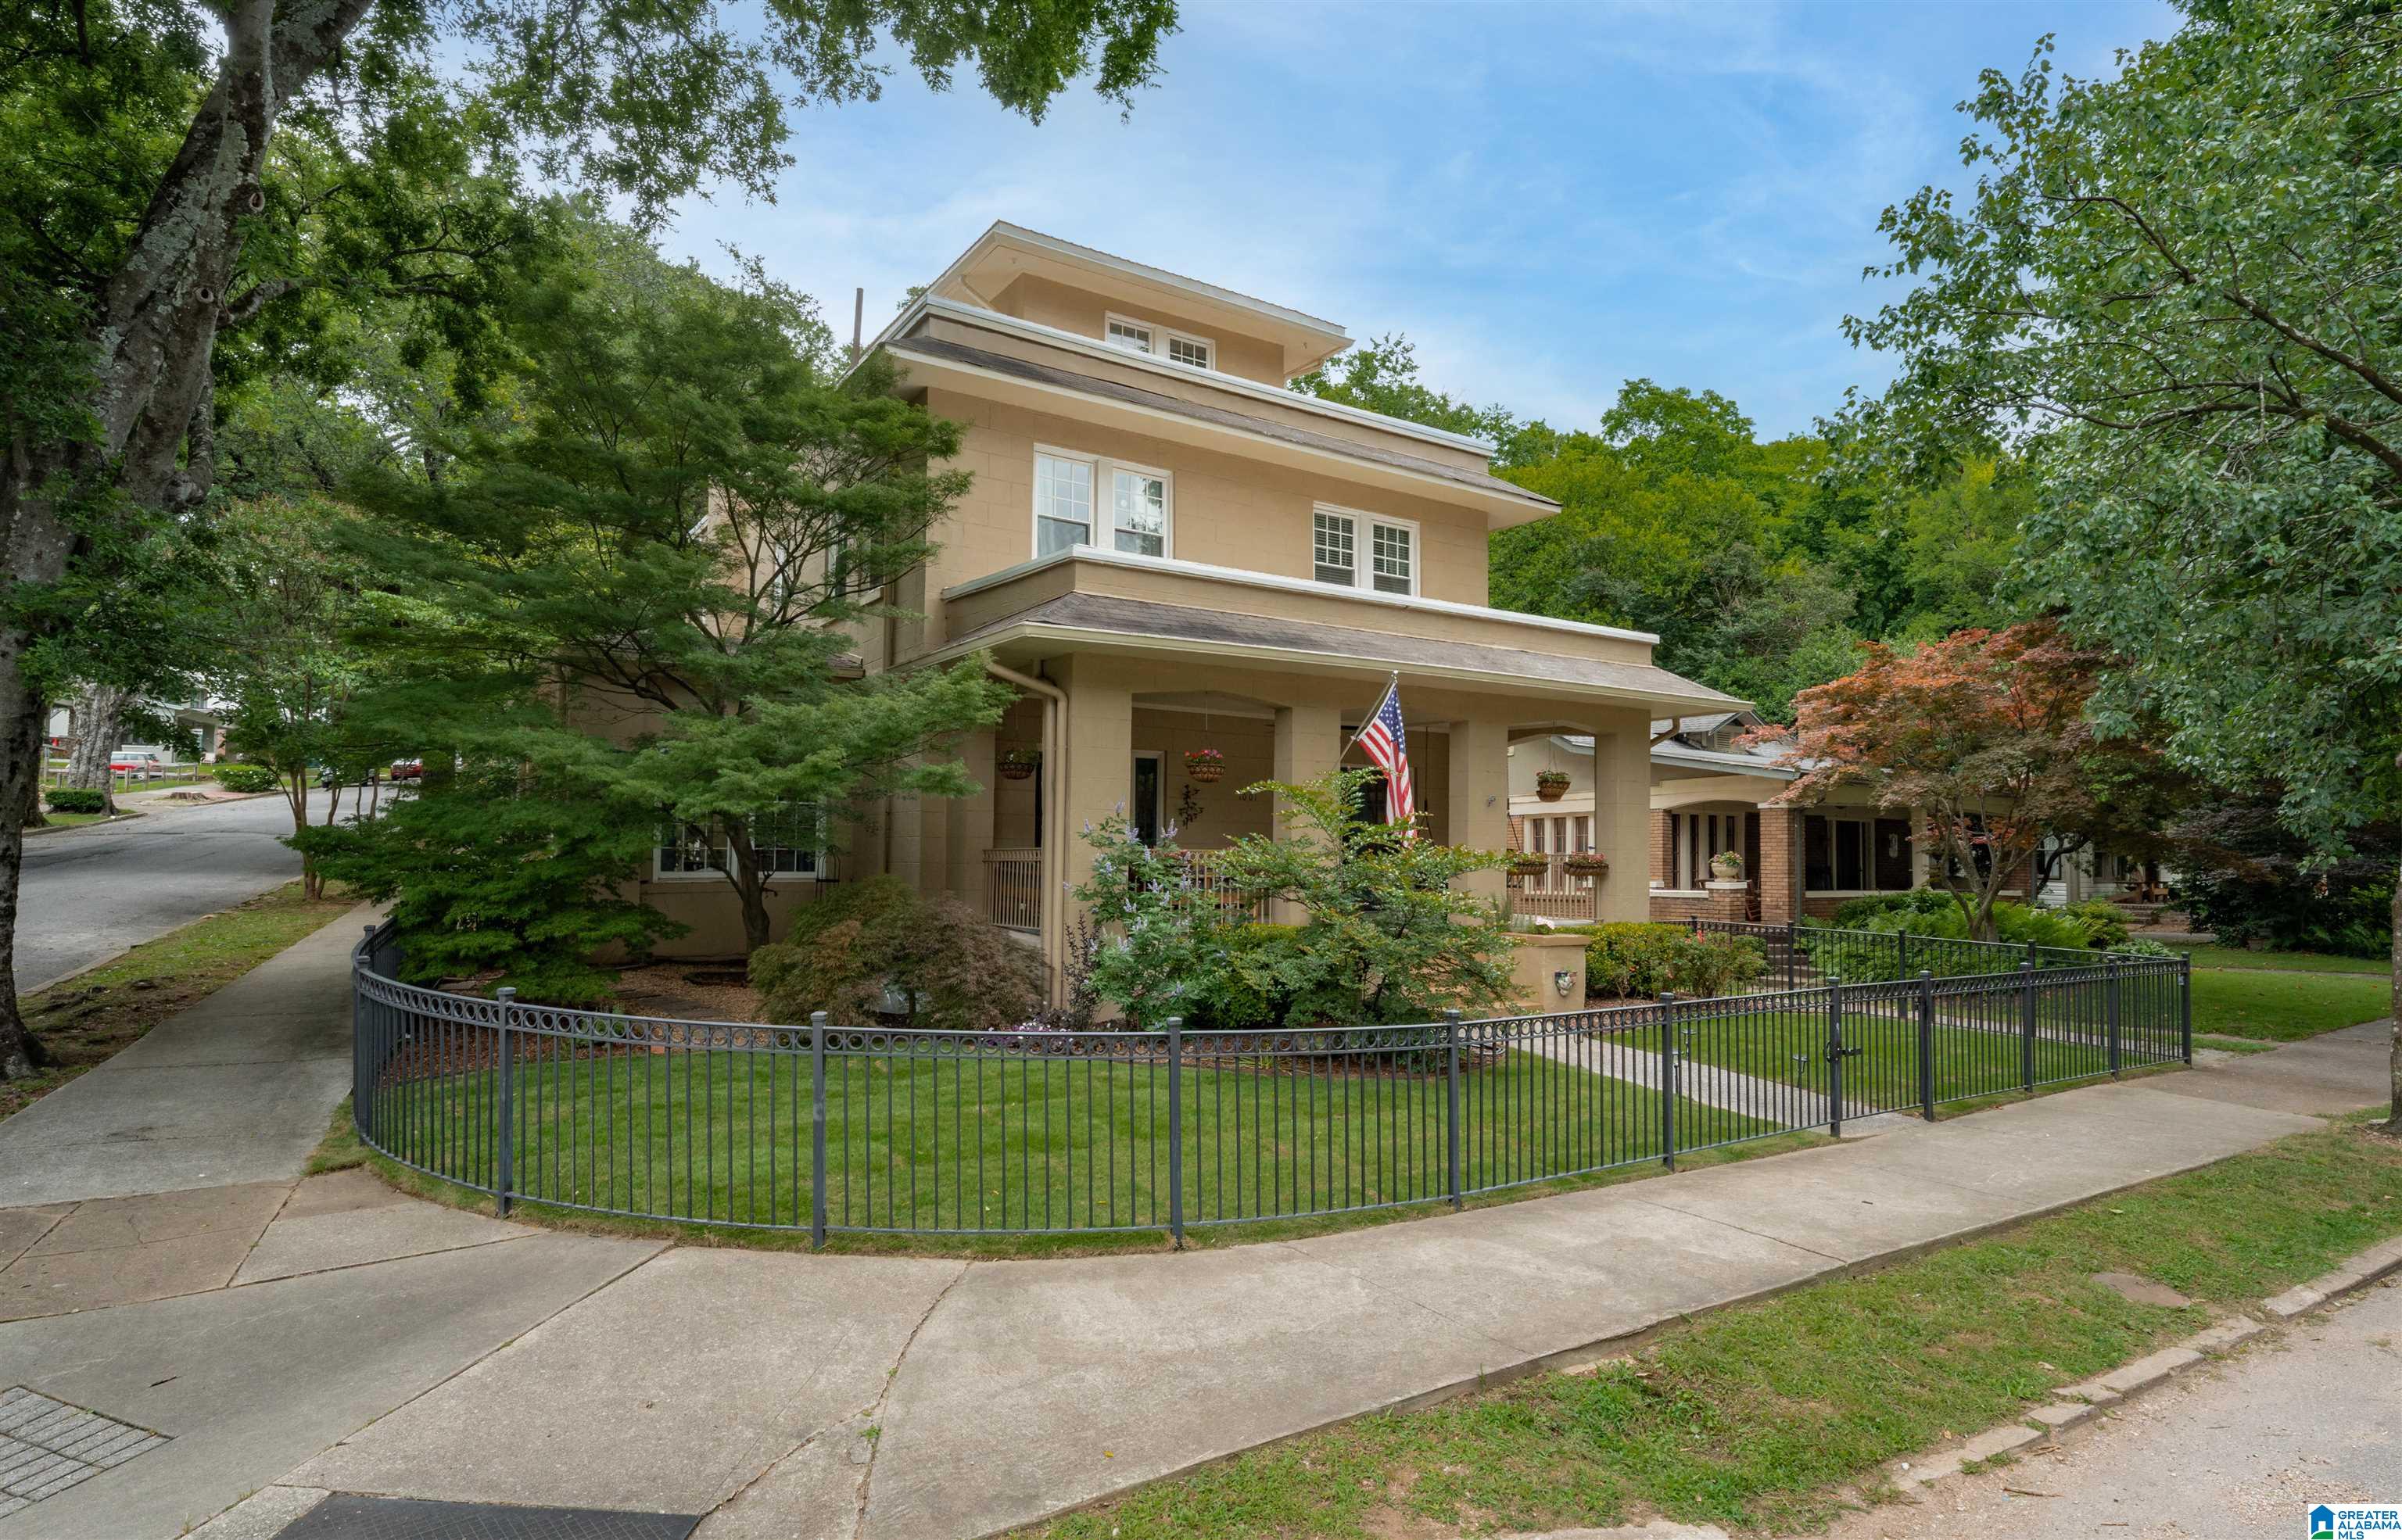
$699,900
4
bds
|
0
ba
|
3,385
sqft
|
built
1915
1001 31st St S, Birmingham, AL 35205
$-828
Cash flow
-6.2%
Cash-on-Cash Return
4.3%
Cap rate
0.5%
Rent to Value Ratio
Pending
$415,000
2
bds
|
0
ba
|
1,701
sqft
|
built
1925
4212 10th Ave S, Birmingham, AL 35222
$-239
Cash flow
-3.0%
Cash-on-Cash Return
5.0%
Cap rate
0.6%
Rent to Value Ratio
Active
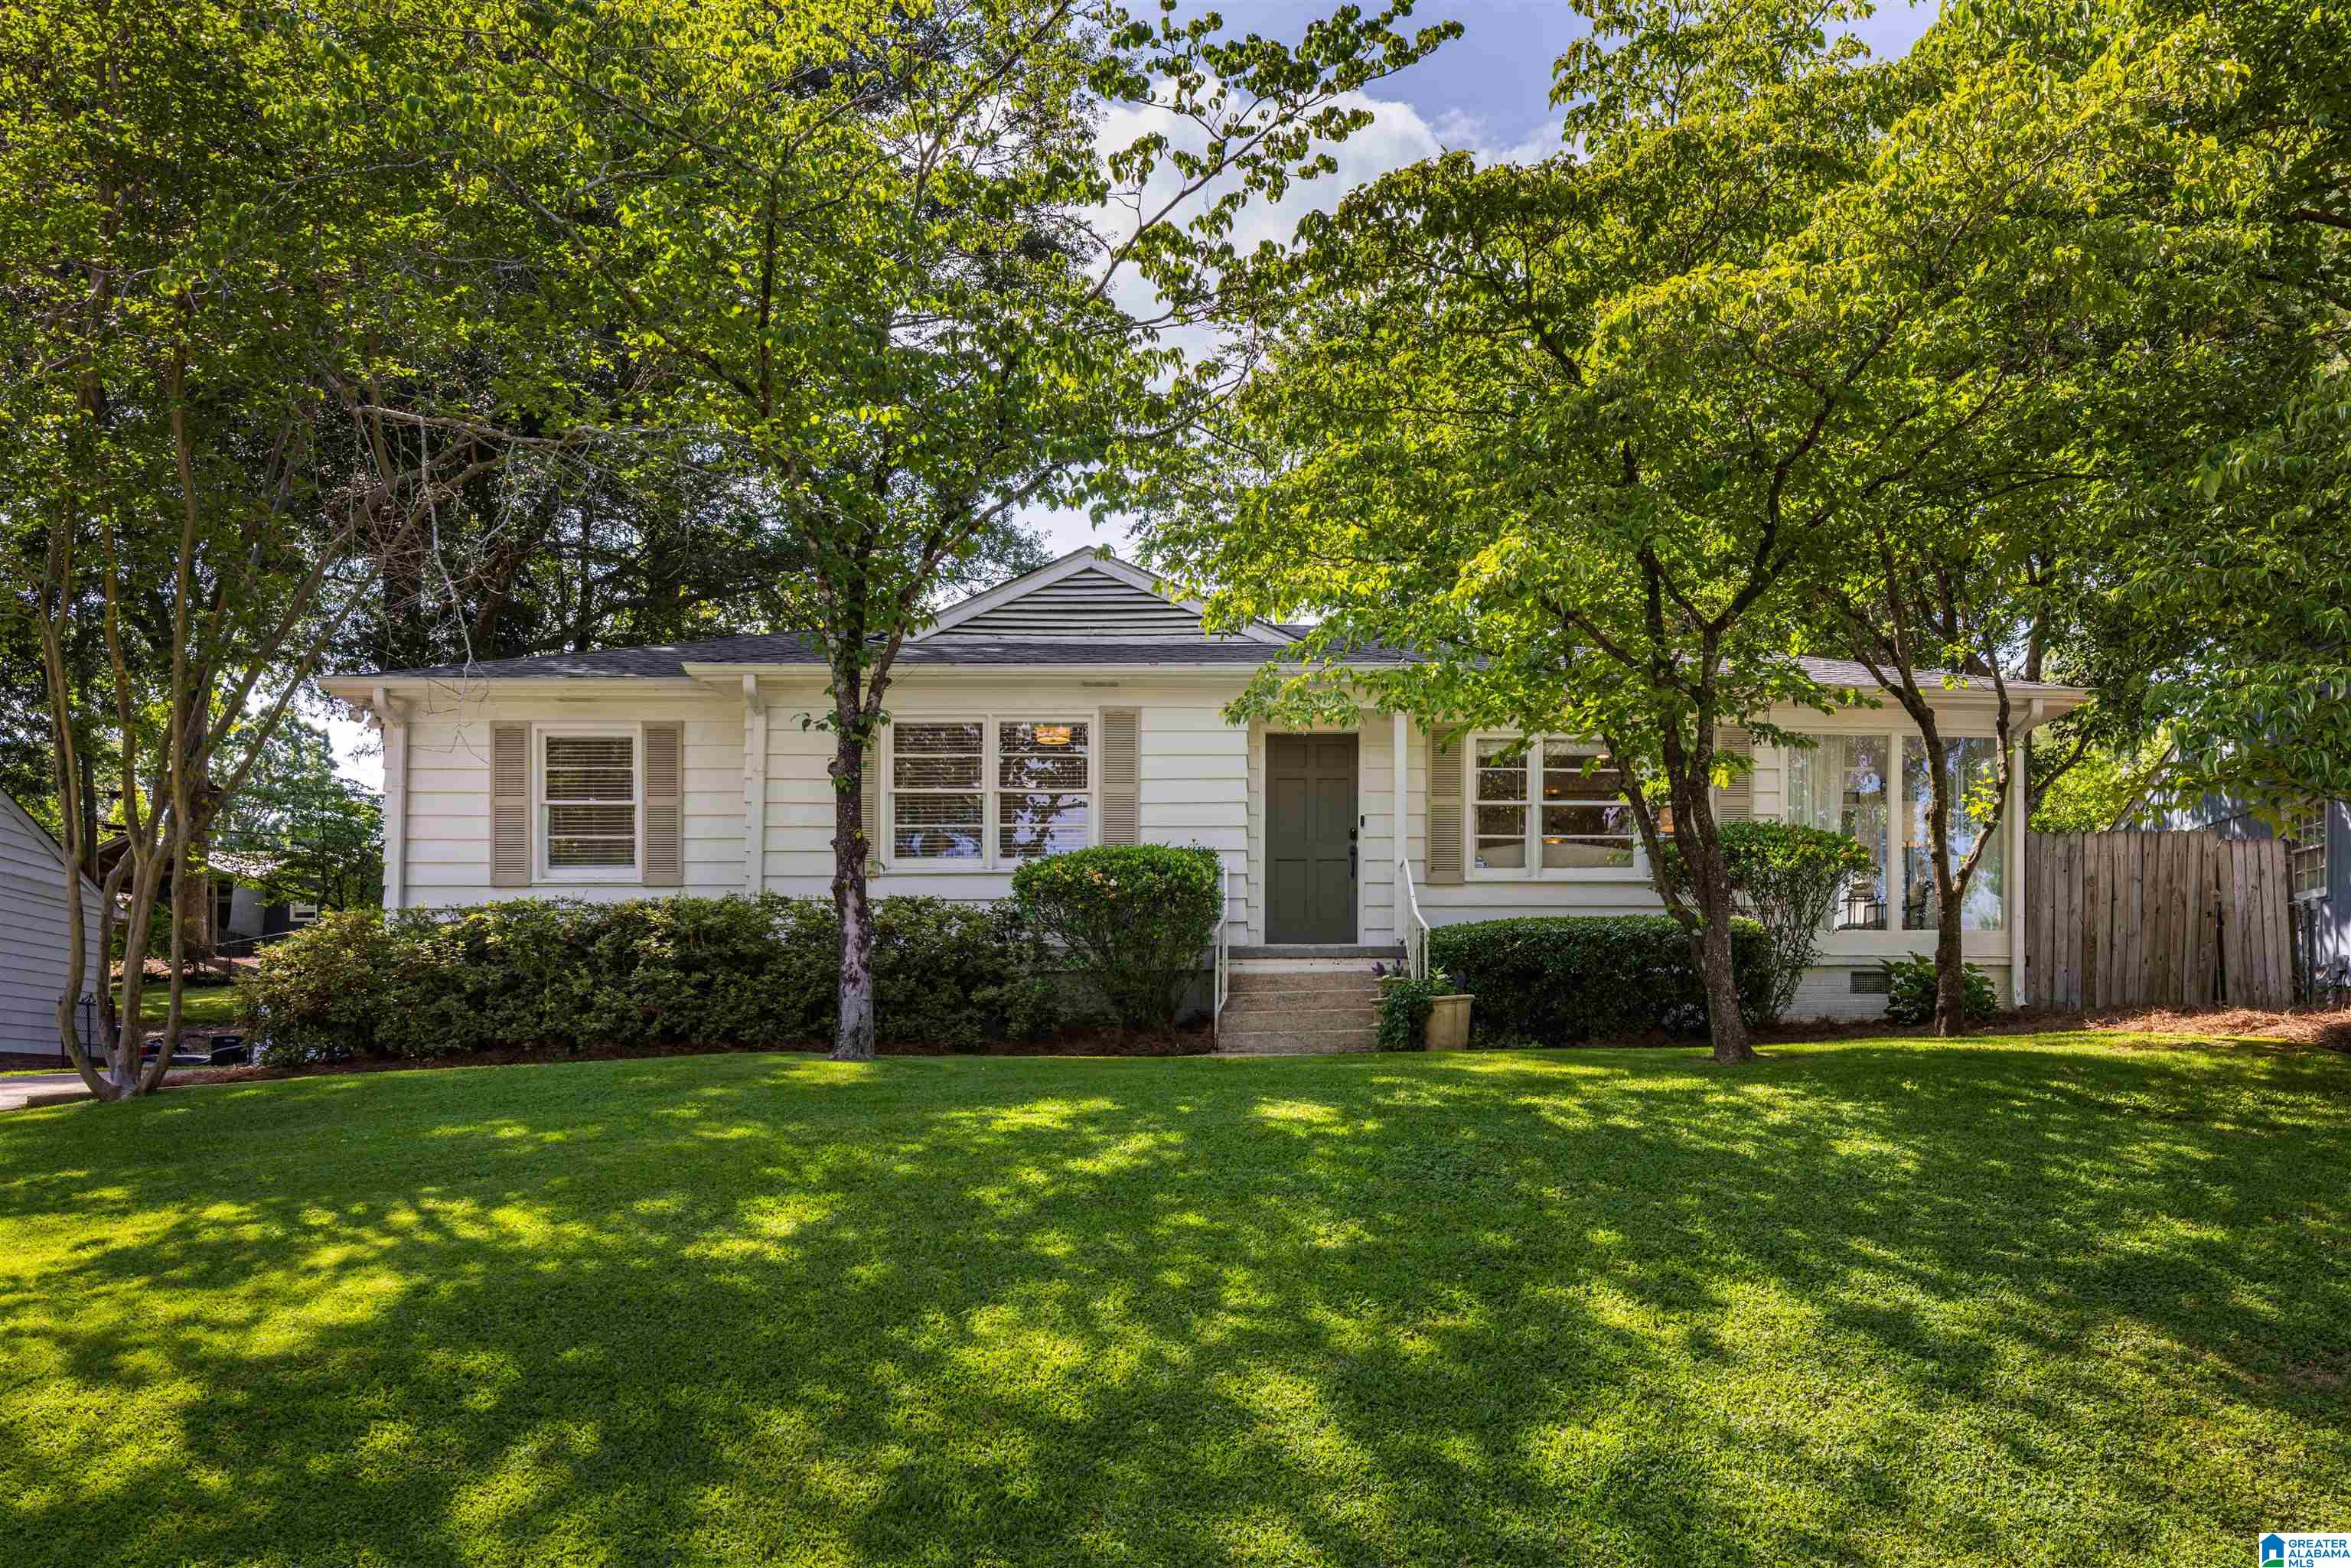
$154,900
3
bds
|
0
ba
|
1,247
sqft
|
built
1970
912 Windover Rd, Birmingham, AL 35215
$233
Cash flow
7.8%
Cash-on-Cash Return
7.5%
Cap rate
0.9%
Rent to Value Ratio
Pending
$1,199,000
4
bds
|
0
ba
|
3,628
sqft
|
built
1950
1504 Melrose Pl, Birmingham, AL 35209
$-2,638
Cash flow
-11.5%
Cash-on-Cash Return
3.0%
Cap rate
0.4%
Rent to Value Ratio
Active
$749,900
4
bds
|
0
ba
|
4,201
sqft
|
built
1992
2157 Cameron Cir, Birmingham, AL 35242
$-998
Cash flow
-6.9%
Cash-on-Cash Return
4.1%
Cap rate
0.5%
Rent to Value Ratio
Active
$449,900
3
bds
|
0
ba
|
2,092
sqft
|
built
1911
921 28th St S, Birmingham, AL 35205
$-335
Cash flow
-3.9%
Cash-on-Cash Return
4.8%
Cap rate
0.6%
Rent to Value Ratio
Active
$130,000
3
bds
|
0
ba
|
1,400
sqft
|
built
1973
7232 Naples Ave, Birmingham, AL 35206
$420
Cash flow
16.9%
Cash-on-Cash Return
9.6%
Cap rate
1.2%
Rent to Value Ratio
Active
$659,900
5
bds
|
0
ba
|
3,844
sqft
|
built
1993
4544 Eagle Point Dr, Birmingham, AL 35242
$-944
Cash flow
-7.5%
Cash-on-Cash Return
4.0%
Cap rate
0.5%
Rent to Value Ratio
Active
$549,900
3
bds
|
0
ba
|
3,549
sqft
|
built
1920
1601 Mountain Lodge Trl, Birmingham, AL 35210
$-463
Cash flow
-4.4%
Cash-on-Cash Return
4.7%
Cap rate
0.6%
Rent to Value Ratio
Active
$439,000
3
bds
|
0
ba
|
2,204
sqft
|
built
1993
2552 Magnolia Pl, Birmingham, AL 35242
$-94
Cash flow
-1.1%
Cash-on-Cash Return
5.4%
Cap rate
0.7%
Rent to Value Ratio
Active
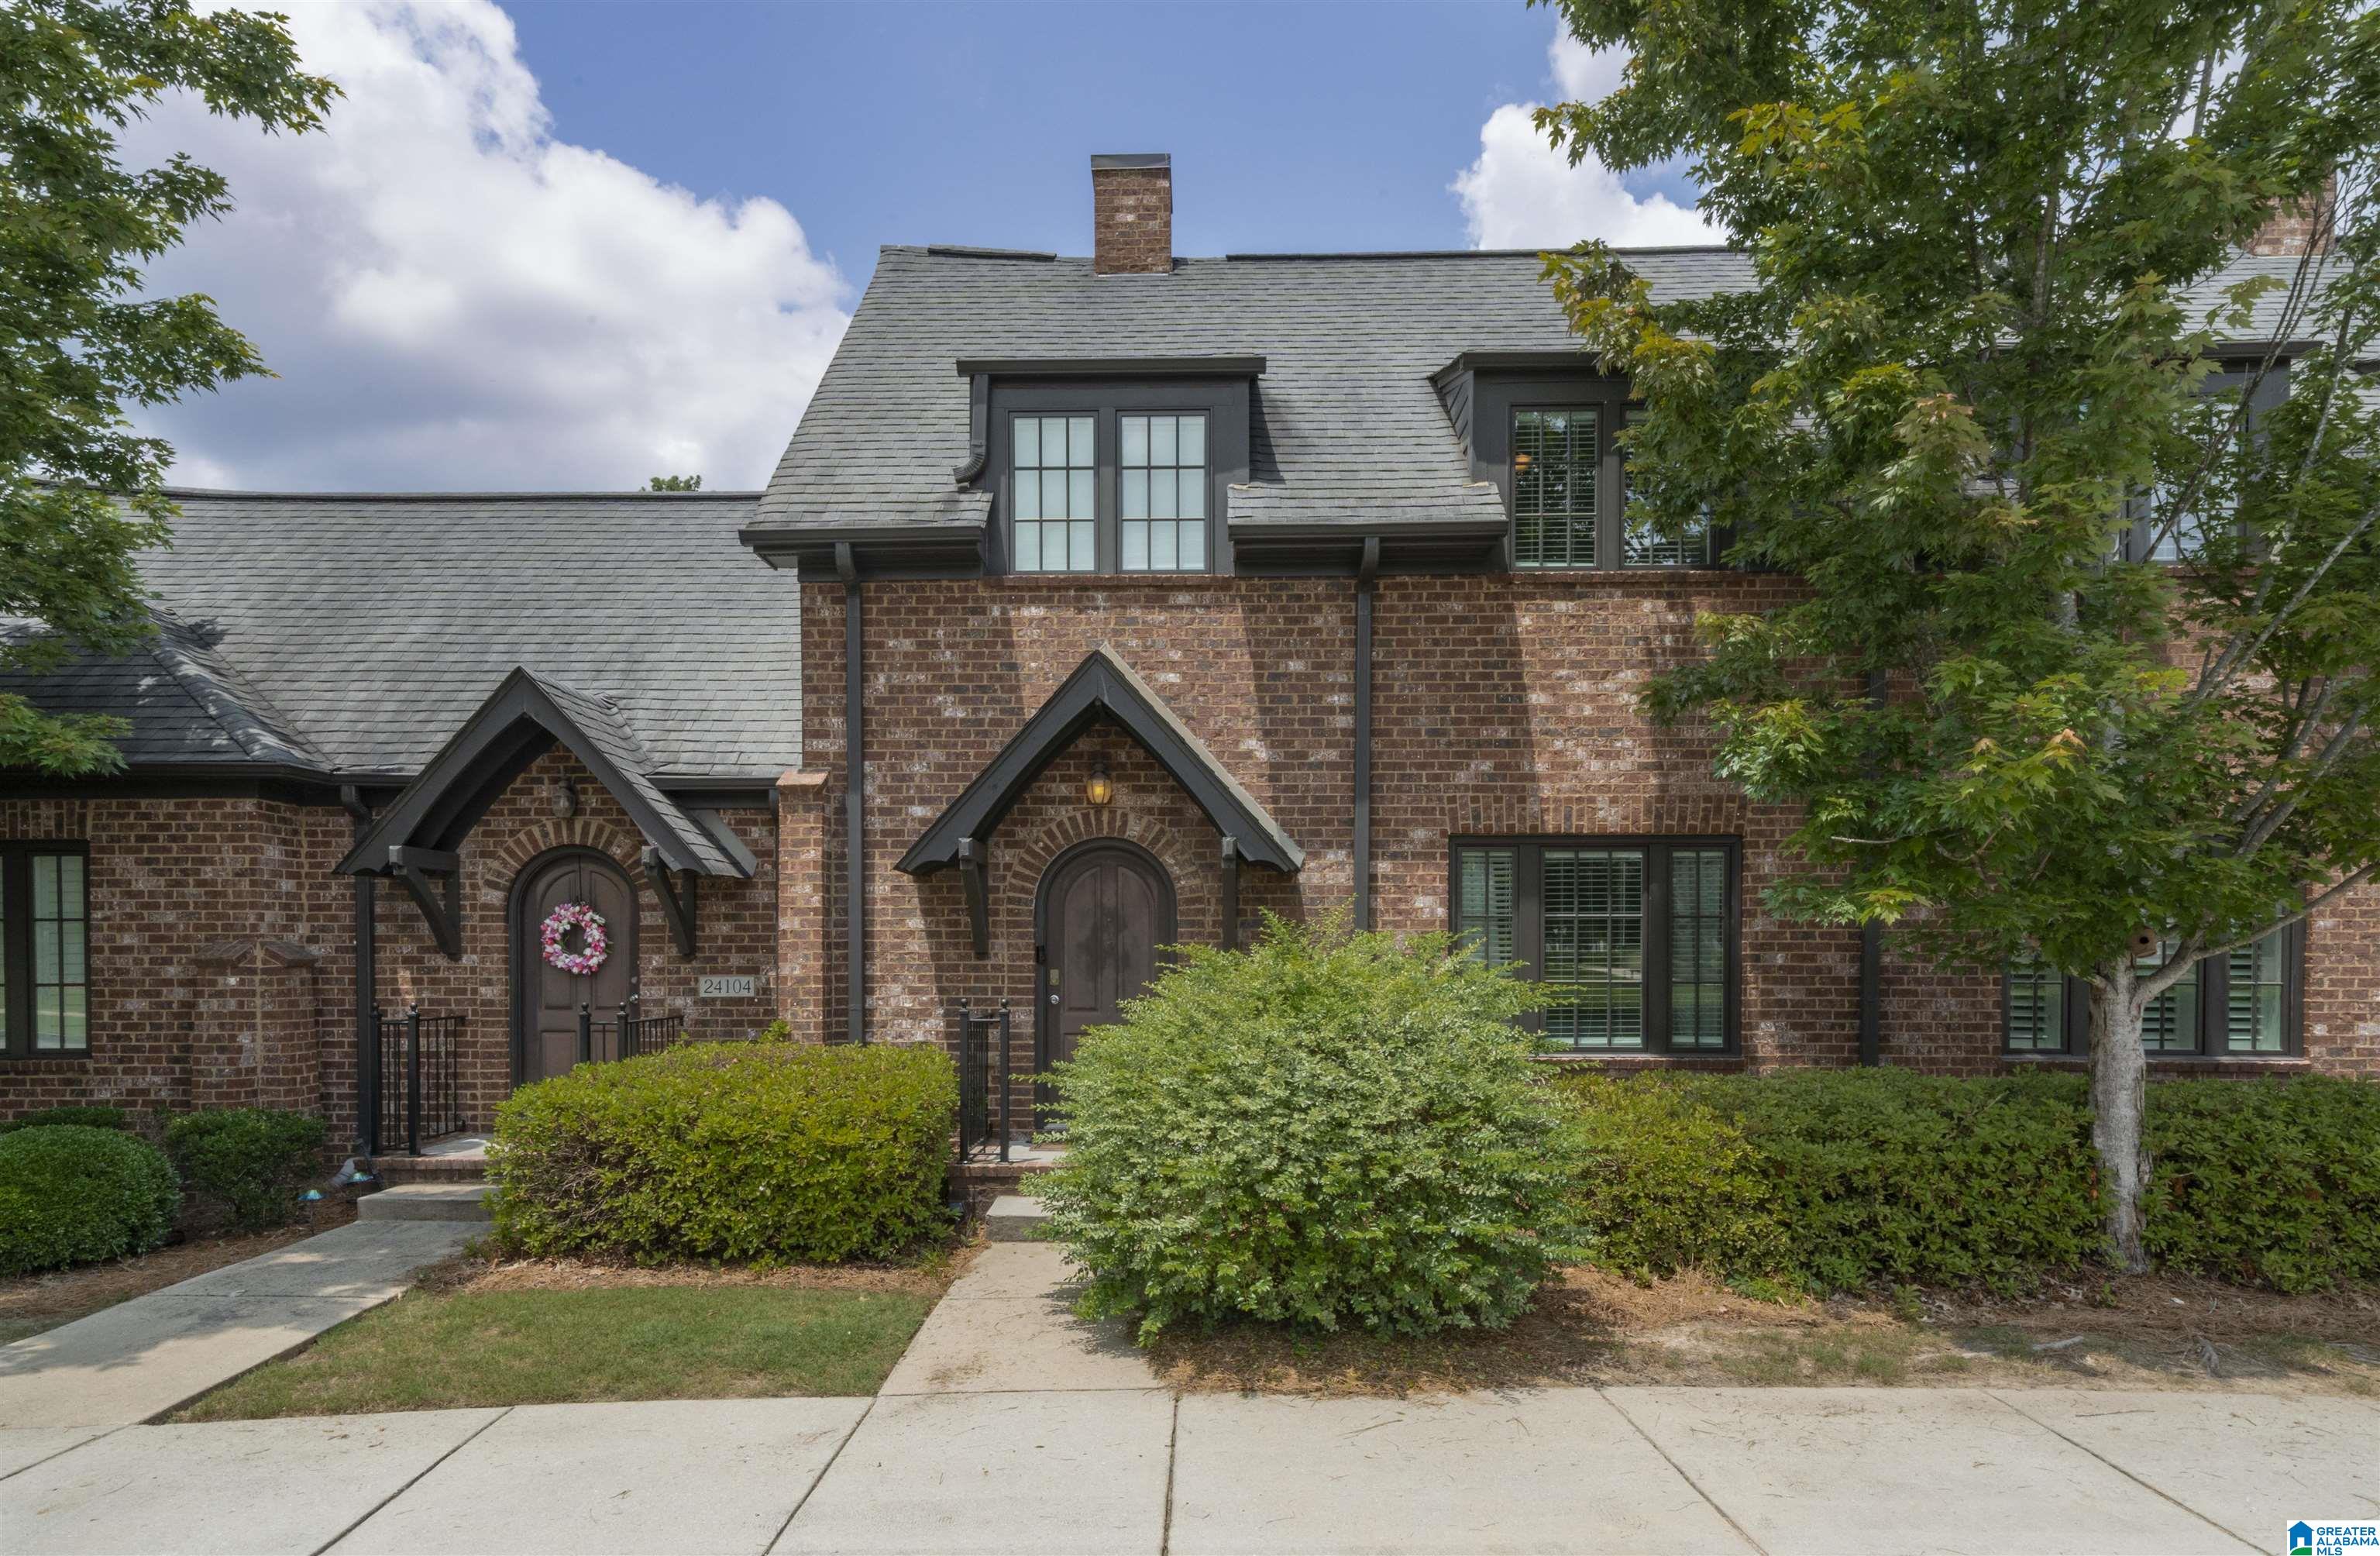
$379,000
3
bds
|
0
ba
|
2,822
sqft
|
built
2009
24105 Portobello Rd, Birmingham, AL 35242
$-481
Cash flow
-6.6%
Cash-on-Cash Return
4.2%
Cap rate
0.7%
Rent to Value Ratio
Active
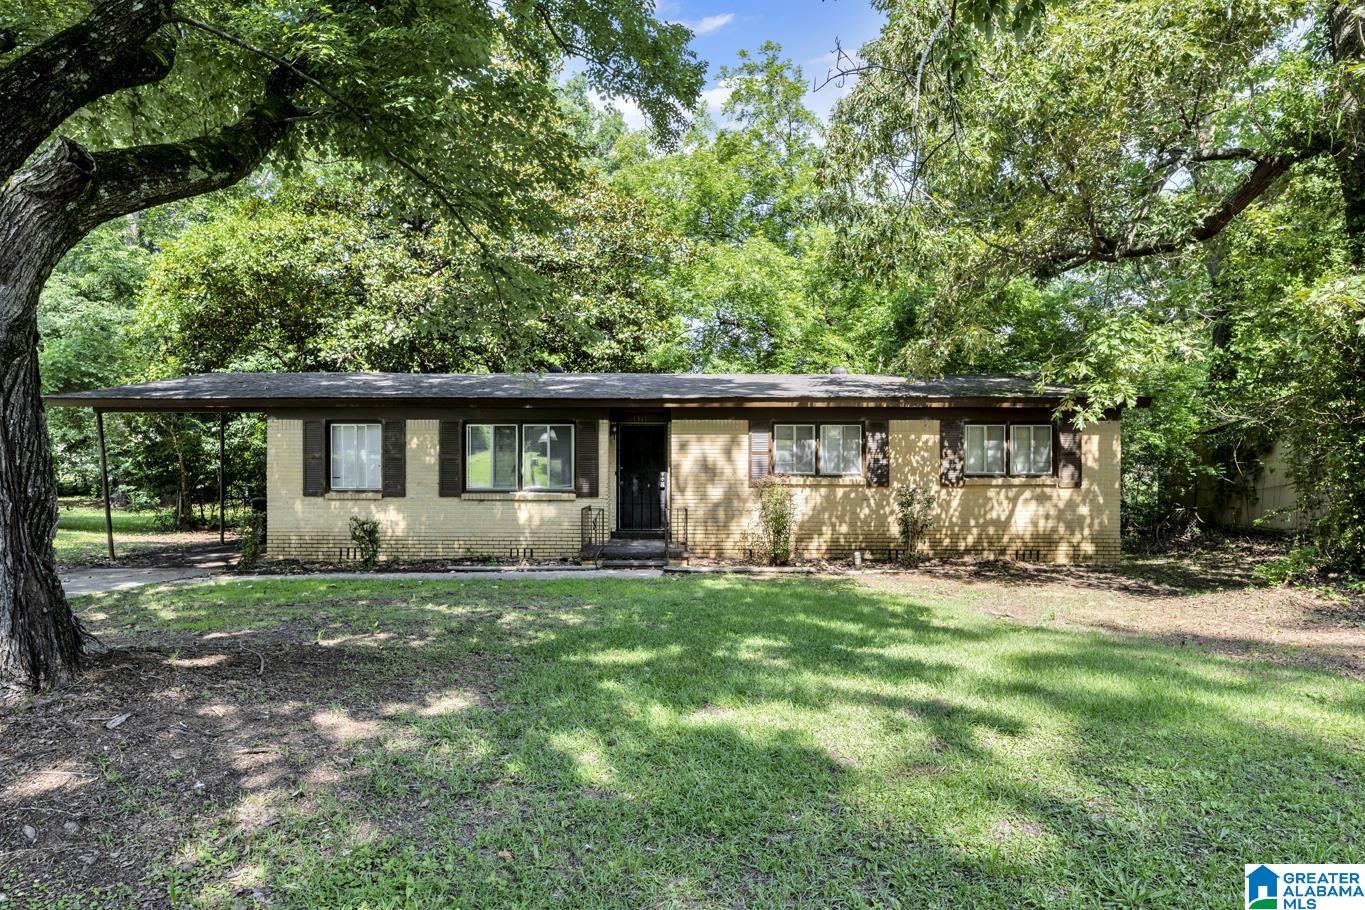
$112,900
3
bds
|
0
ba
|
1,318
sqft
|
built
1958
1341 Hatfield Ln, Birmingham, AL 35215
$363
Cash flow
16.8%
Cash-on-Cash Return
9.5%
Cap rate
1.2%
Rent to Value Ratio
Pending
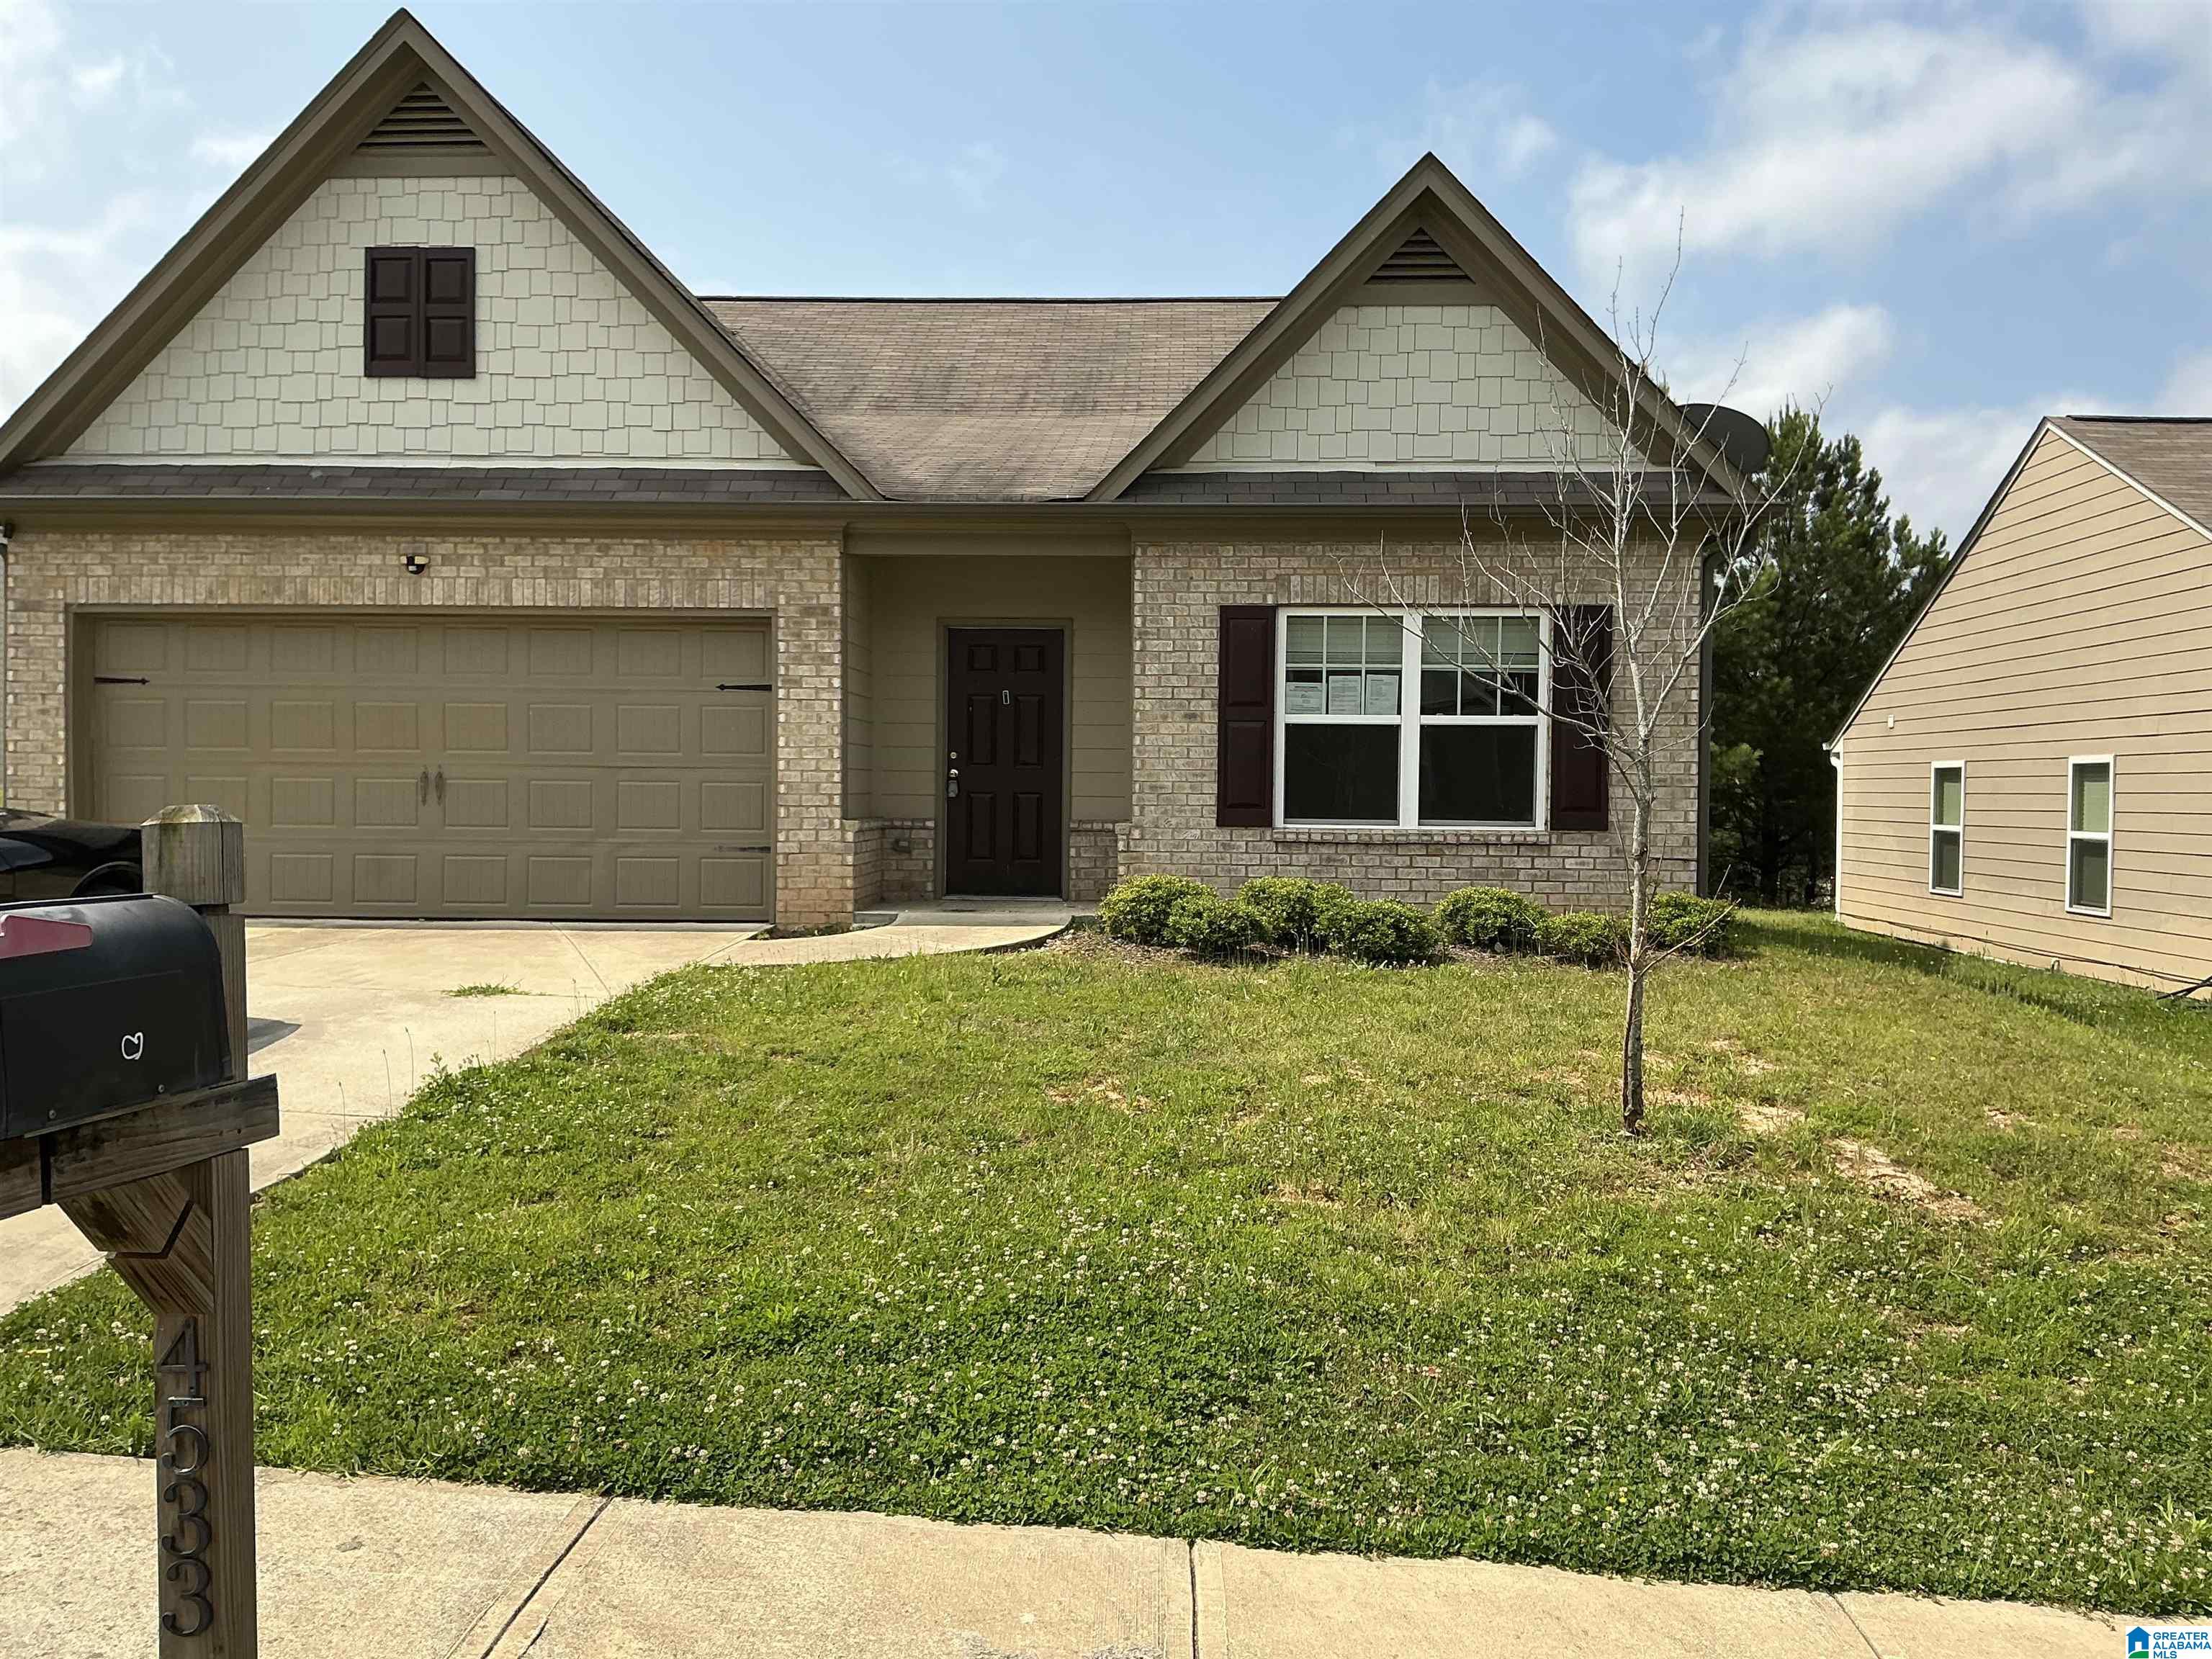
$205,000
3
bds
|
0
ba
|
1,643
sqft
|
built
2020
4533 Winchester Hills Way, Birmingham, AL 35215
$255
Cash flow
6.5%
Cash-on-Cash Return
7.2%
Cap rate
0.9%
Rent to Value Ratio
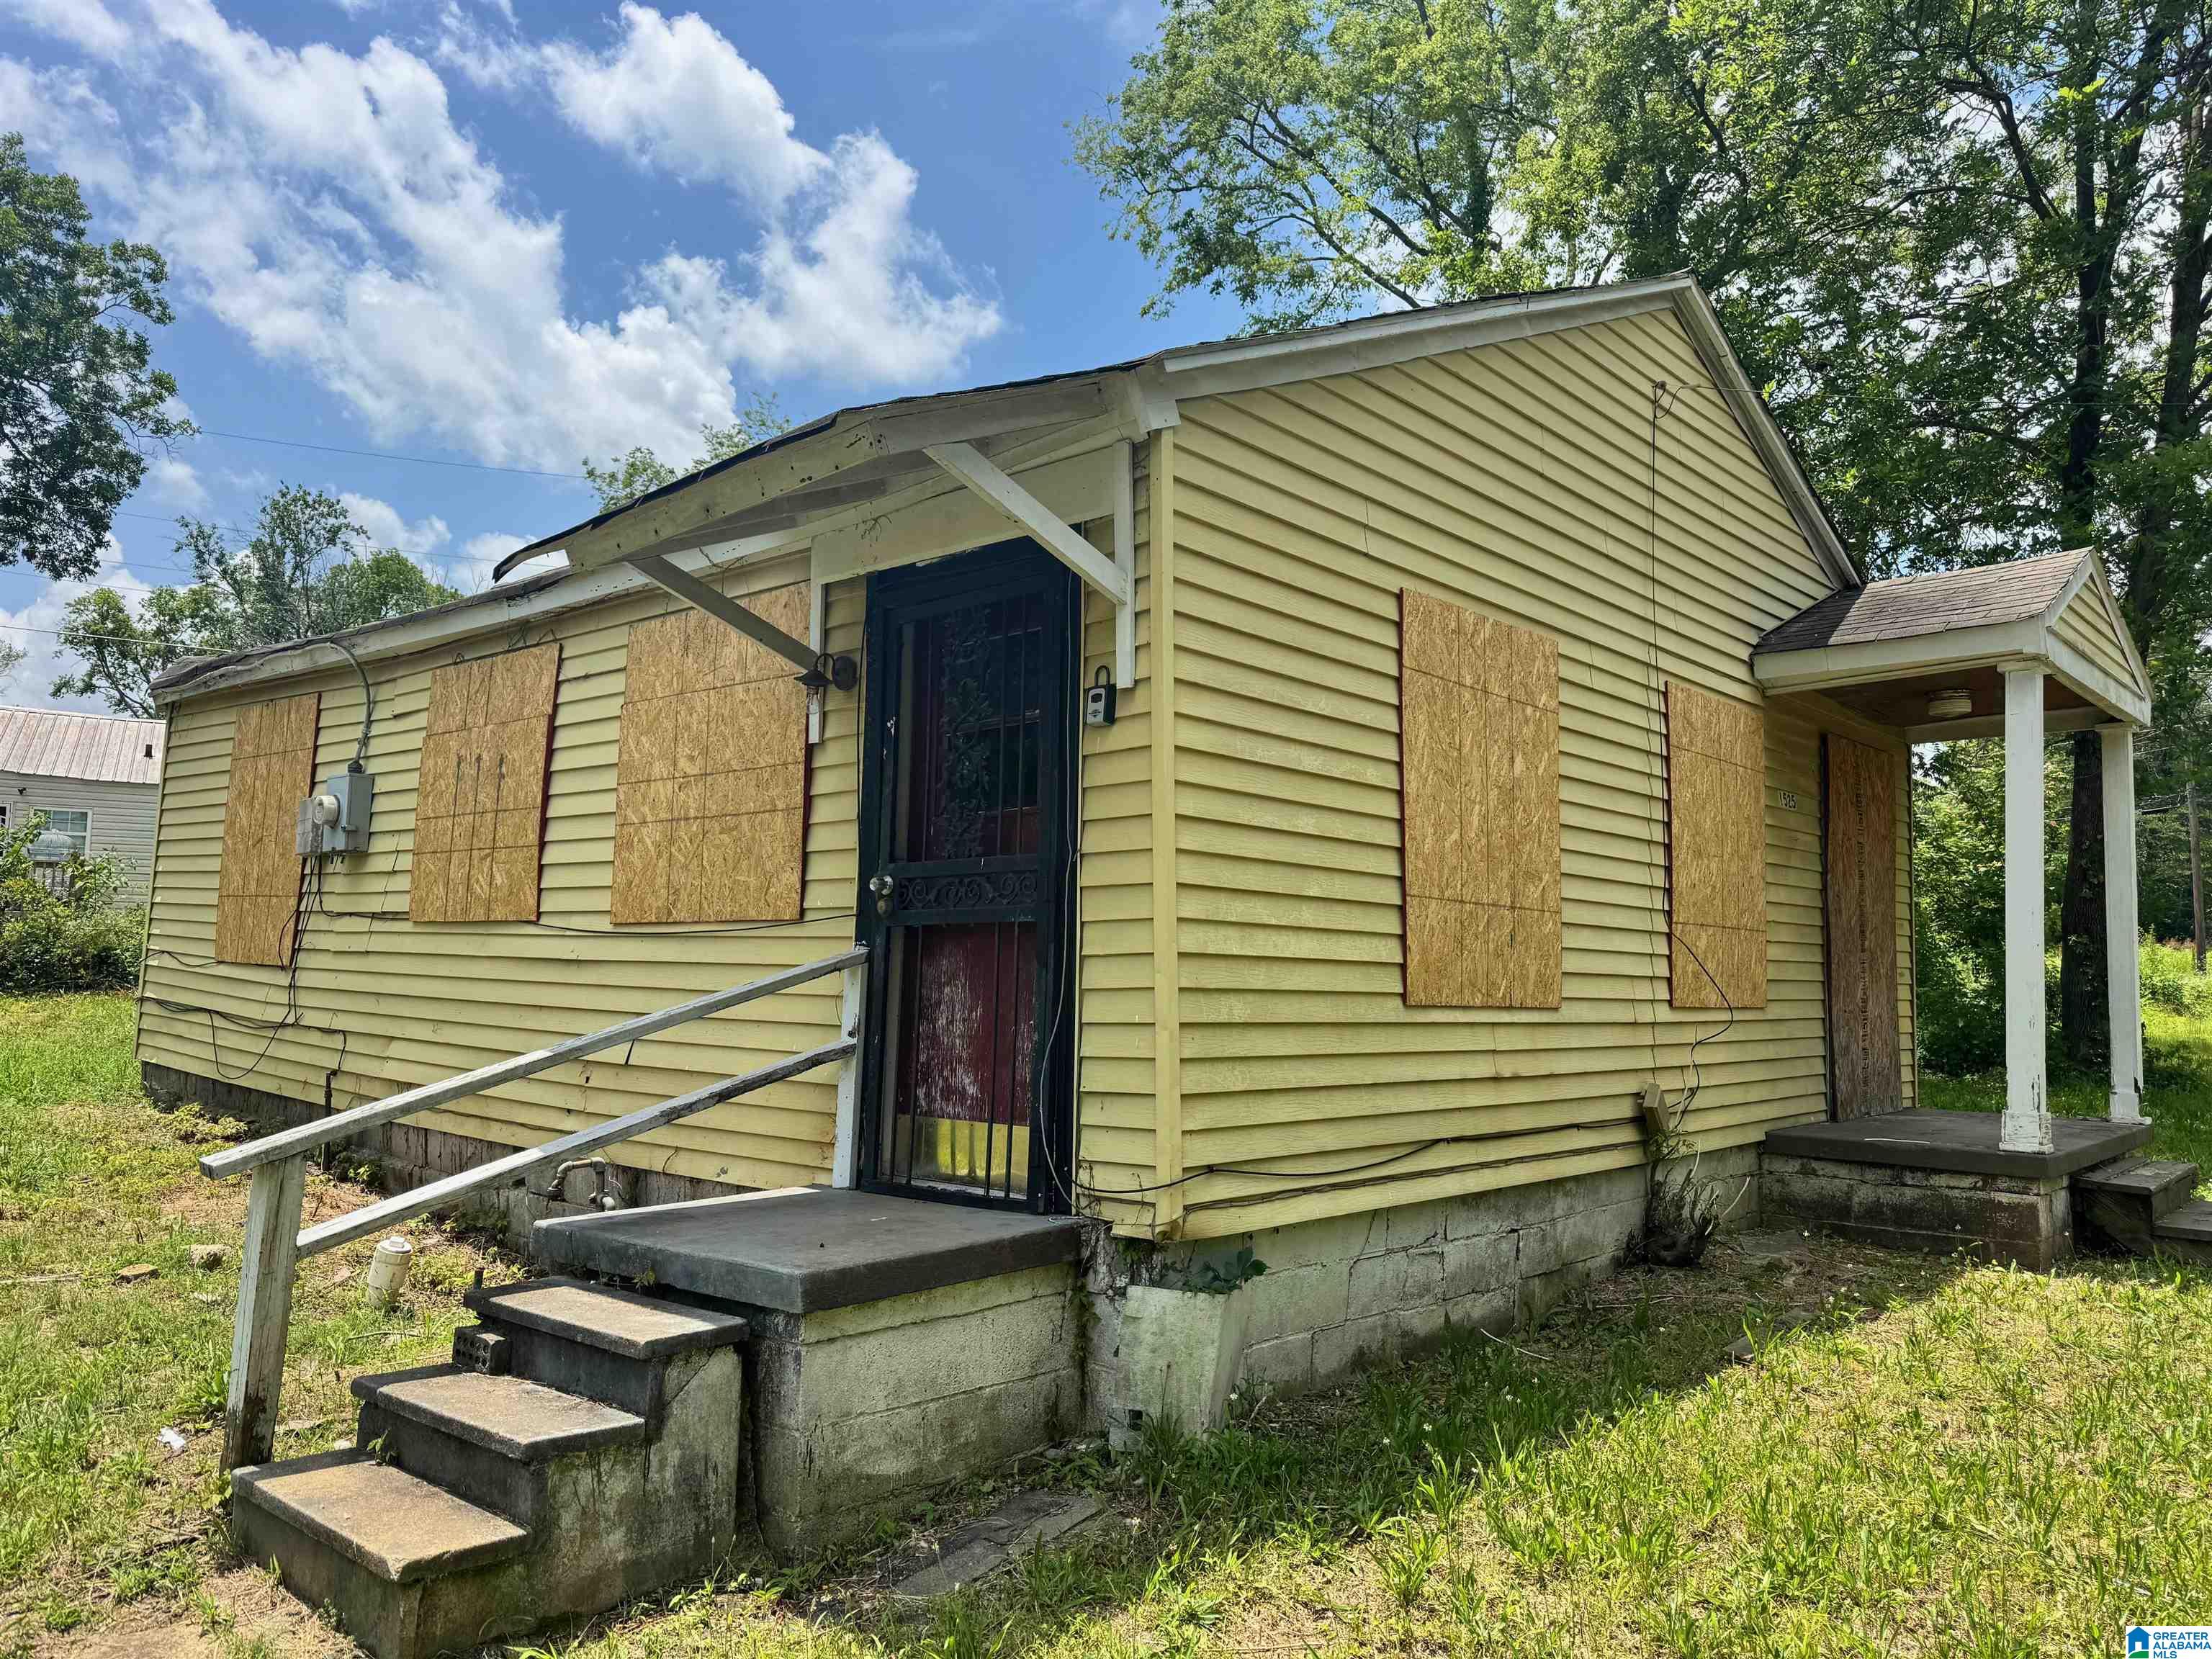
Active
$40,000
2
bds
|
0
ba
|
752
sqft
|
built
1948
1525 Meadow Ln, Birmingham, AL 35228
$621
Cash flow
18.1%
Cash-on-Cash Return
18.6%
Cap rate
2.3%
Rent to Value Ratio
Pending
$494,900
3
bds
|
0
ba
|
1,918
sqft
|
built
2003
3774 Crossings Crst, Birmingham, AL 35242
$-432
Cash flow
-4.6%
Cash-on-Cash Return
4.6%
Cap rate
0.6%
Rent to Value Ratio
Active
$239,900
3
bds
|
0
ba
|
1,539
sqft
|
built
1967
613 Chestnut St, Birmingham, AL 35206
$107
Cash flow
2.3%
Cash-on-Cash Return
6.2%
Cap rate
0.8%
Rent to Value Ratio
Active under contract
$629,000
4
bds
|
0
ba
|
3,356
sqft
|
built
1954
565 Shades Crest Rd, Birmingham, AL 35226
$-1,183
Cash flow
-9.8%
Cash-on-Cash Return
3.4%
Cap rate
0.4%
Rent to Value Ratio
Active
$1,999,780
5
bds
|
0
ba
|
5,890
sqft
|
built
2023
311 Southledge Pl, Birmingham, AL 35242
$-6,110
Cash flow
-15.9%
Cash-on-Cash Return
2.0%
Cap rate
0.3%
Rent to Value Ratio
Active
$305,000
4
bds
|
0
ba
|
3,672
sqft
|
built
1979
908 18th Ave NW, Birmingham, AL 35215
$-63
Cash flow
-1.1%
Cash-on-Cash Return
5.4%
Cap rate
0.7%
Rent to Value Ratio
Active
$499,900
4
bds
|
0
ba
|
3,504
sqft
|
built
1986
4915 Meadow Brook Way, Birmingham, AL 35242
$-160
Cash flow
-1.7%
Cash-on-Cash Return
5.3%
Cap rate
0.6%
Rent to Value Ratio
Active
$179,900
2
bds
|
0
ba
|
864
sqft
|
built
1977
3350 Altamont Rd S, Birmingham, AL 35205
$-227
Cash flow
-6.6%
Cash-on-Cash Return
4.2%
Cap rate
0.8%
Rent to Value Ratio

Active under contract
$344,900
3
bds
|
0
ba
|
1,332
sqft
|
built
1958
1021 58th St S, Birmingham, AL 35222
$24
Cash flow
0.4%
Cash-on-Cash Return
5.8%
Cap rate
0.7%
Rent to Value Ratio
Active
$114,900
3
bds
|
0
ba
|
1,025
sqft
|
built
1960
405 Camellia Rd, Birmingham, AL 35215
$353
Cash flow
16.0%
Cash-on-Cash Return
9.4%
Cap rate
1.1%
Rent to Value Ratio
Active
$464,900
3
bds
|
0
ba
|
2,320
sqft
|
built
1992
2336 Woodland Cir, Birmingham, AL 35242
$-337
Cash flow
-3.8%
Cash-on-Cash Return
4.8%
Cap rate
0.6%
Rent to Value Ratio
Active under contract
$450,000
3
bds
|
0
ba
|
2,252
sqft
|
built
1956
1519 Berry Rd, Birmingham, AL 35226
$-198
Cash flow
-2.3%
Cash-on-Cash Return
5.2%
Cap rate
0.6%
Rent to Value Ratio
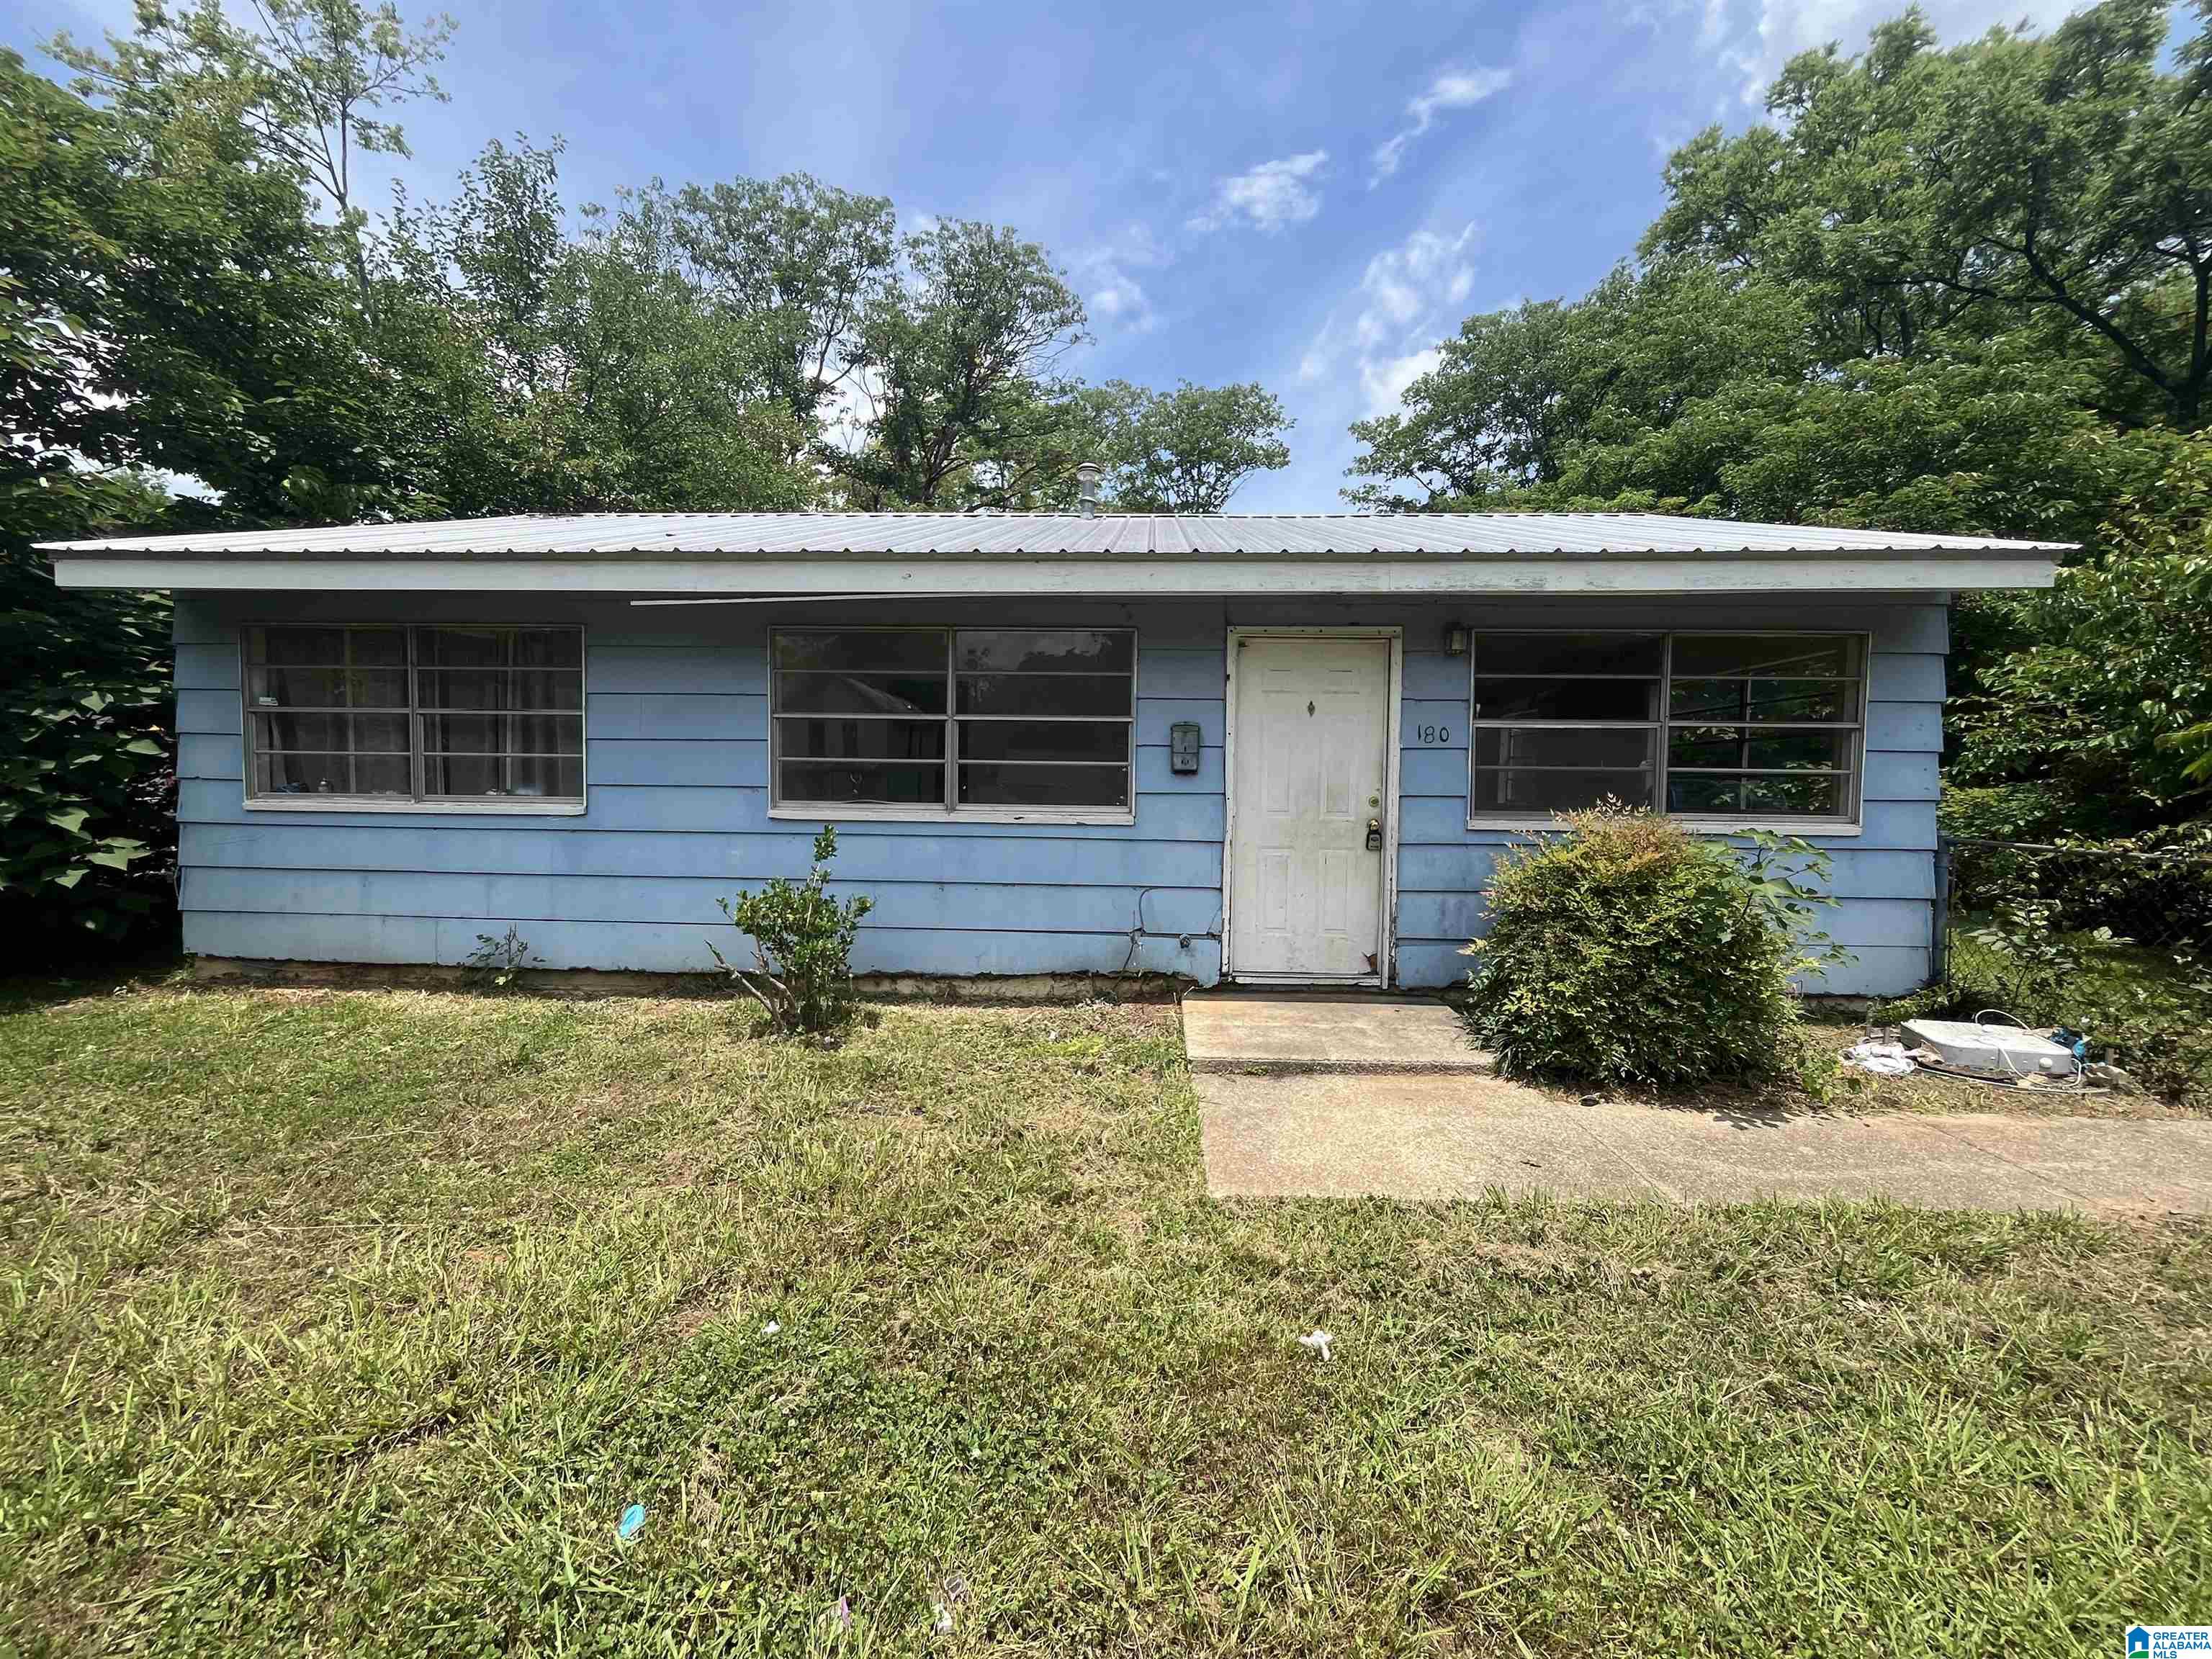
Pending
$56,000
3
bds
|
0
ba
|
831
sqft
|
built
1960
180 1st Street Thomas, Birmingham, AL 35214
$690
Cash flow
14.4%
Cash-on-Cash Return
14.8%
Cap rate
1.8%
Rent to Value Ratio
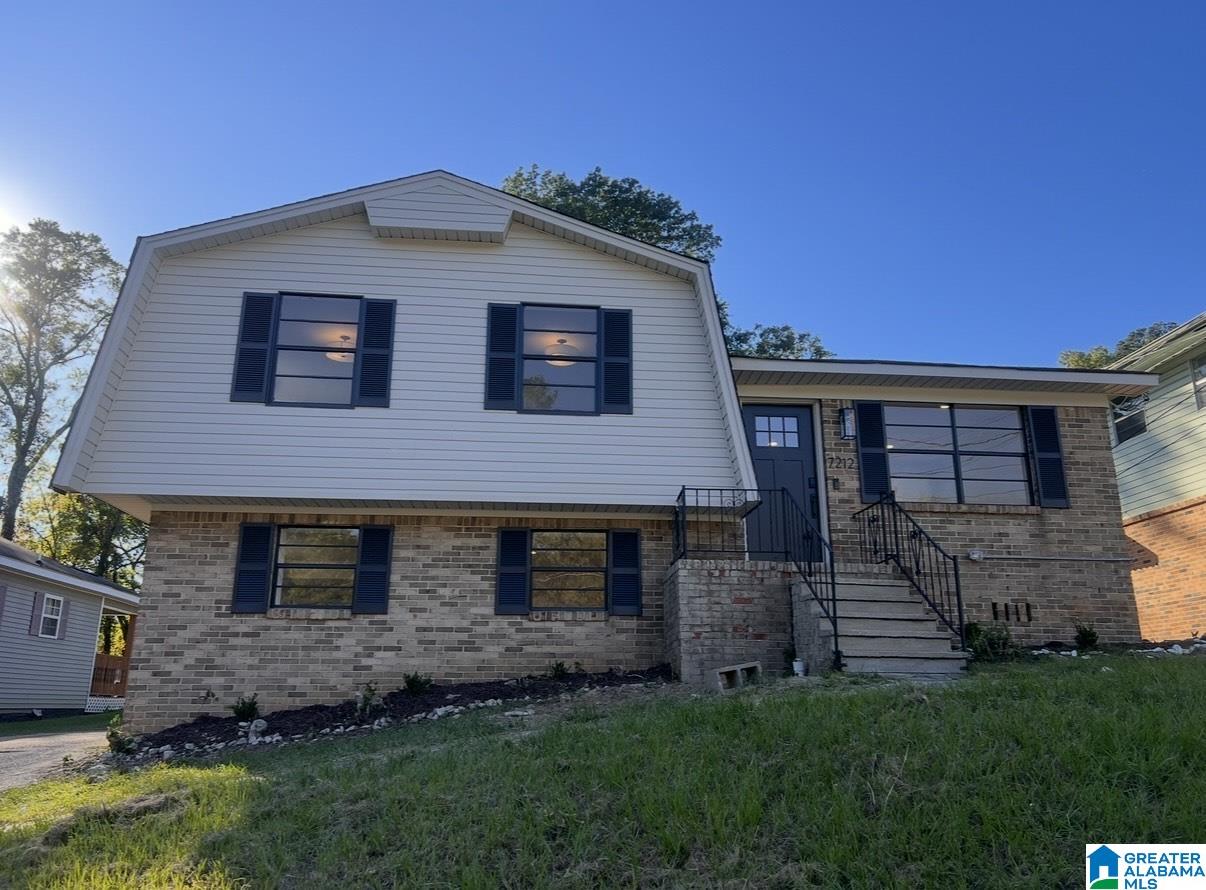
Active
$159,999
3
bds
|
0
ba
|
1,604
sqft
|
built
1972
7212 Oporto Madrid Blvd S, Birmingham, AL 35206
$485
Cash flow
15.8%
Cash-on-Cash Return
9.3%
Cap rate
1.1%
Rent to Value Ratio
Active
$369,000
4
bds
|
0
ba
|
2,728
sqft
|
built
1952
507 Green Springs Ave S, Birmingham, AL 35205
$-366
Cash flow
-5.2%
Cash-on-Cash Return
4.5%
Cap rate
0.5%
Rent to Value Ratio
Active
$36,000
3
bds
|
0
ba
|
1,368
sqft
|
built
1940
2308 17th Street Ensley, Birmingham, AL 35208
$897
Cash flow
29.0%
Cash-on-Cash Return
29.9%
Cap rate
3.6%
Rent to Value Ratio
Active
$159,900
3
bds
|
0
ba
|
1,101
sqft
|
built
1940
741 Center Pl SW, Birmingham, AL 35211
$2
Cash flow
0.1%
Cash-on-Cash Return
5.7%
Cap rate
0.7%
Rent to Value Ratio
Active
$45,000
3
bds
|
0
ba
|
1,068
sqft
|
built
1945
2100 Dawson Ave SW, Birmingham, AL 35211
$828
Cash flow
21.4%
Cash-on-Cash Return
22.1%
Cap rate
2.7%
Rent to Value Ratio