Birmingham, AL Investment Properties for Sale
Browse homes for sale and investment properties in Birmingham, AL. Refine your search by price, property type, or more.
Best cash flowing properties in Birmingham, AL
Active
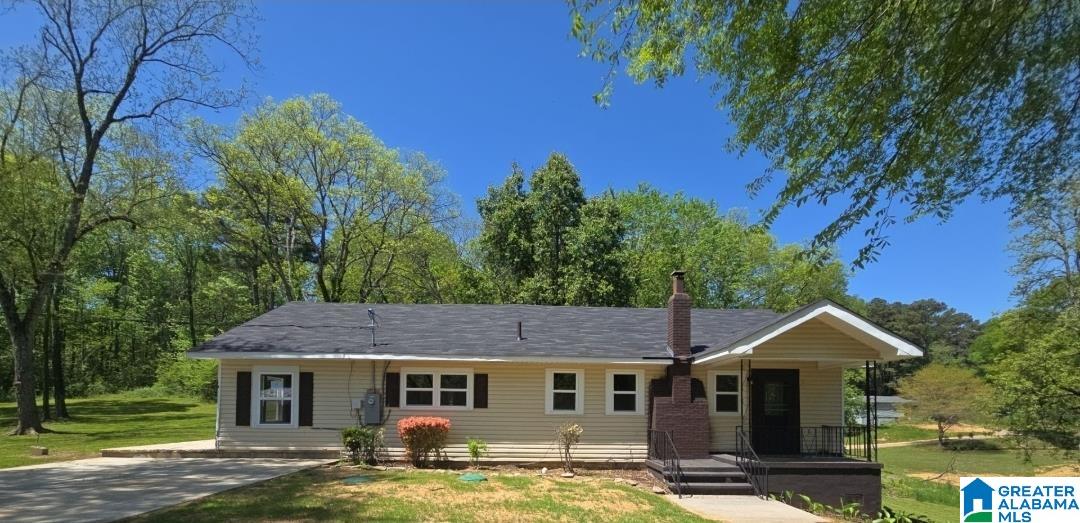
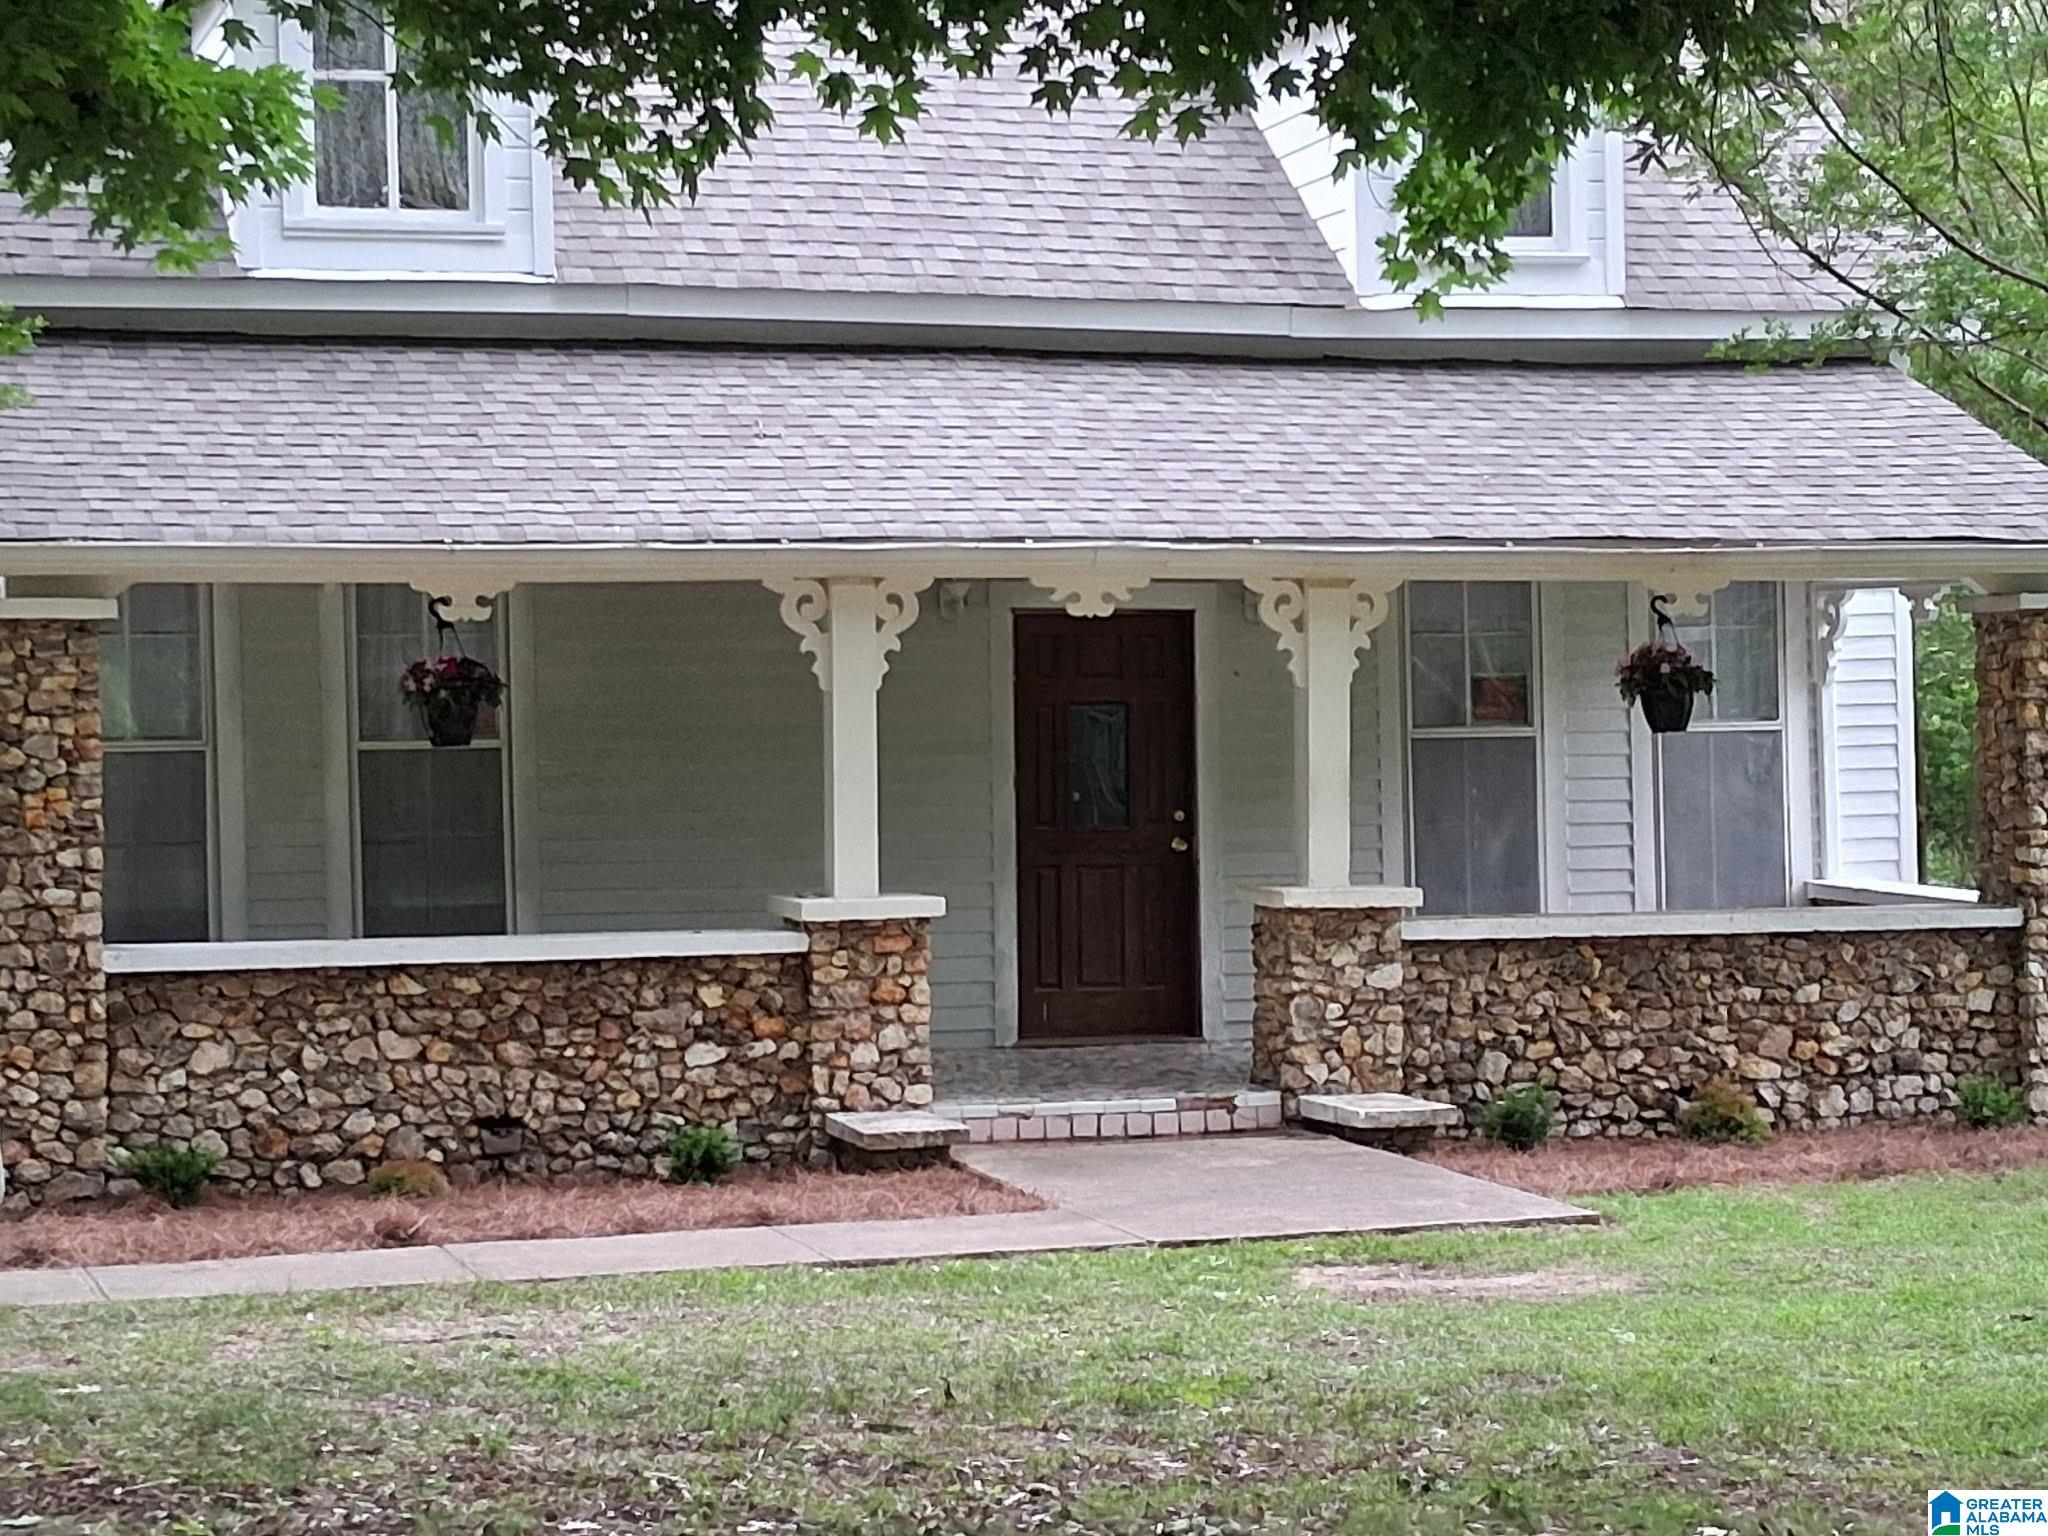
$52,500
3
bds
|
0
ba
|
1,096
sqft
|
built
1954
201 Carol Dr, Birmingham, AL 35215
$759
Cash flow
16.8%
Cash-on-Cash Return
17.3%
Cap rate
2.1%
Rent to Value Ratio
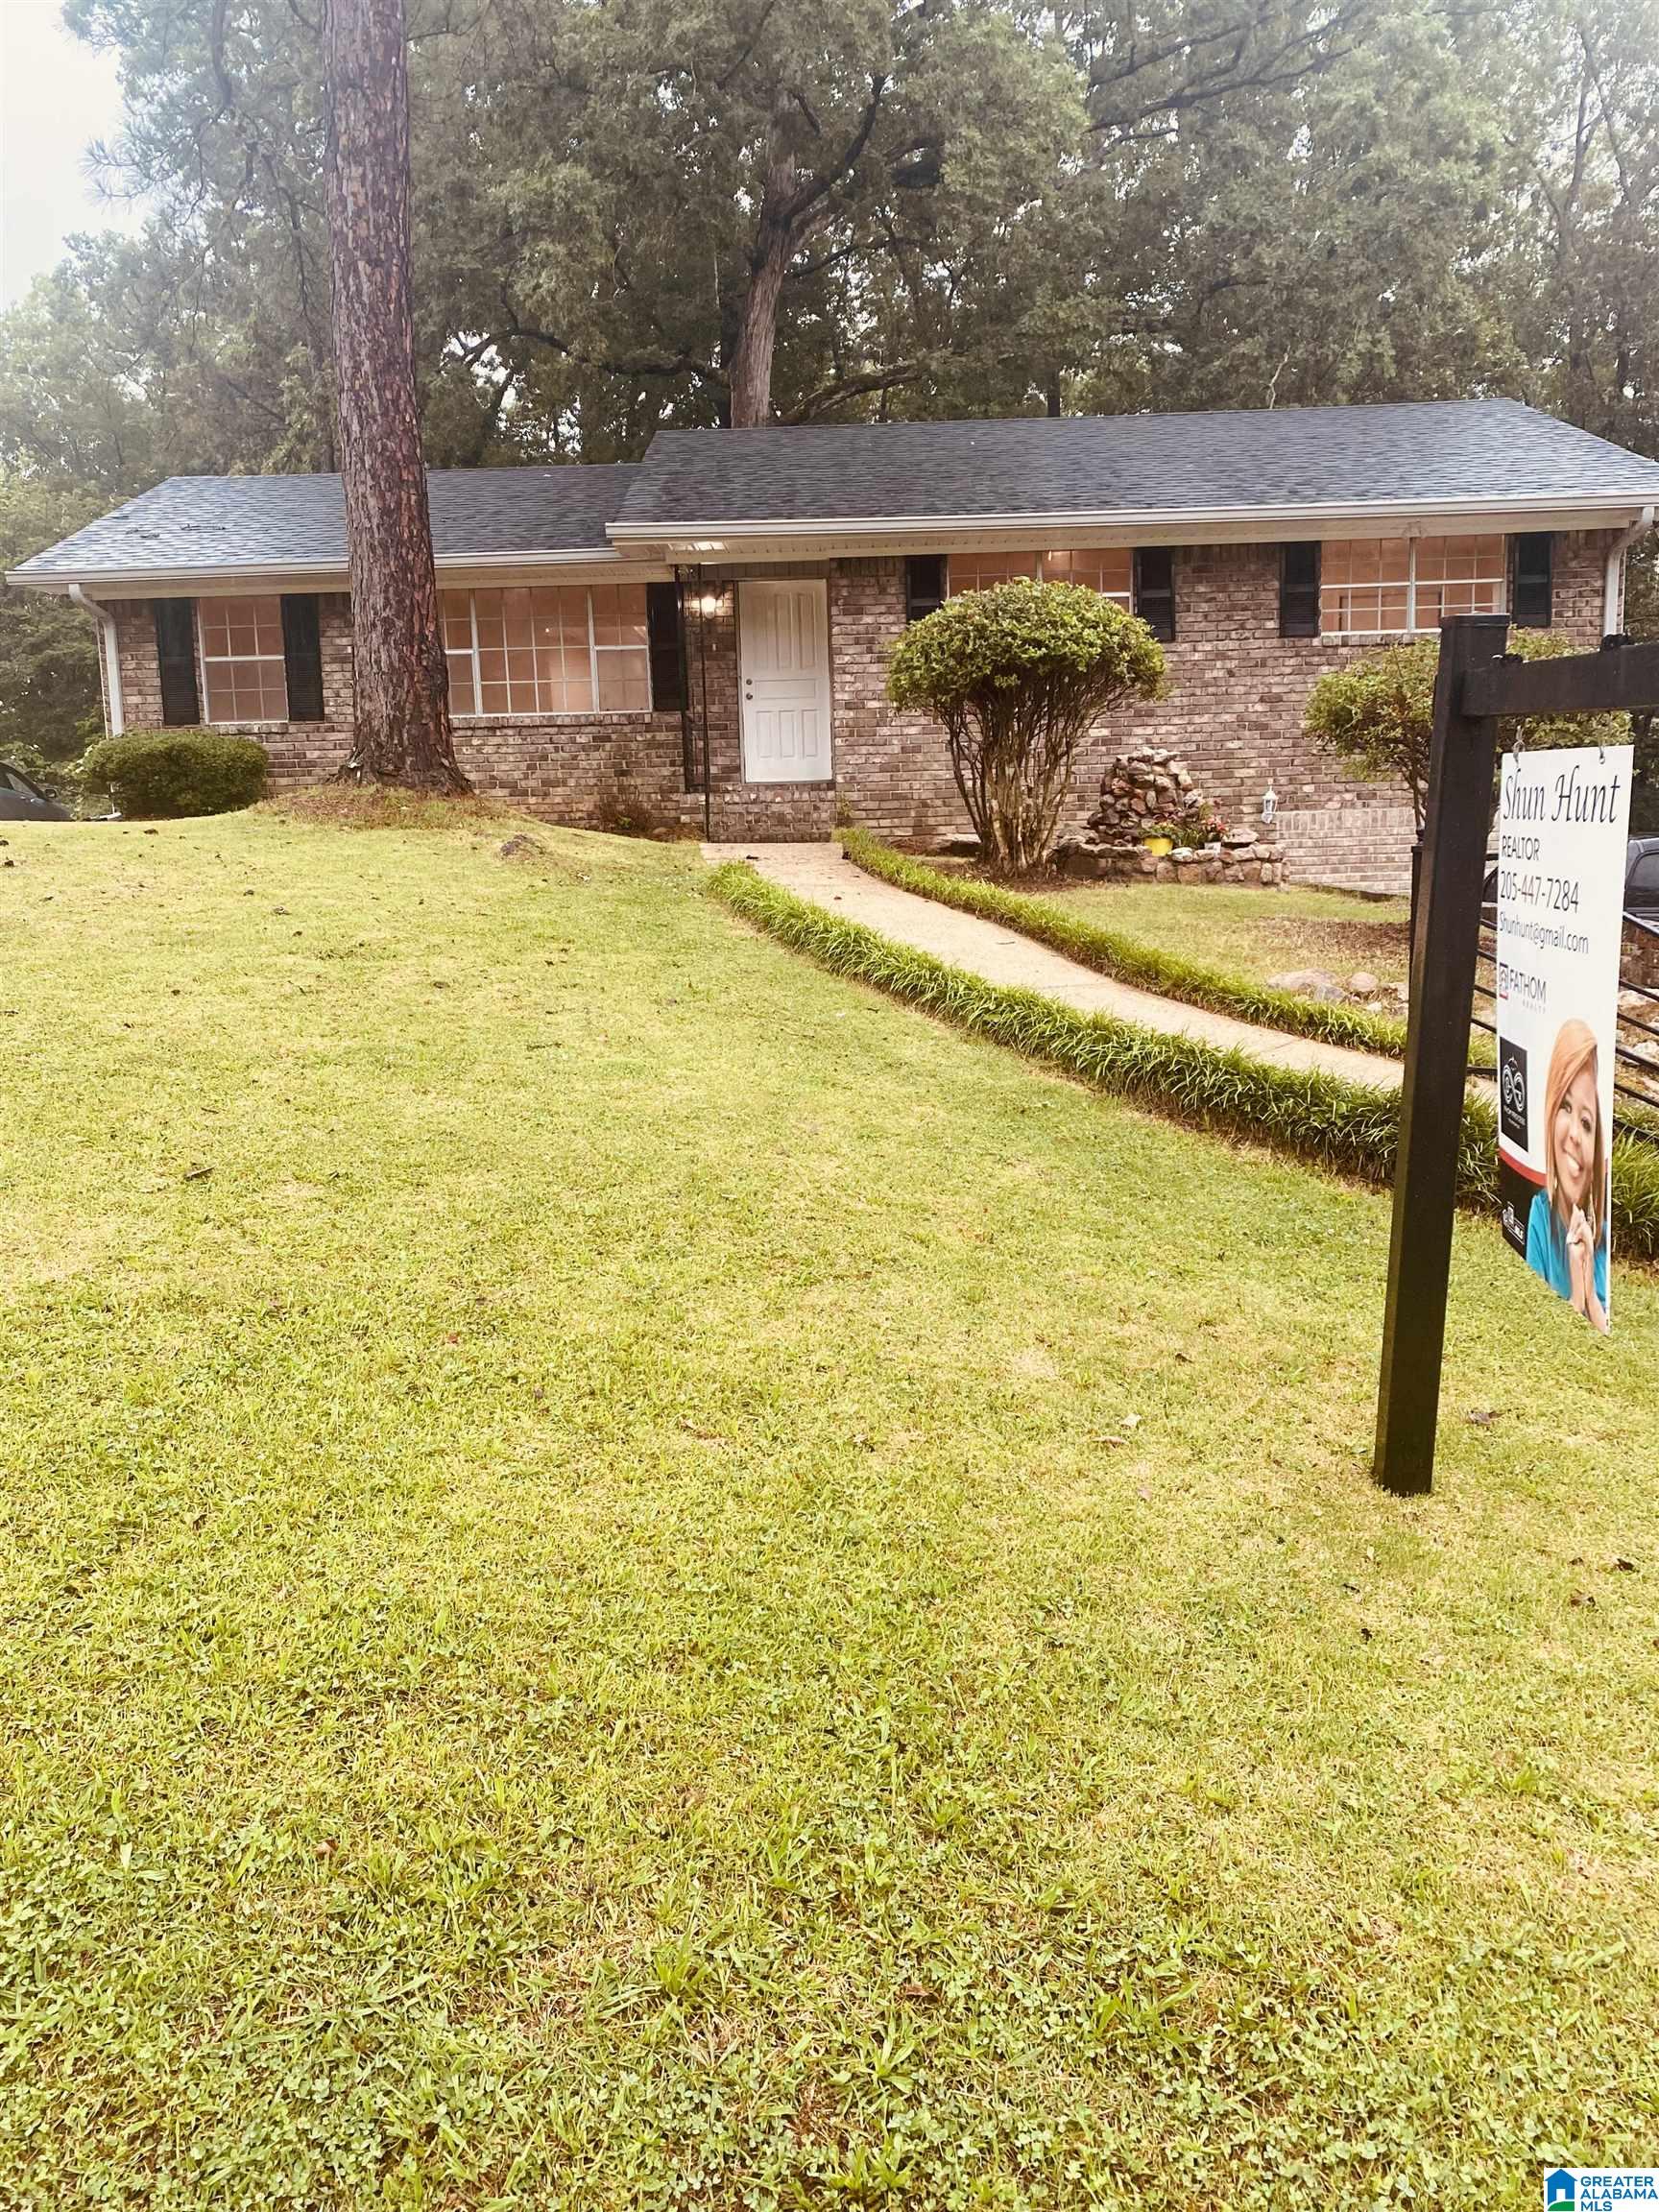
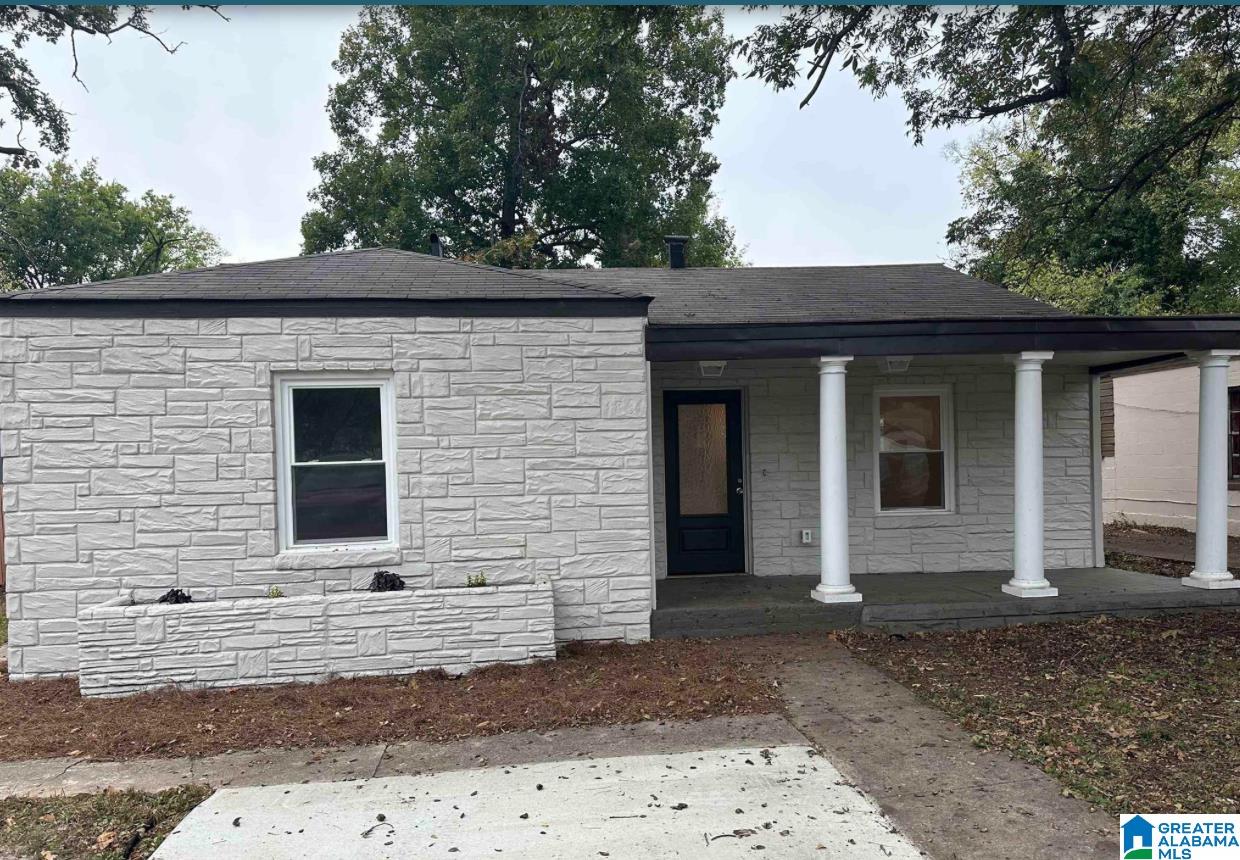
Active
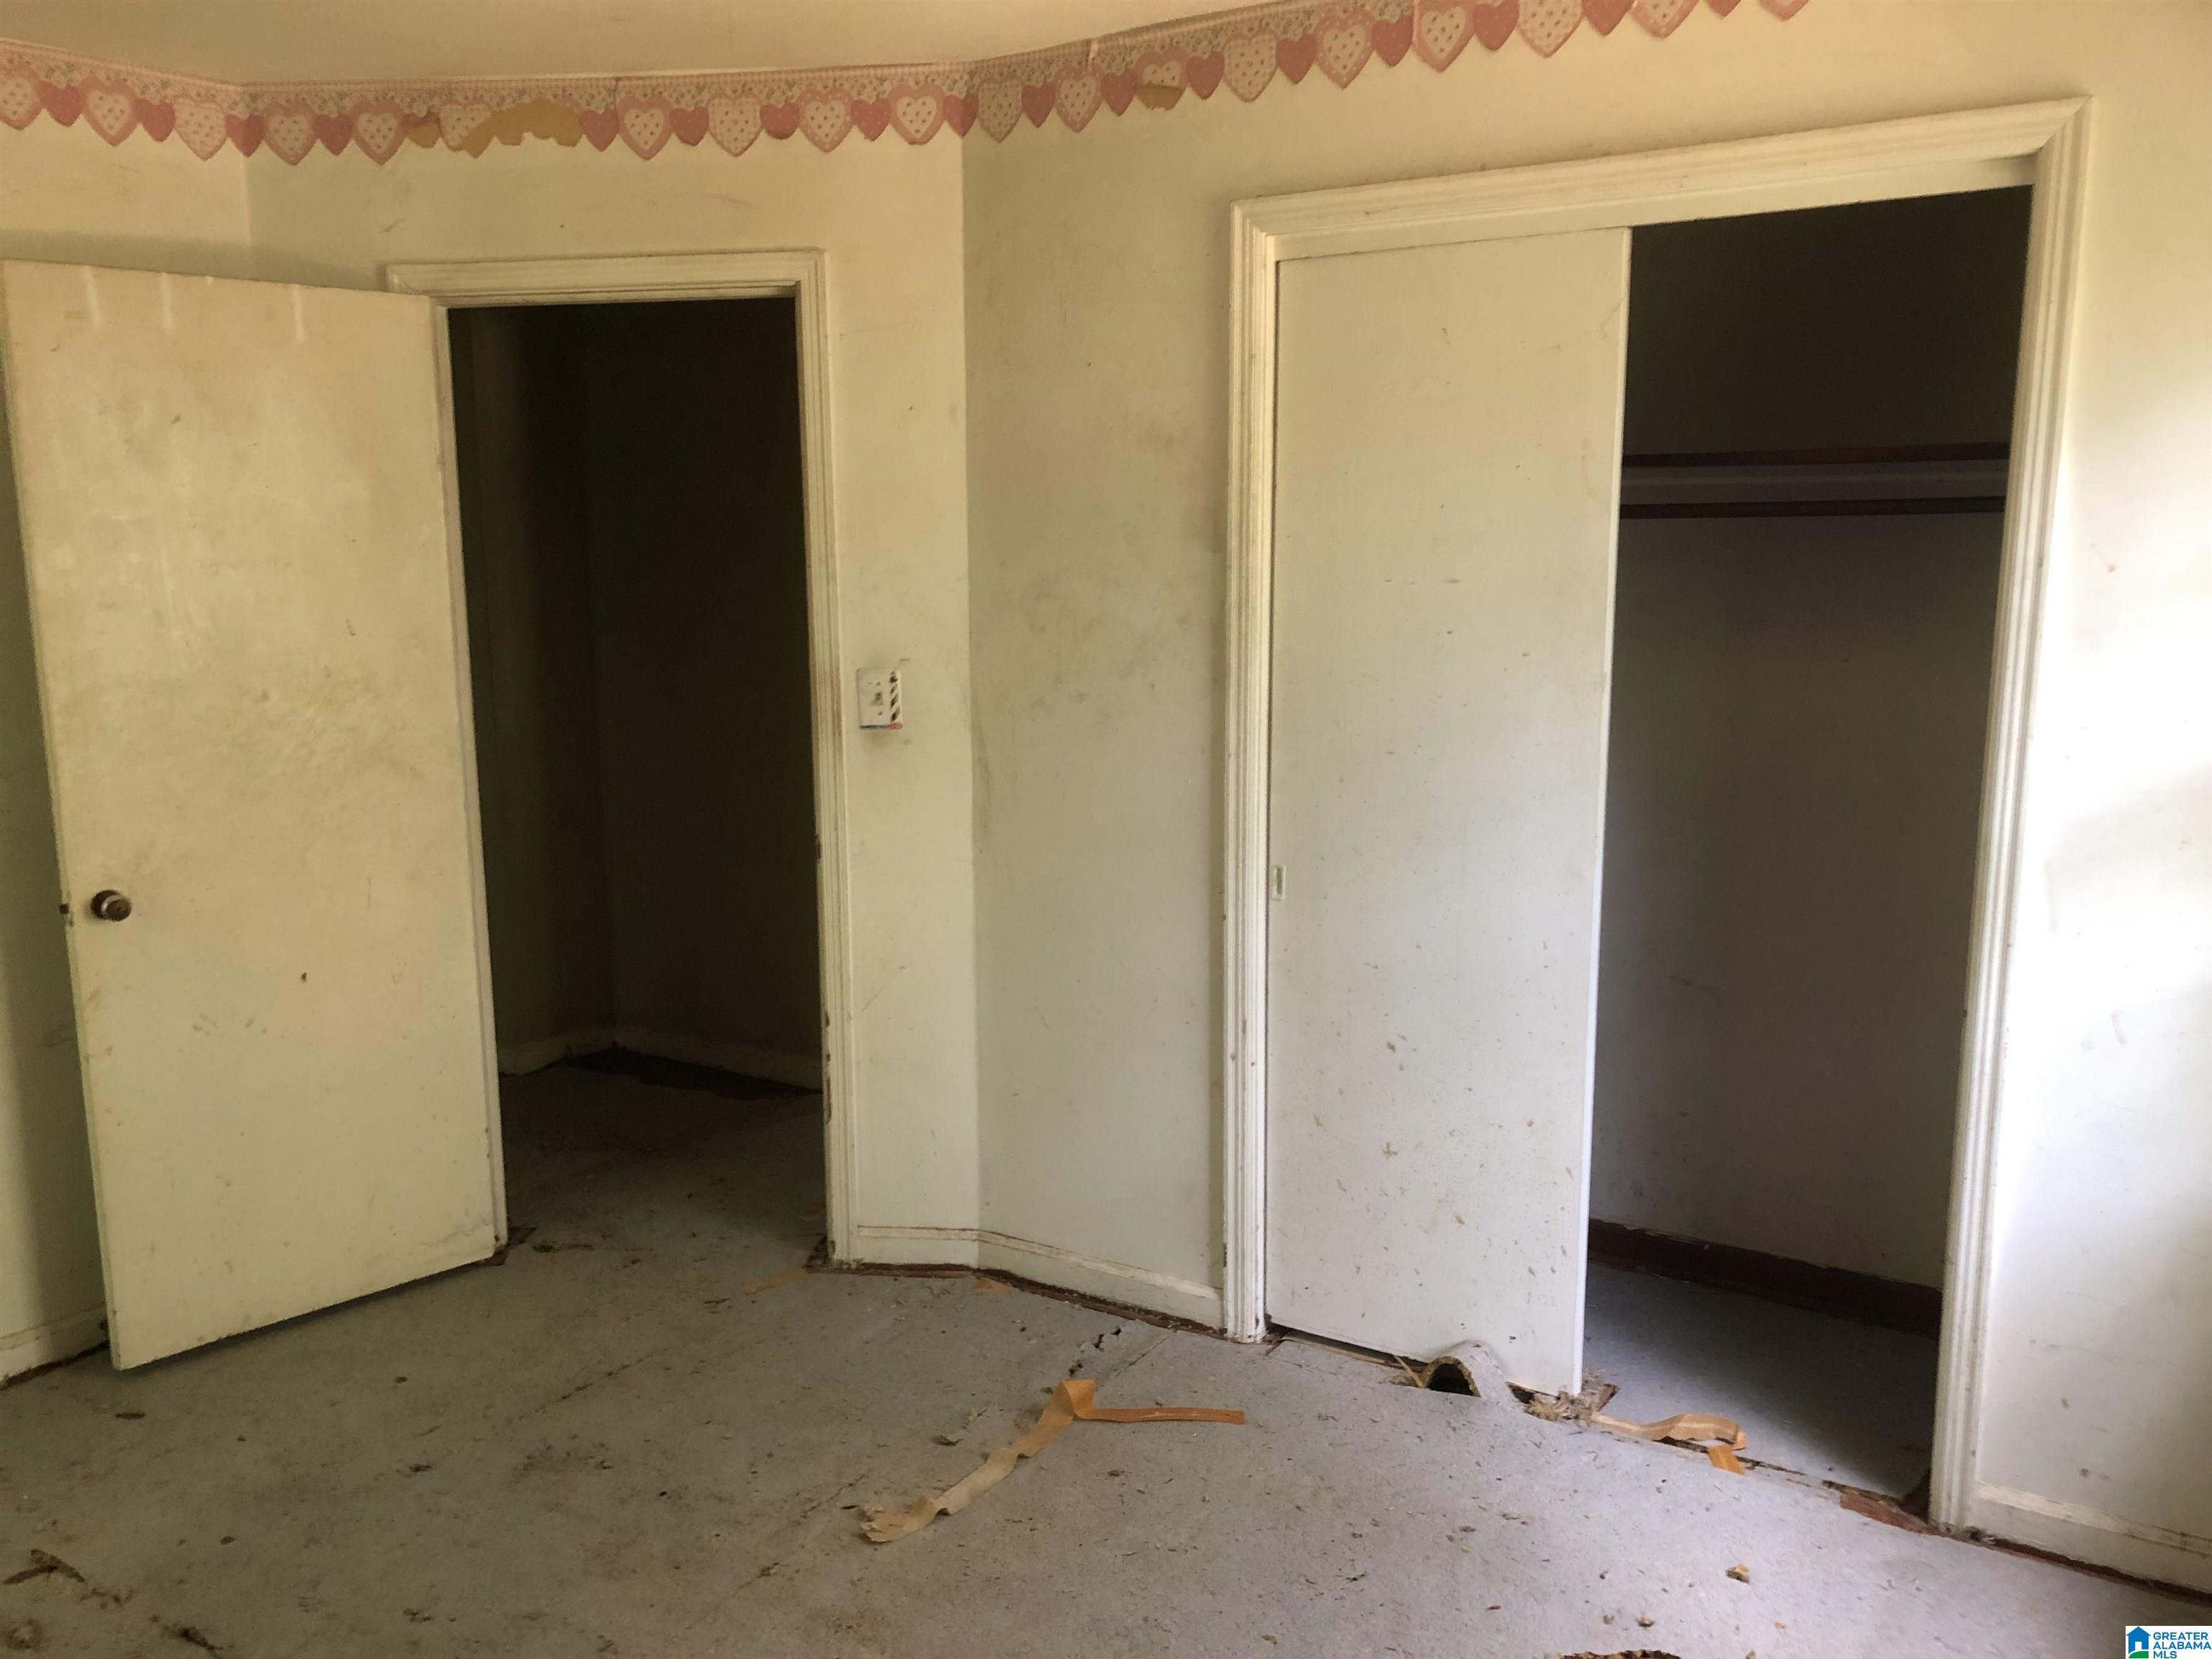
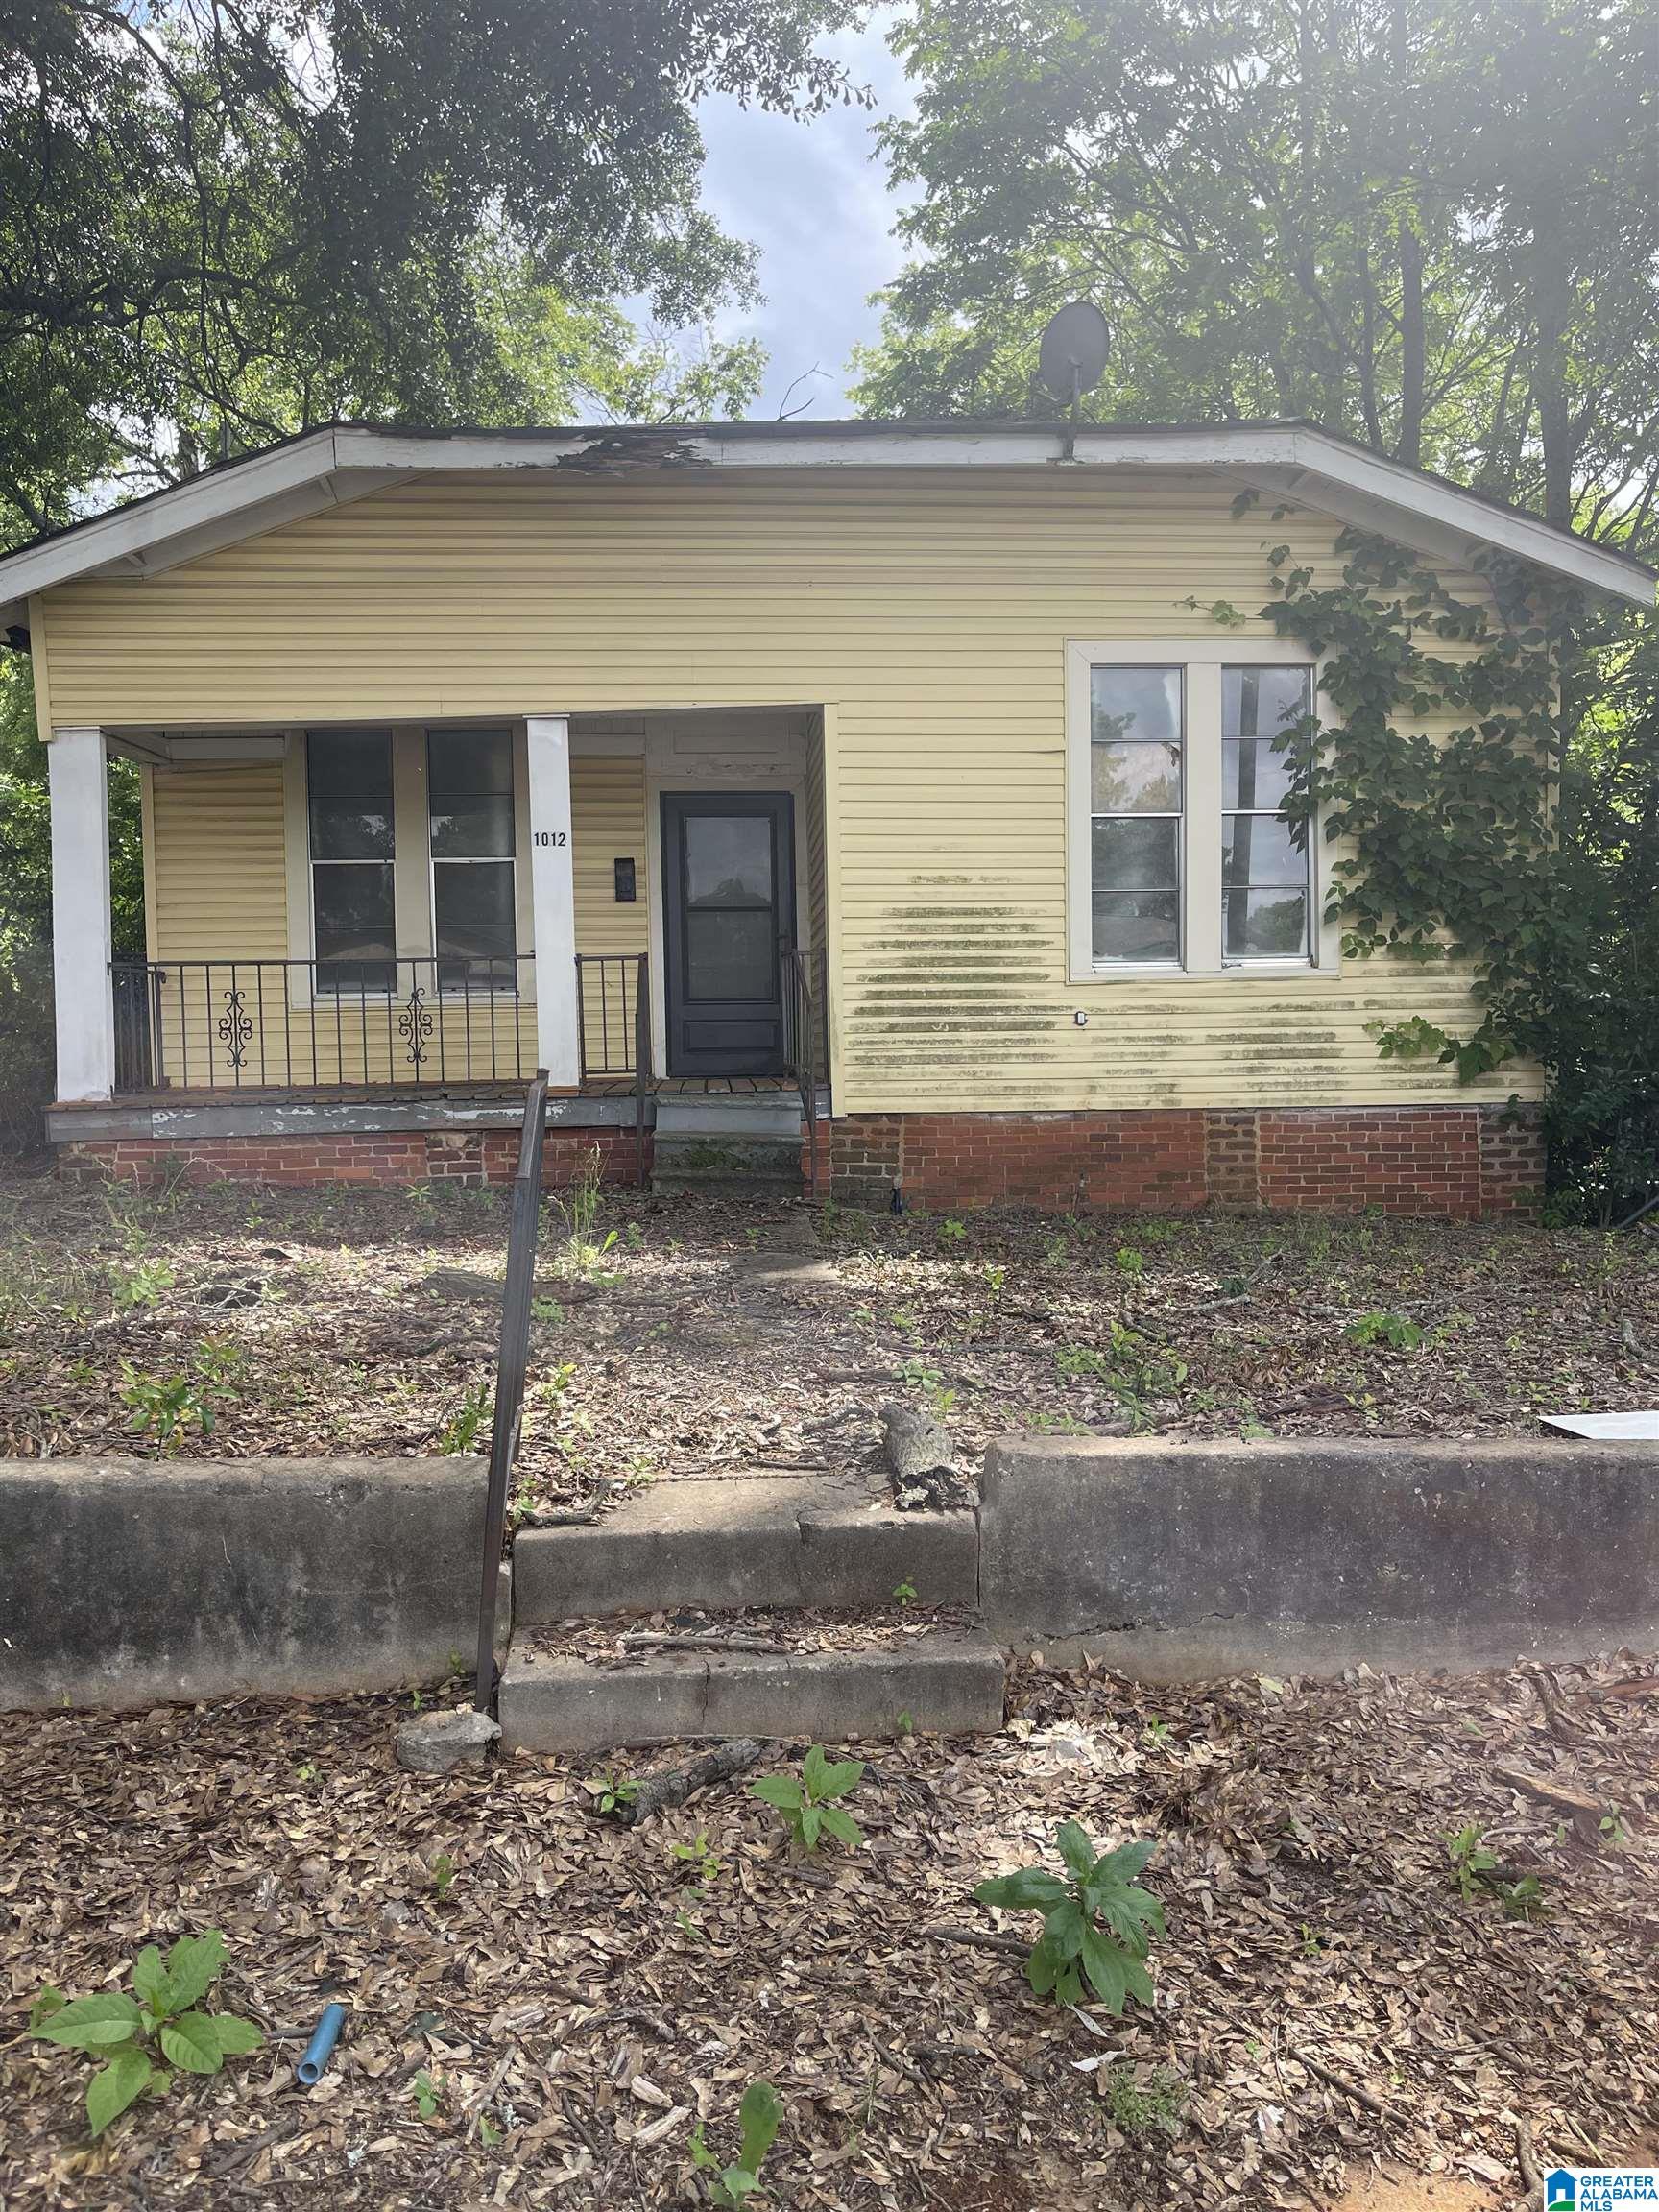
$65,000
3
bds
|
0
ba
|
1,110
sqft
|
built
1910
1012 15th St SW, Birmingham, AL 35211
$759
Cash flow
13.6%
Cash-on-Cash Return
14.0%
Cap rate
1.7%
Rent to Value Ratio
923 out of 1,038 properties for sale in Birmingham, AL
Limited Results Shown
Create a free account, or log in to reveal all property listings and enjoy the complete experience.
Active under contract
$179,000
3
bds
|
0
ba
|
1,460
sqft
|
built
1977
1755 Sonia Dr, Birmingham, AL 35235
$167
Cash flow
4.9%
Cash-on-Cash Return
7.4%
Cap rate
0.9%
Rent to Value Ratio
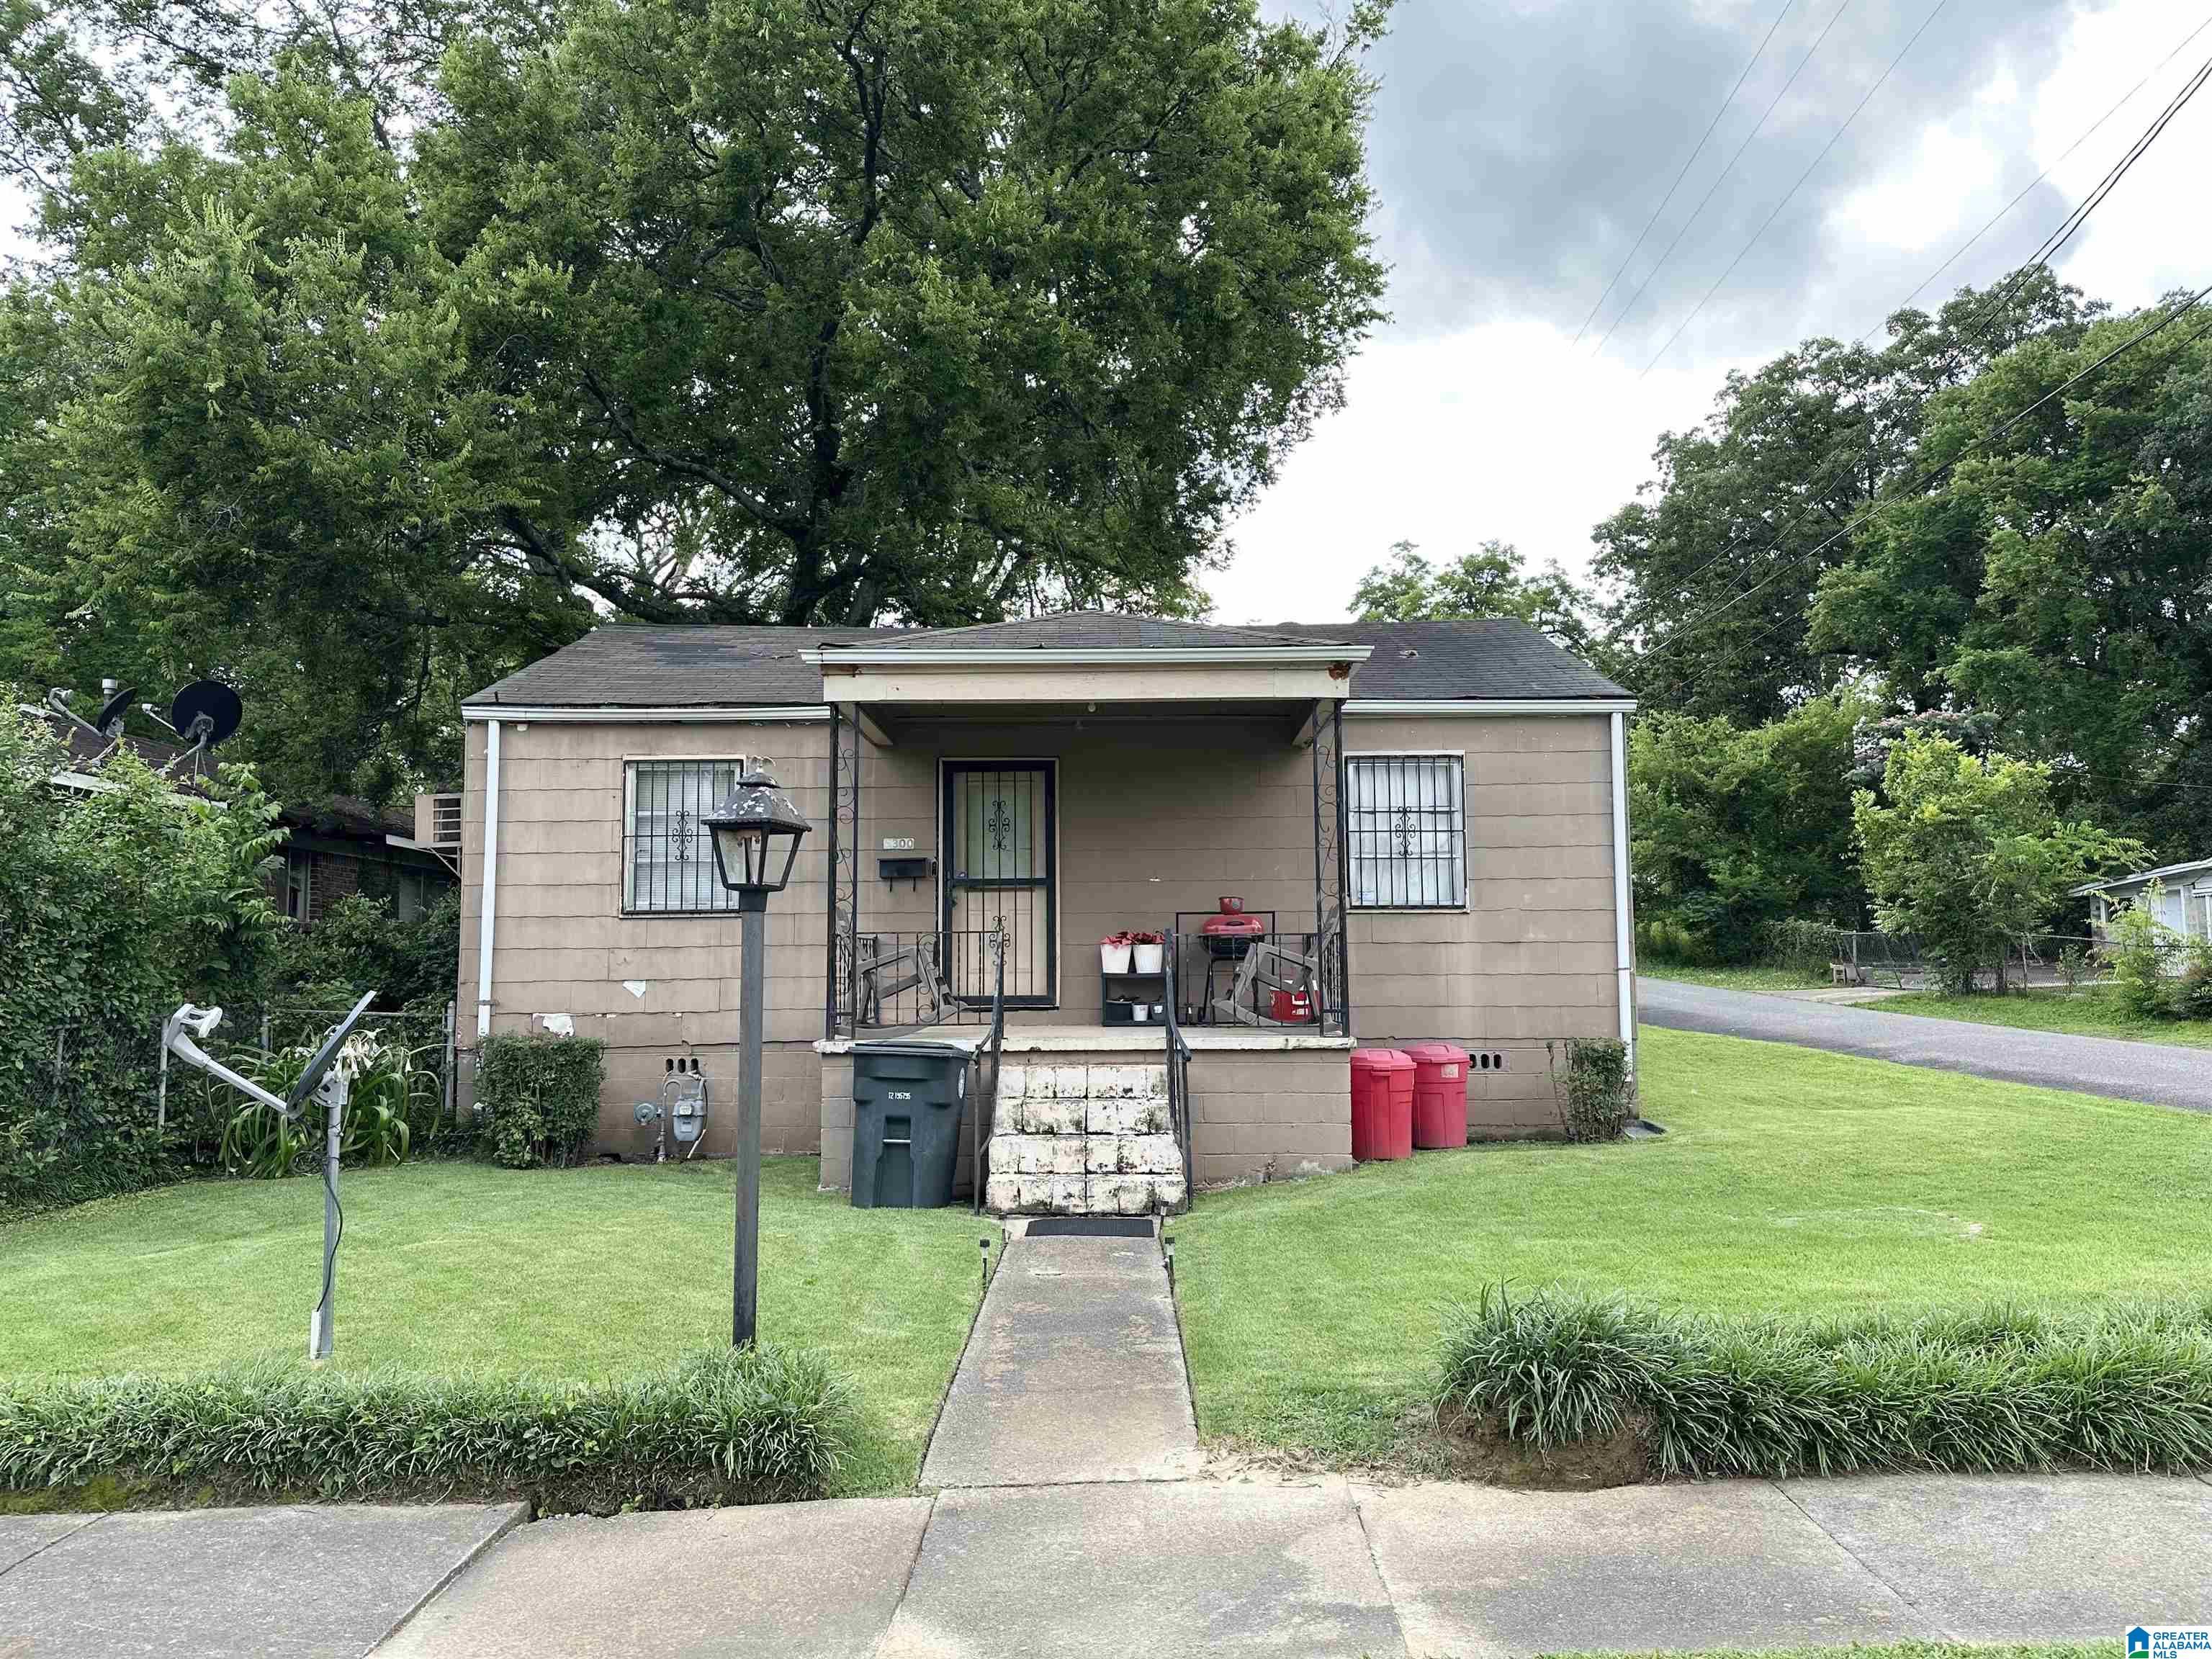
Active
$59,900
2
bds
|
0
ba
|
846
sqft
|
built
1950
5300 Terrace J, Birmingham, AL 35208
$759
Cash flow
14.8%
Cash-on-Cash Return
15.2%
Cap rate
1.8%
Rent to Value Ratio
Active
$599,000
4
bds
|
0
ba
|
3,033
sqft
|
built
2021
249 Griffin Park Trce, Birmingham, AL 35242
$-822
Cash flow
-7.2%
Cash-on-Cash Return
4.6%
Cap rate
0.6%
Rent to Value Ratio
Active
$139,900
4
bds
|
0
ba
|
1,312
sqft
|
built
1956
100 Lawson Dr, Birmingham, AL 35215
$164
Cash flow
6.1%
Cash-on-Cash Return
7.7%
Cap rate
0.9%
Rent to Value Ratio
Active
$150,000
4
bds
|
0
ba
|
1,283
sqft
|
built
1952
4228 12th Ct N, Birmingham, AL 35212
$-27
Cash flow
-0.9%
Cash-on-Cash Return
6.1%
Cap rate
0.7%
Rent to Value Ratio
Active
$265,000
3
bds
|
0
ba
|
1,468
sqft
|
built
1968
1712 34th Pl N, Birmingham, AL 35234
$-629
Cash flow
-12.4%
Cash-on-Cash Return
3.4%
Cap rate
0.4%
Rent to Value Ratio
Active
$224,900
4
bds
|
0
ba
|
1,696
sqft
|
built
1986
1742 Molly Ln, Birmingham, AL 35235
$64
Cash flow
1.5%
Cash-on-Cash Return
6.6%
Cap rate
0.8%
Rent to Value Ratio
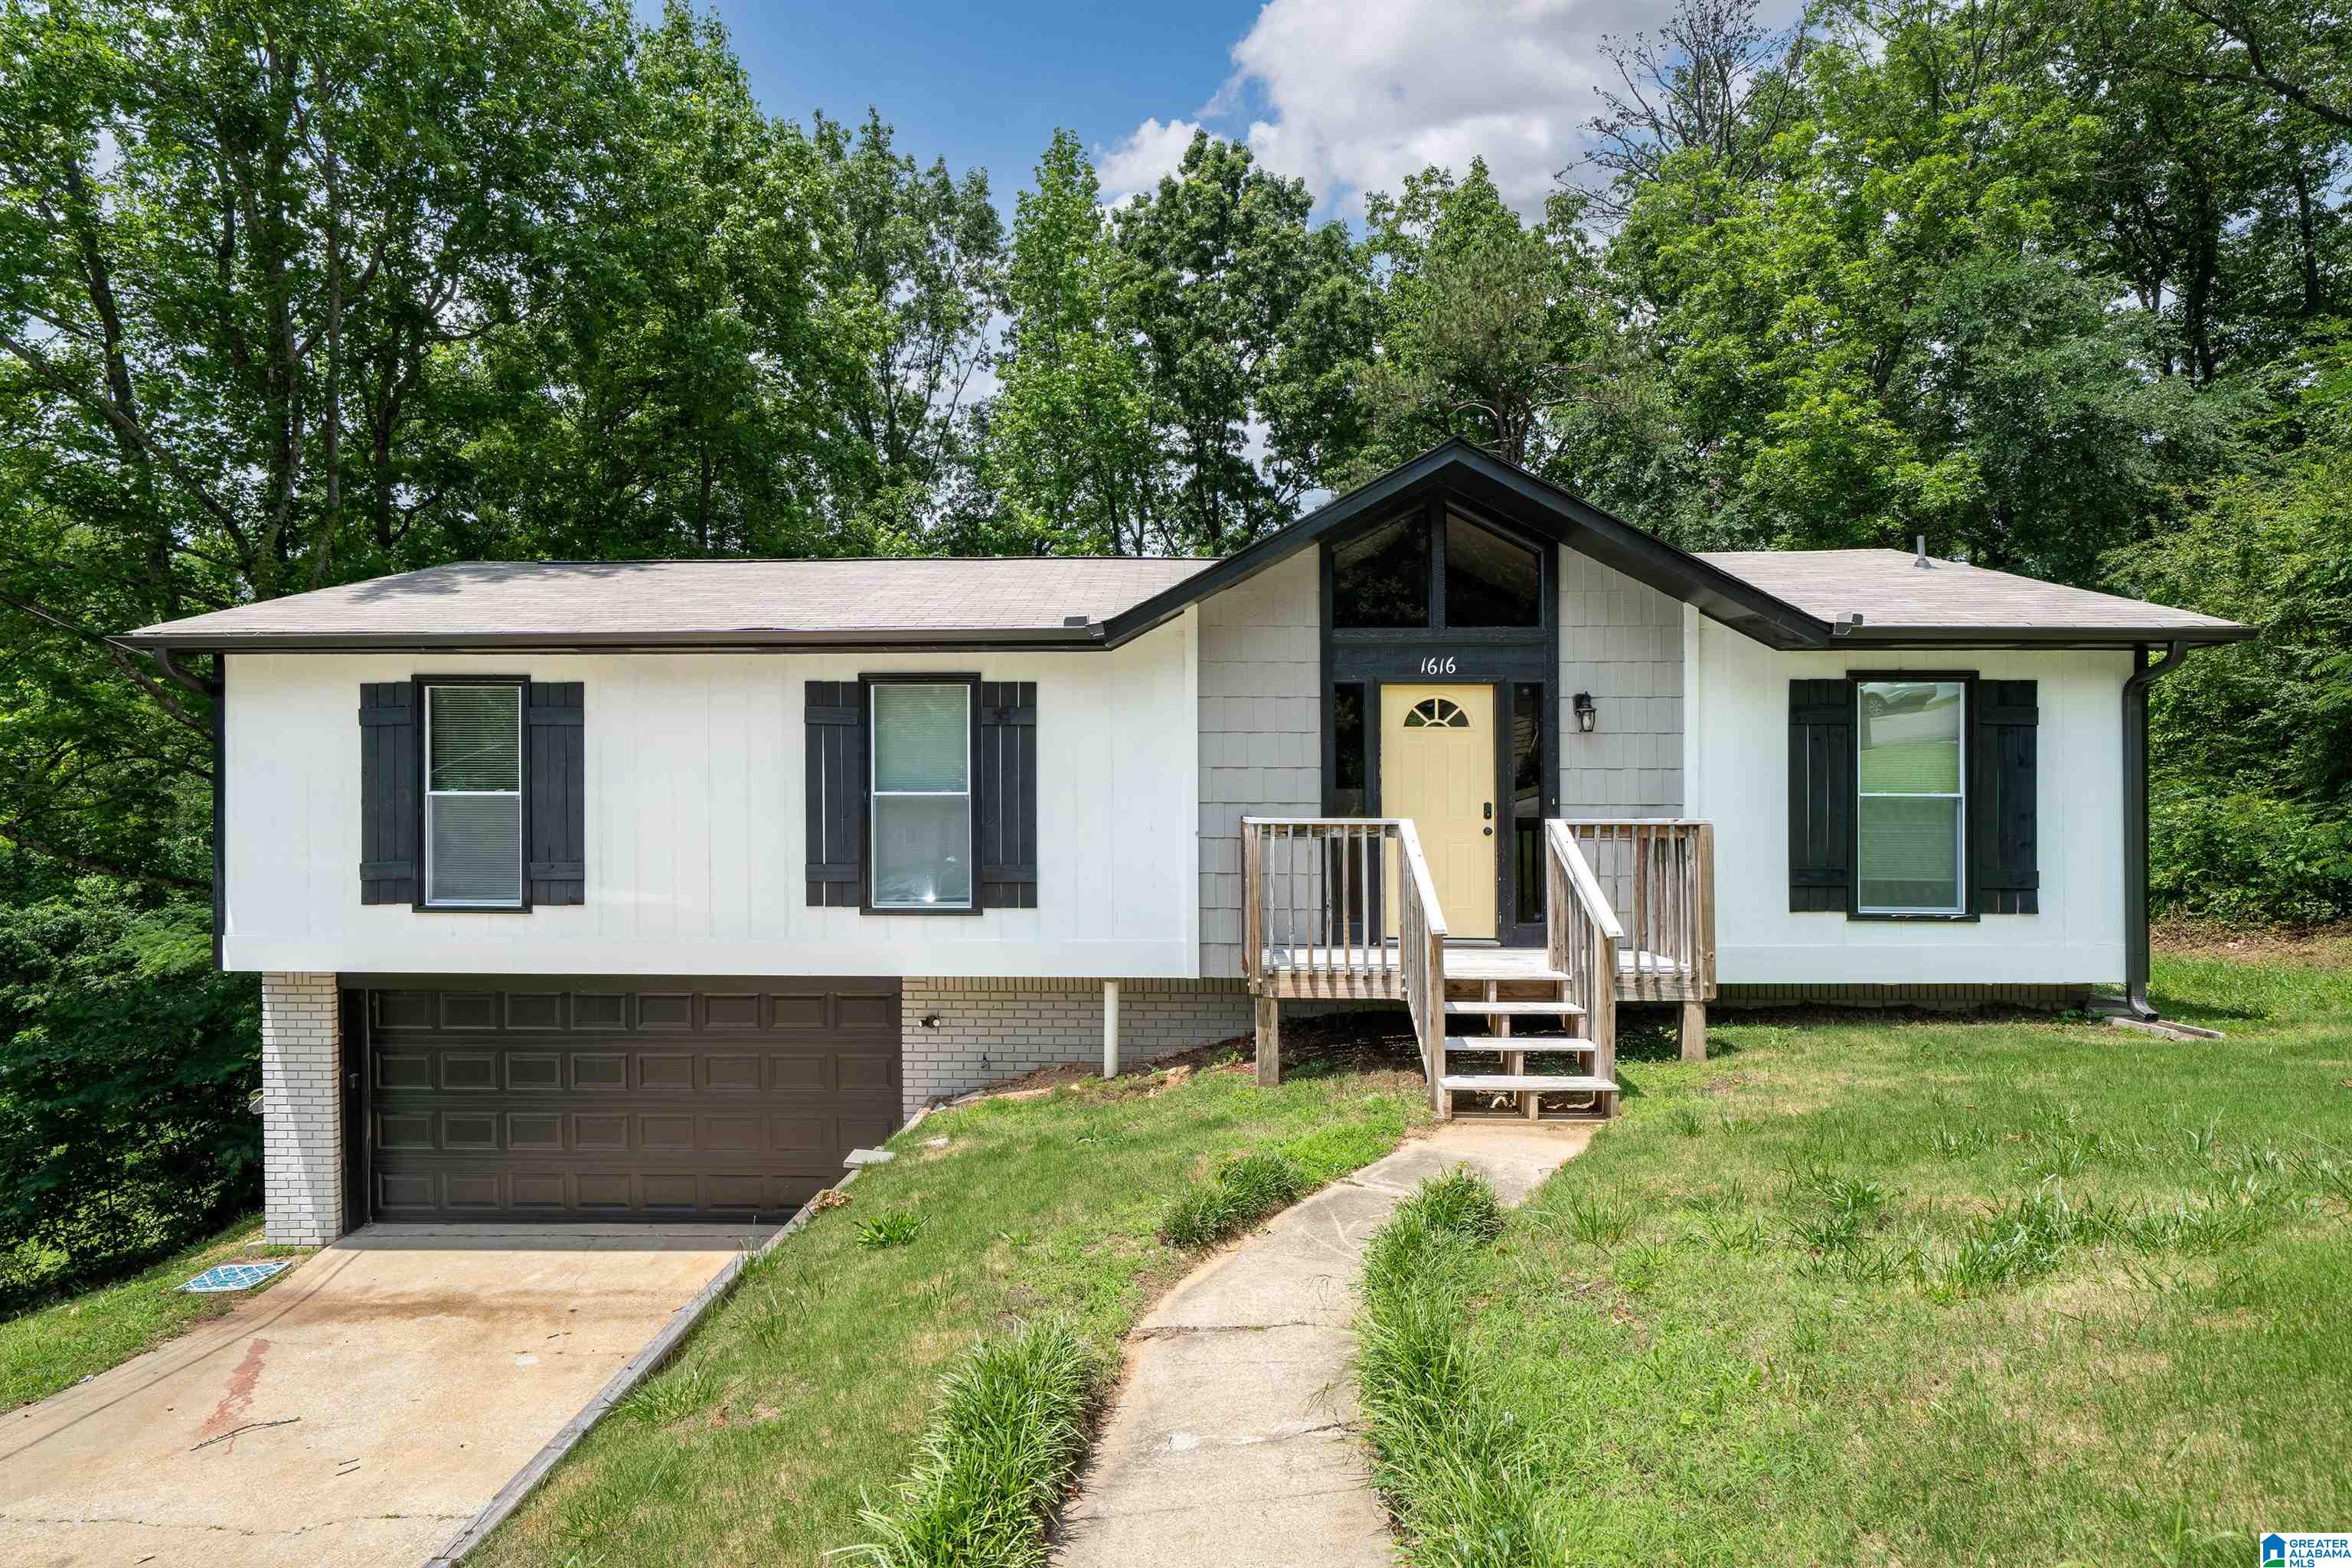
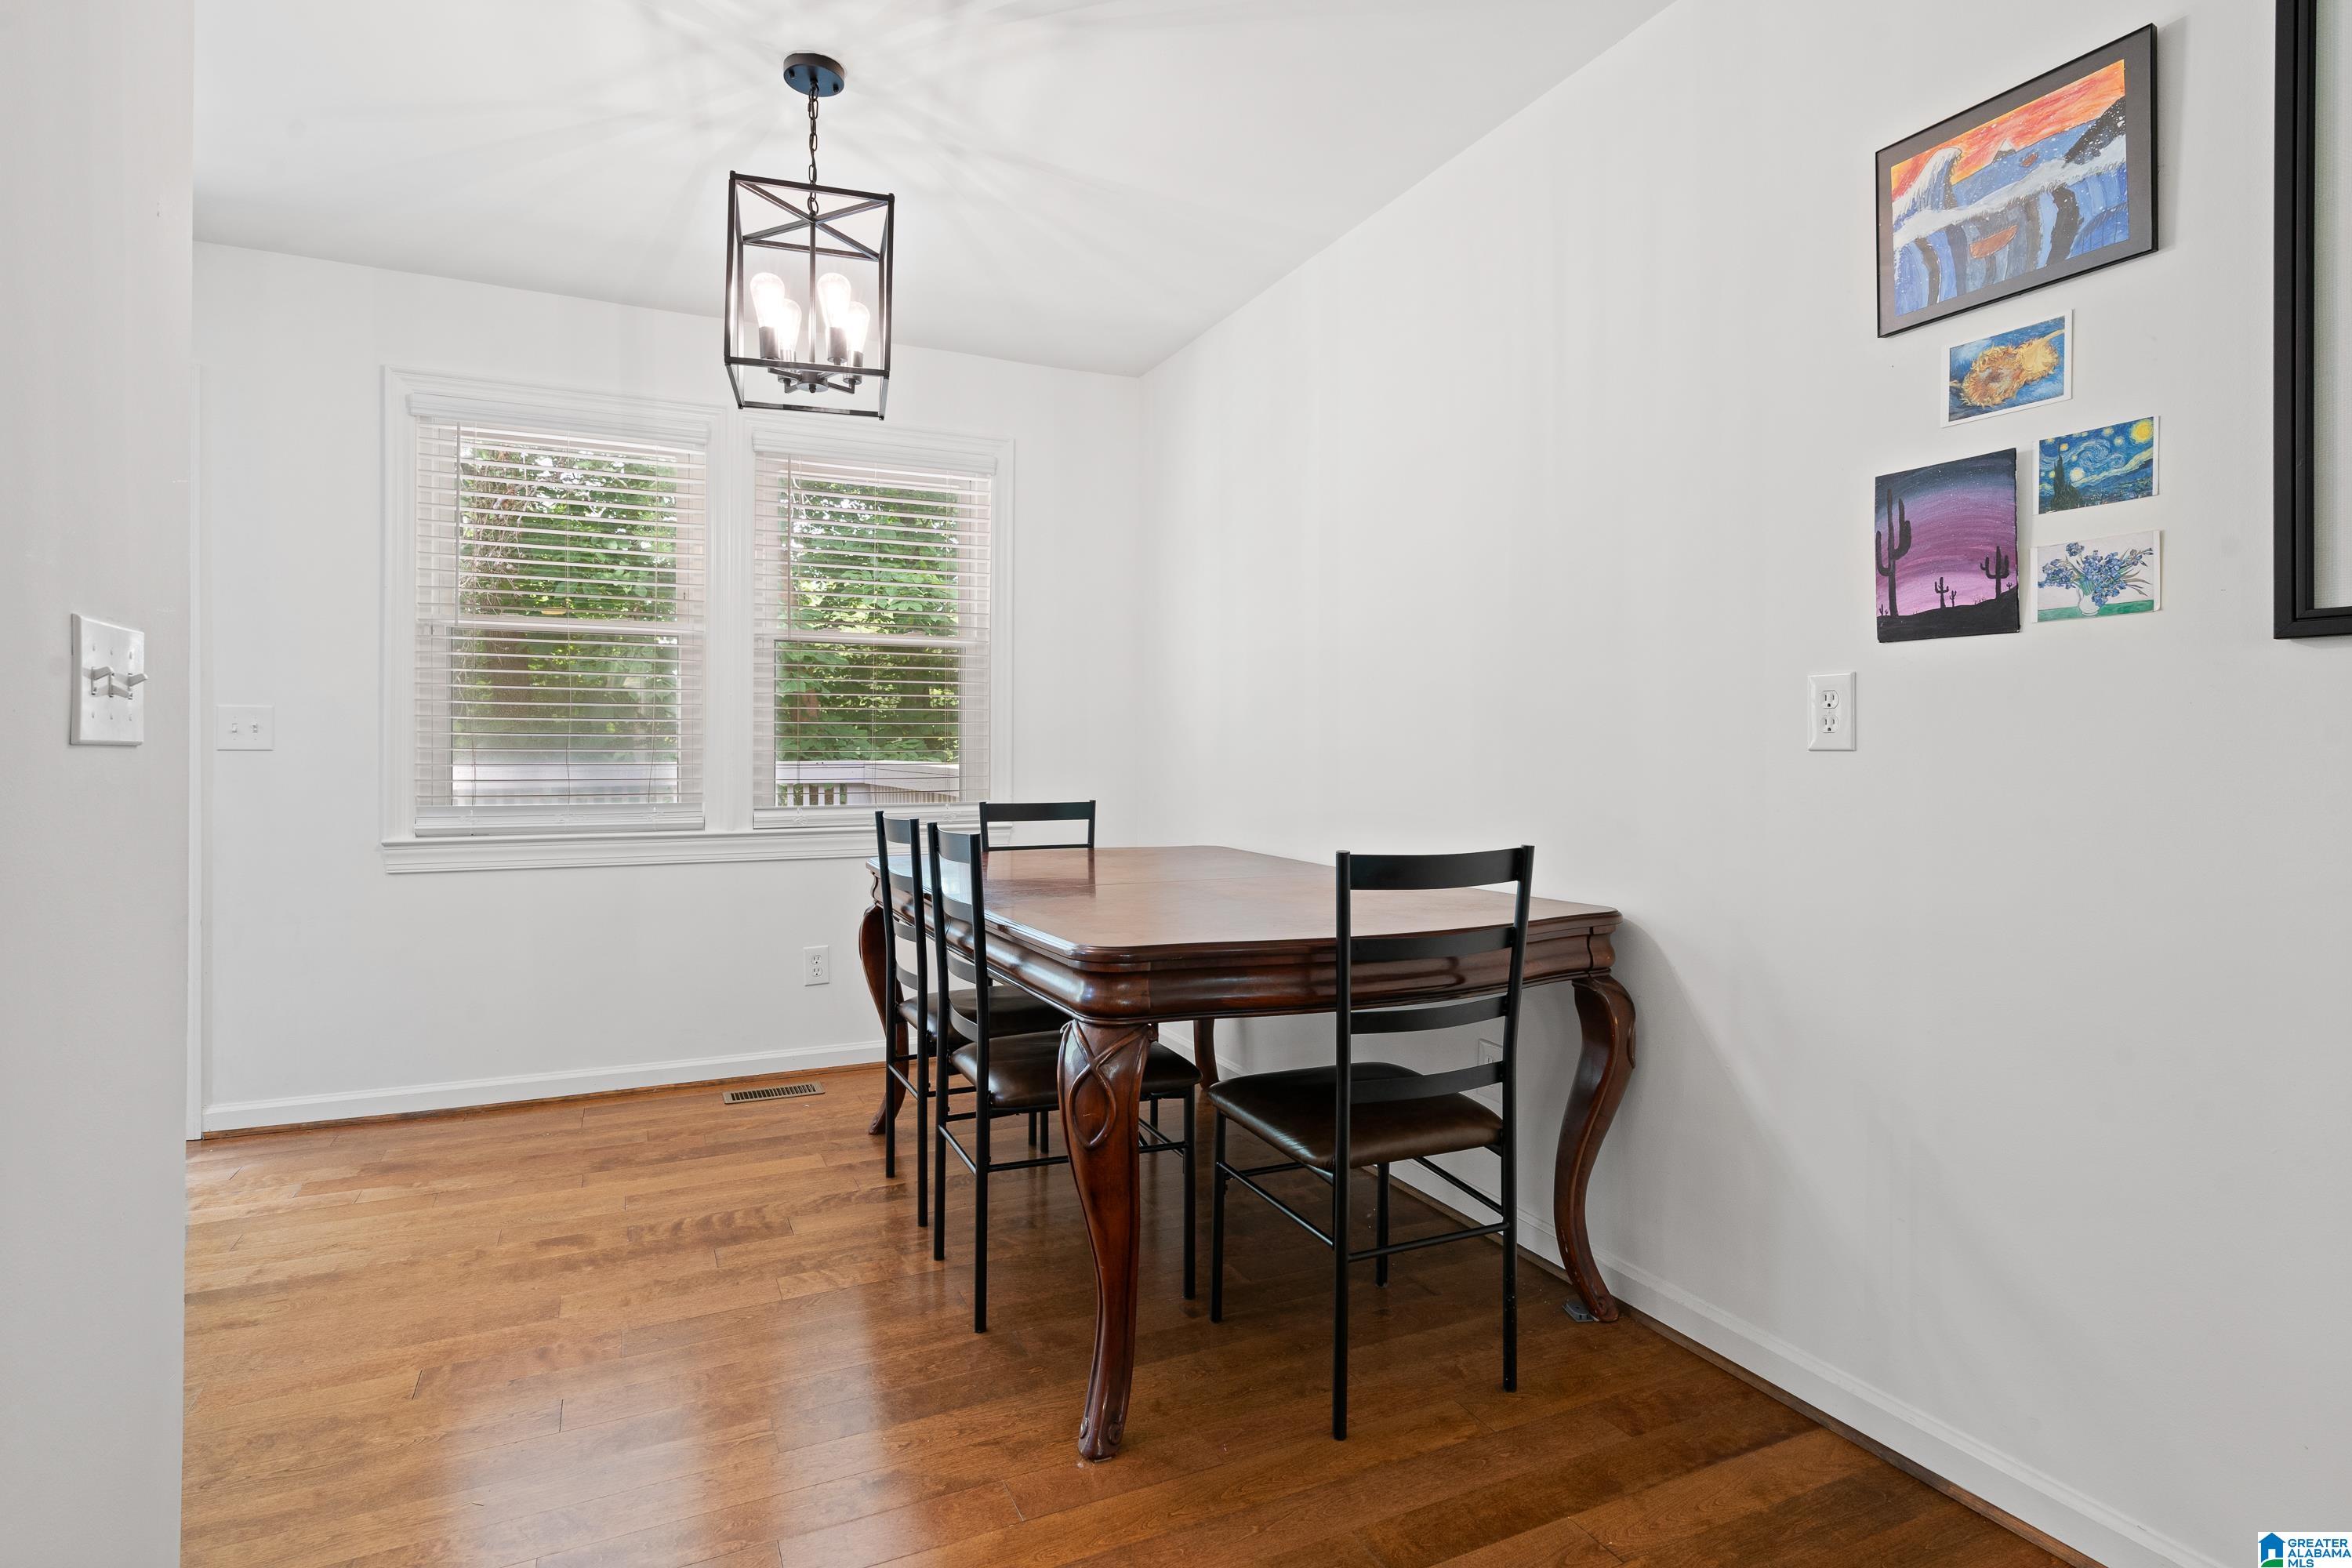
Active
$219,900
3
bds
|
0
ba
|
1,600
sqft
|
built
1978
1616 Sonia Dr, Birmingham, AL 35235
$21
Cash flow
0.5%
Cash-on-Cash Return
6.4%
Cap rate
0.8%
Rent to Value Ratio
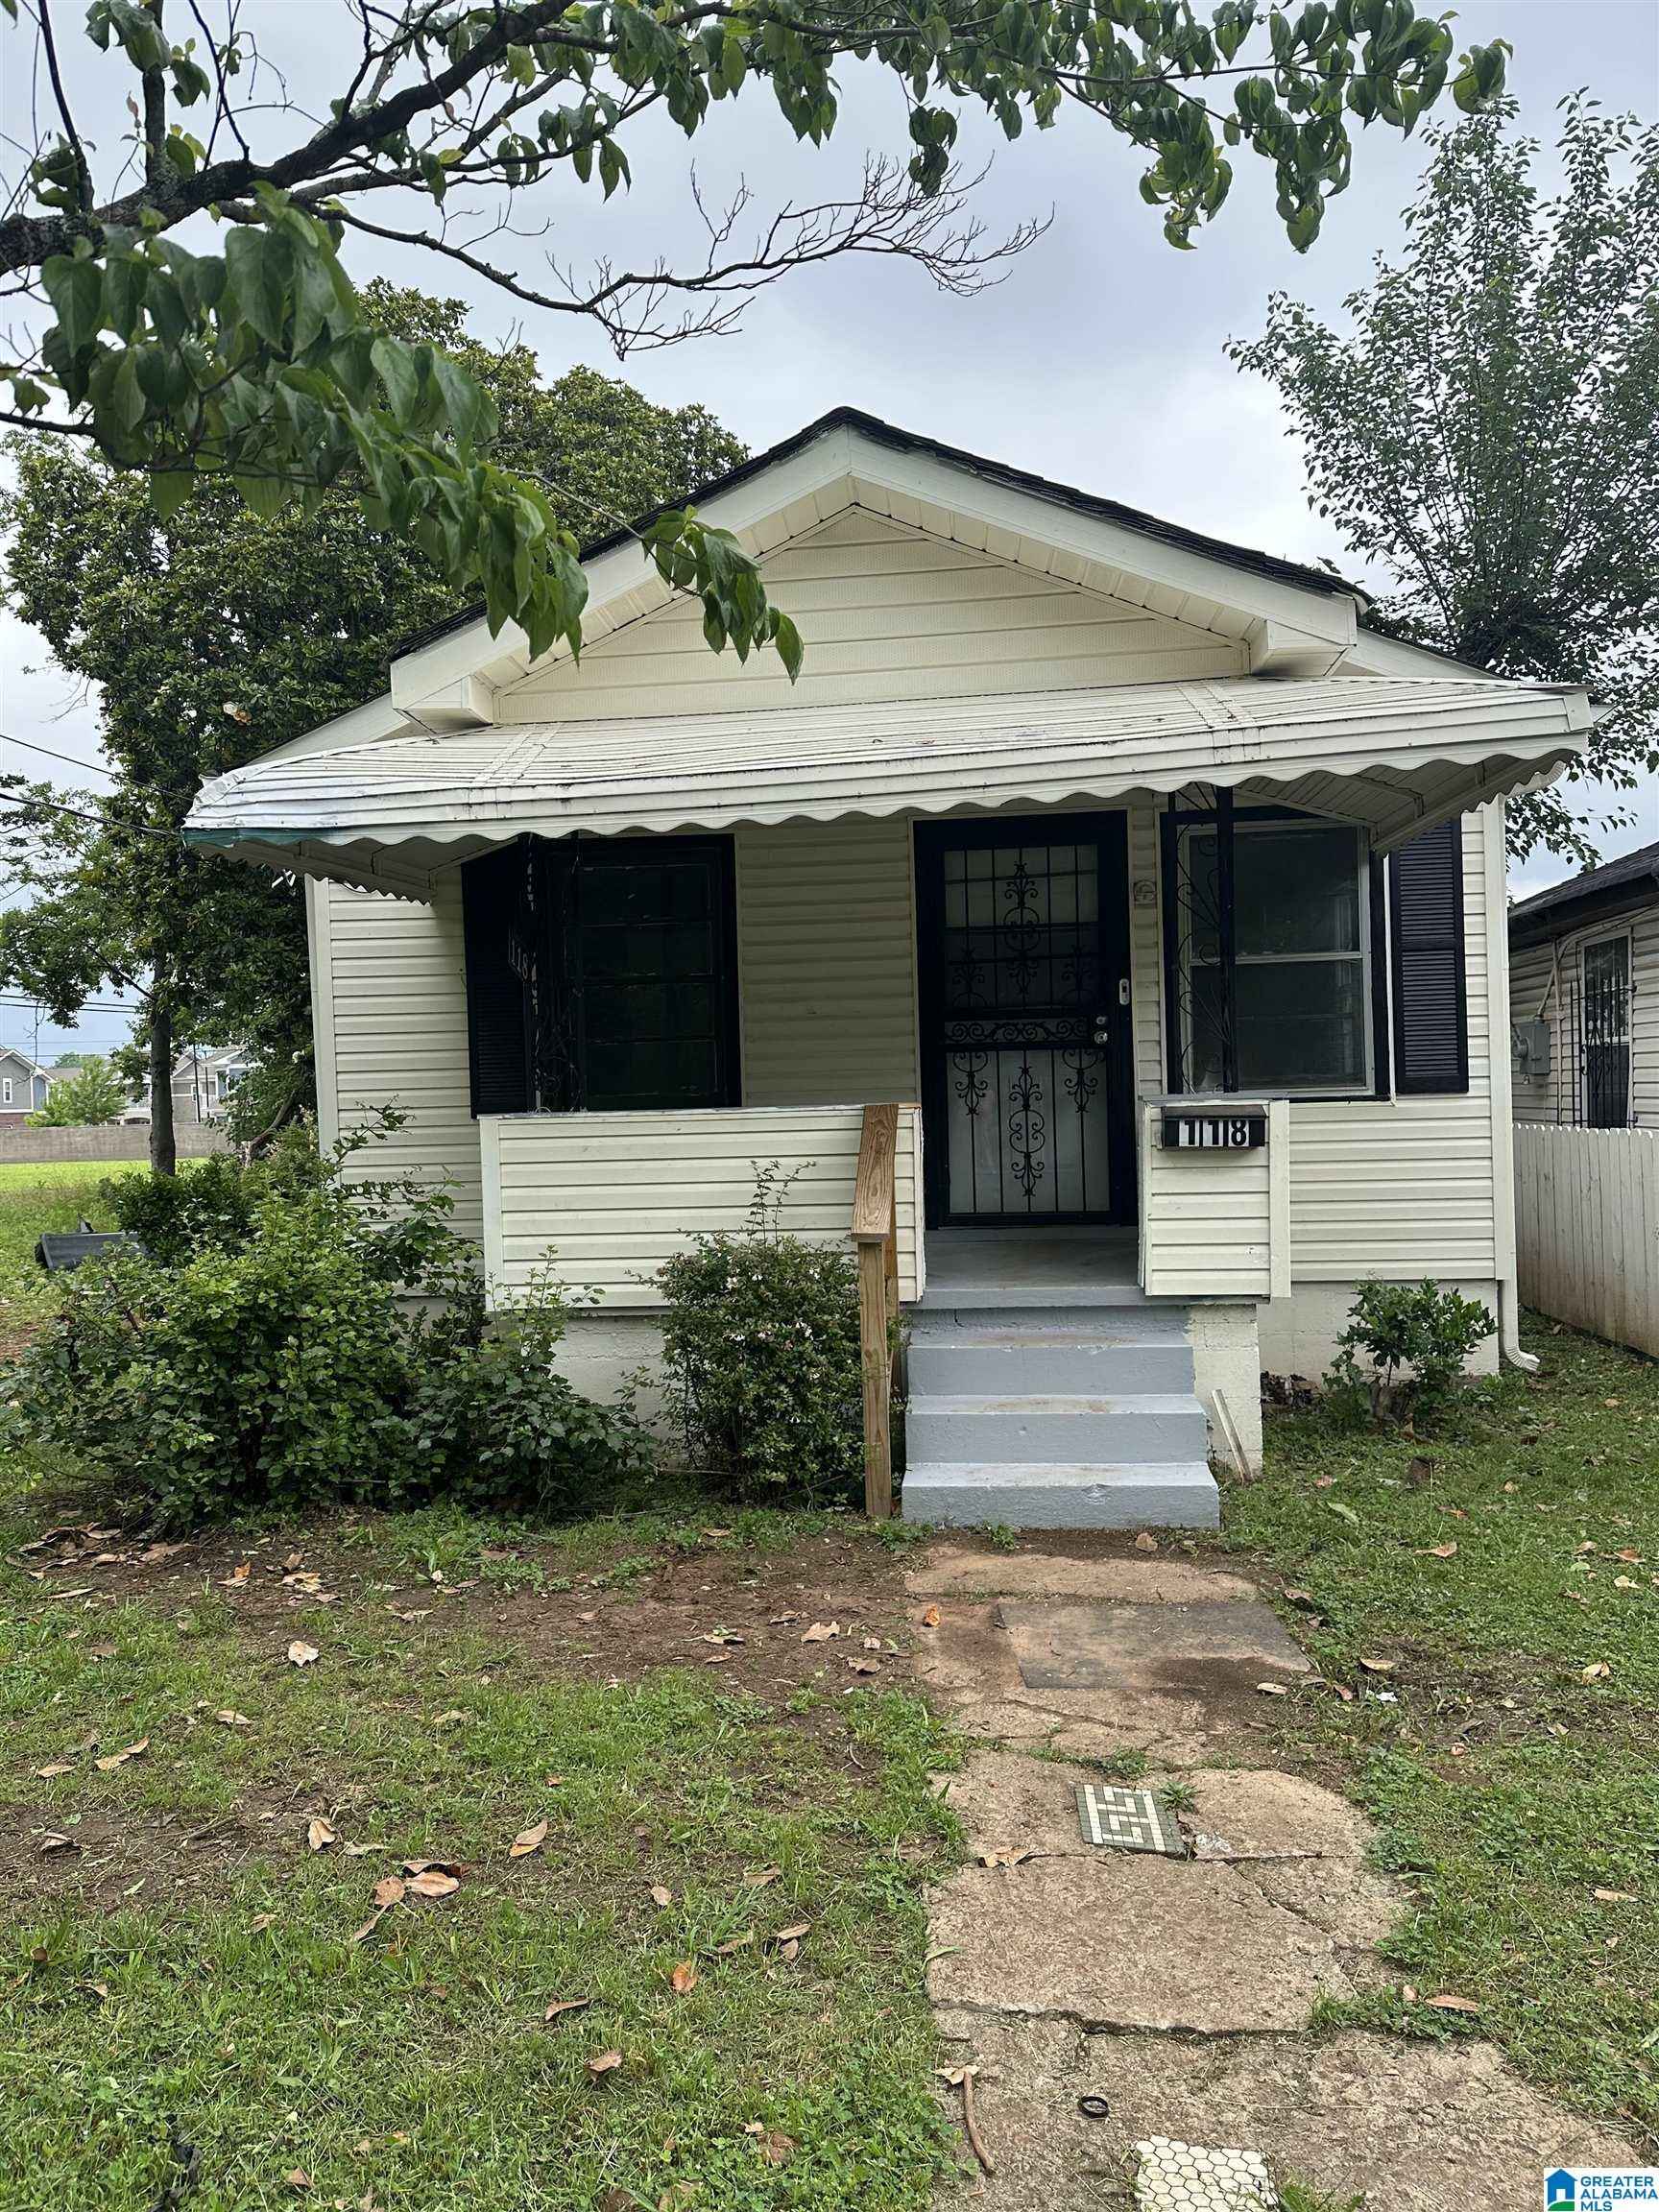
Active
$104,900
3
bds
|
0
ba
|
710
sqft
|
built
1956
118 3rd Ave SW, Birmingham, AL 35211
$210
Cash flow
10.4%
Cash-on-Cash Return
8.7%
Cap rate
1.0%
Rent to Value Ratio
Active
$125,000
3
bds
|
0
ba
|
1,344
sqft
|
built
1950
1213 Lafayette St, Birmingham, AL 35214
$104
Cash flow
4.3%
Cash-on-Cash Return
7.3%
Cap rate
0.9%
Rent to Value Ratio
Active
$119,900
3
bds
|
0
ba
|
1,456
sqft
|
built
1957
449 Henry St, Birmingham, AL 35214
$269
Cash flow
11.7%
Cash-on-Cash Return
9.0%
Cap rate
1.1%
Rent to Value Ratio
Active
$248,900
4
bds
|
0
ba
|
4,500
sqft
|
built
1967
176 Redstone Way, Birmingham, AL 35215
$-544
Cash flow
-11.4%
Cash-on-Cash Return
3.7%
Cap rate
0.4%
Rent to Value Ratio
Active
$300,000
2
bds
|
0
ba
|
1,136
sqft
|
built
1913
2024 2nd Ave N, Birmingham, AL 35203
$-680
Cash flow
-11.8%
Cash-on-Cash Return
3.6%
Cap rate
0.7%
Rent to Value Ratio
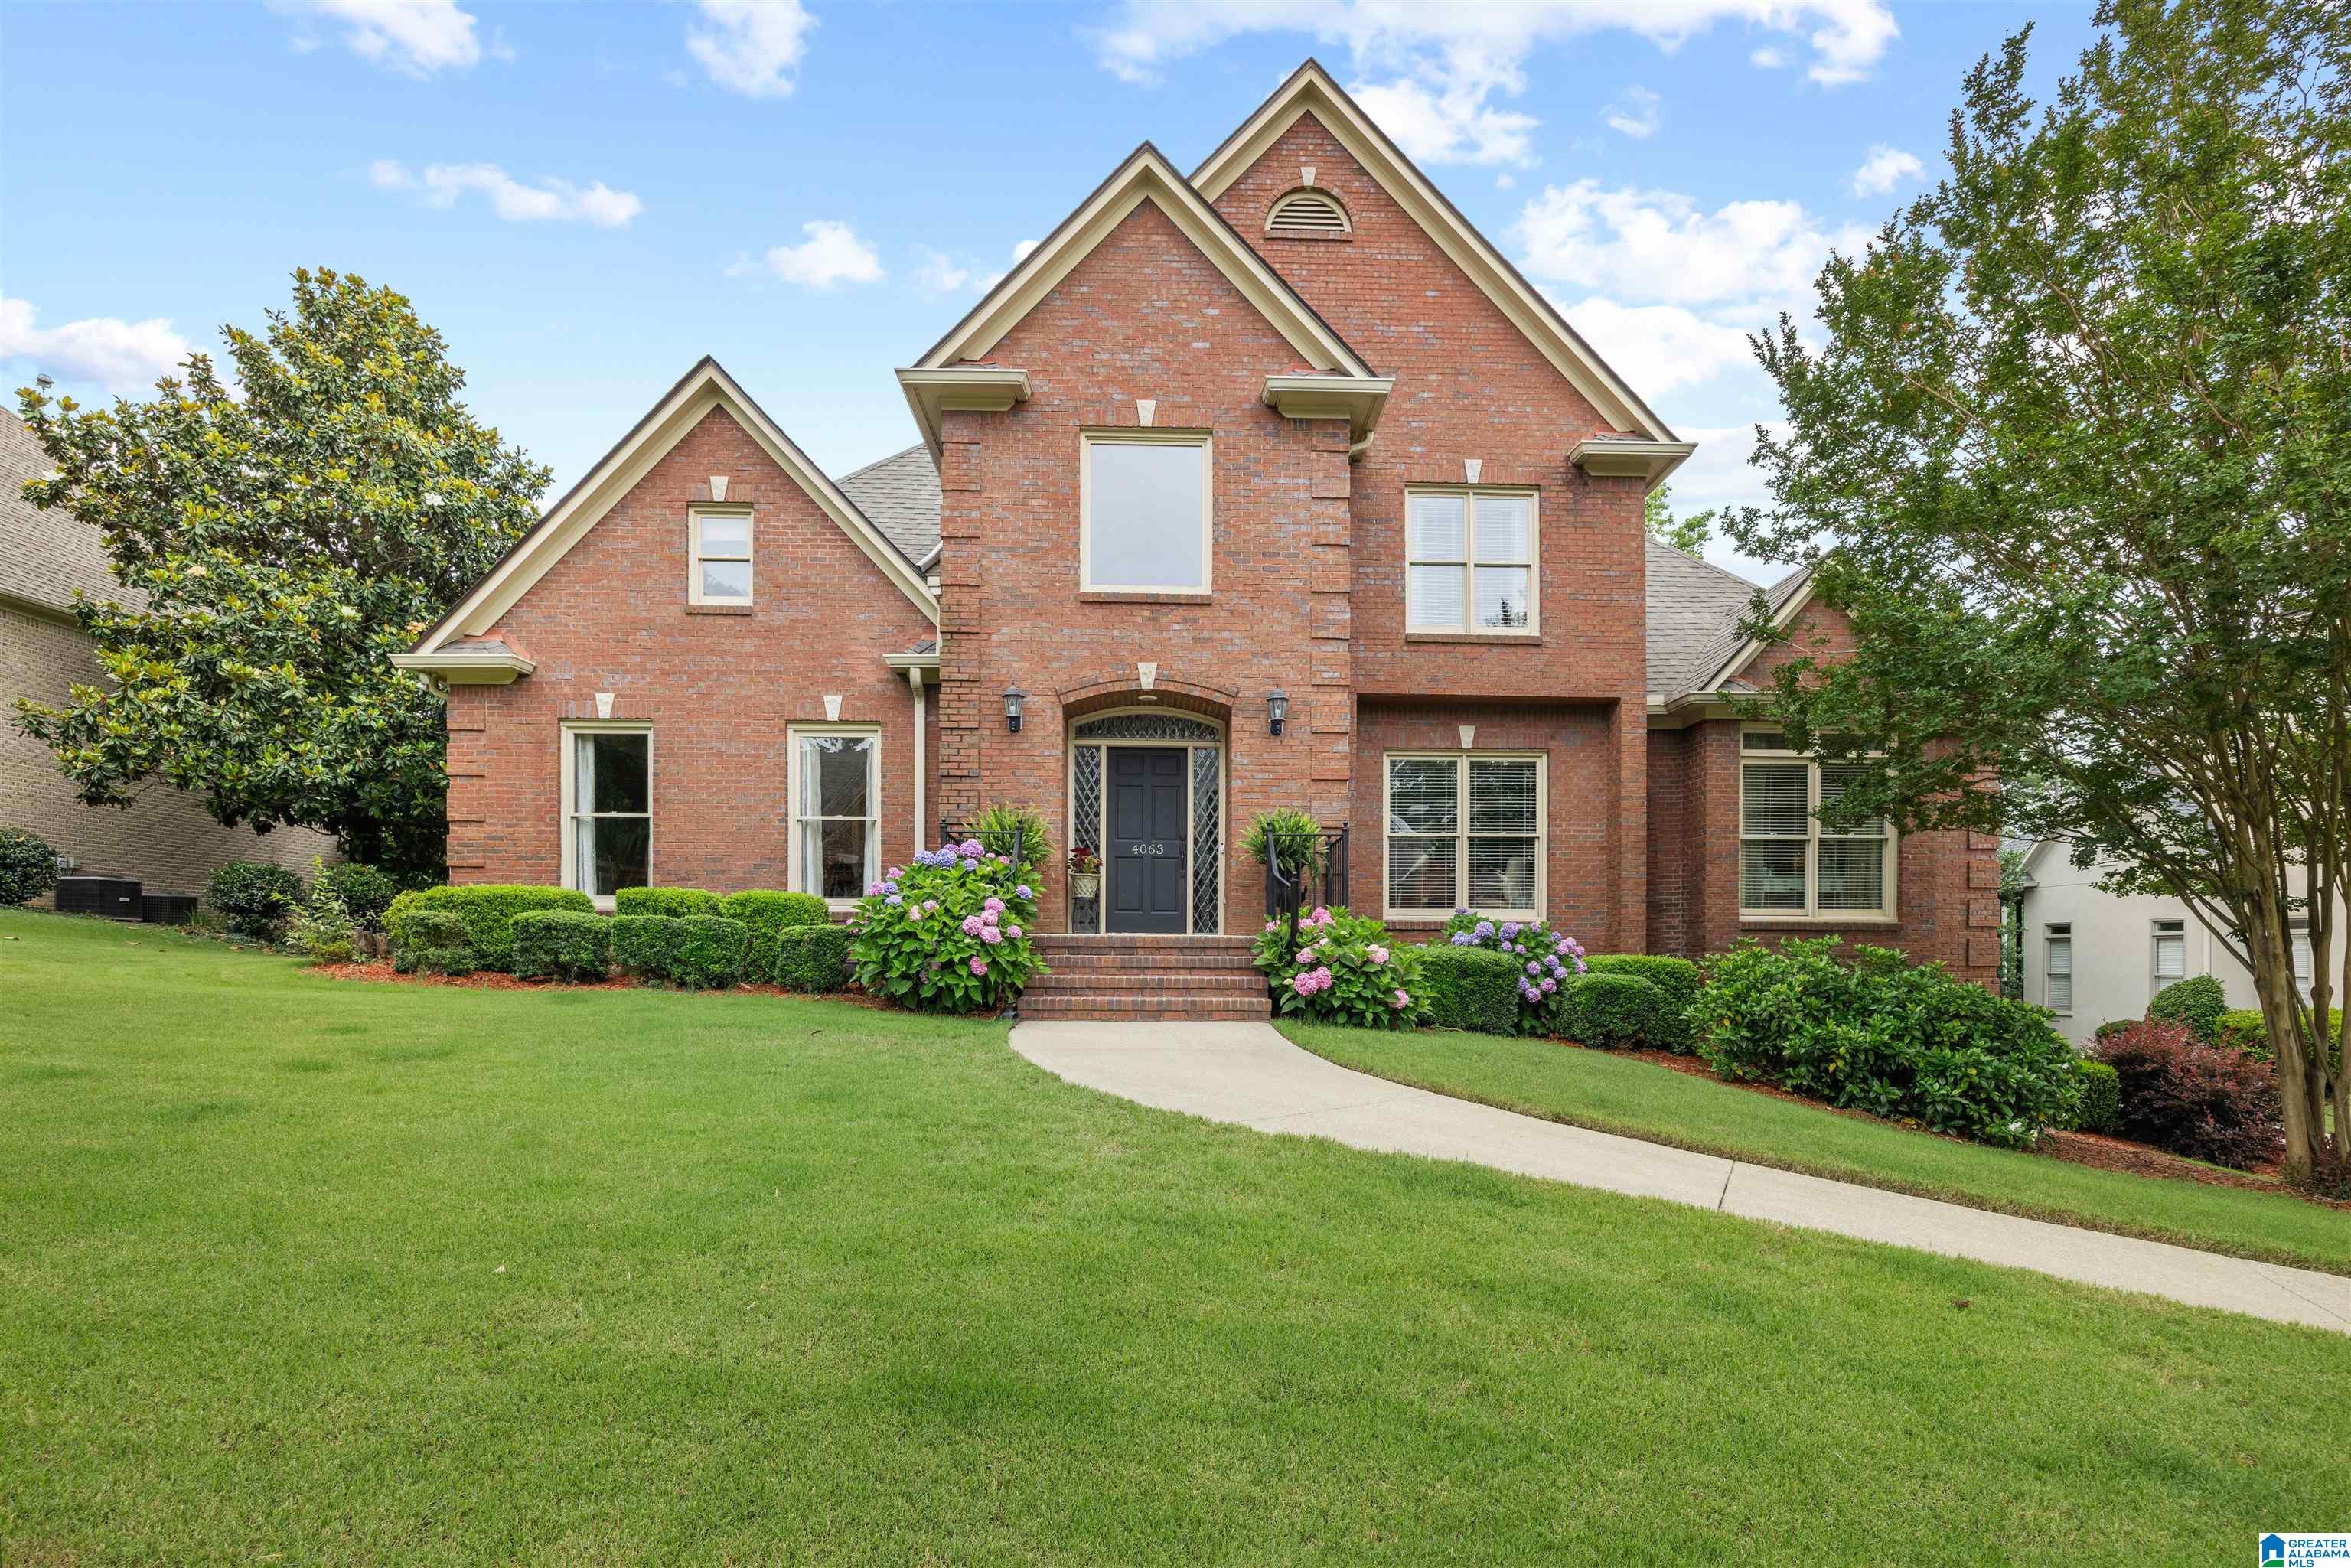
Active
$735,000
4
bds
|
0
ba
|
4,047
sqft
|
built
1996
4063 Milners Cres, Birmingham, AL 35242
$-1,440
Cash flow
-10.2%
Cash-on-Cash Return
3.9%
Cap rate
0.5%
Rent to Value Ratio
Active
$534,900
4
bds
|
0
ba
|
2,525
sqft
|
built
1992
4552 Magnolia Dr, Birmingham, AL 35242
$-680
Cash flow
-6.6%
Cash-on-Cash Return
4.8%
Cap rate
0.6%
Rent to Value Ratio
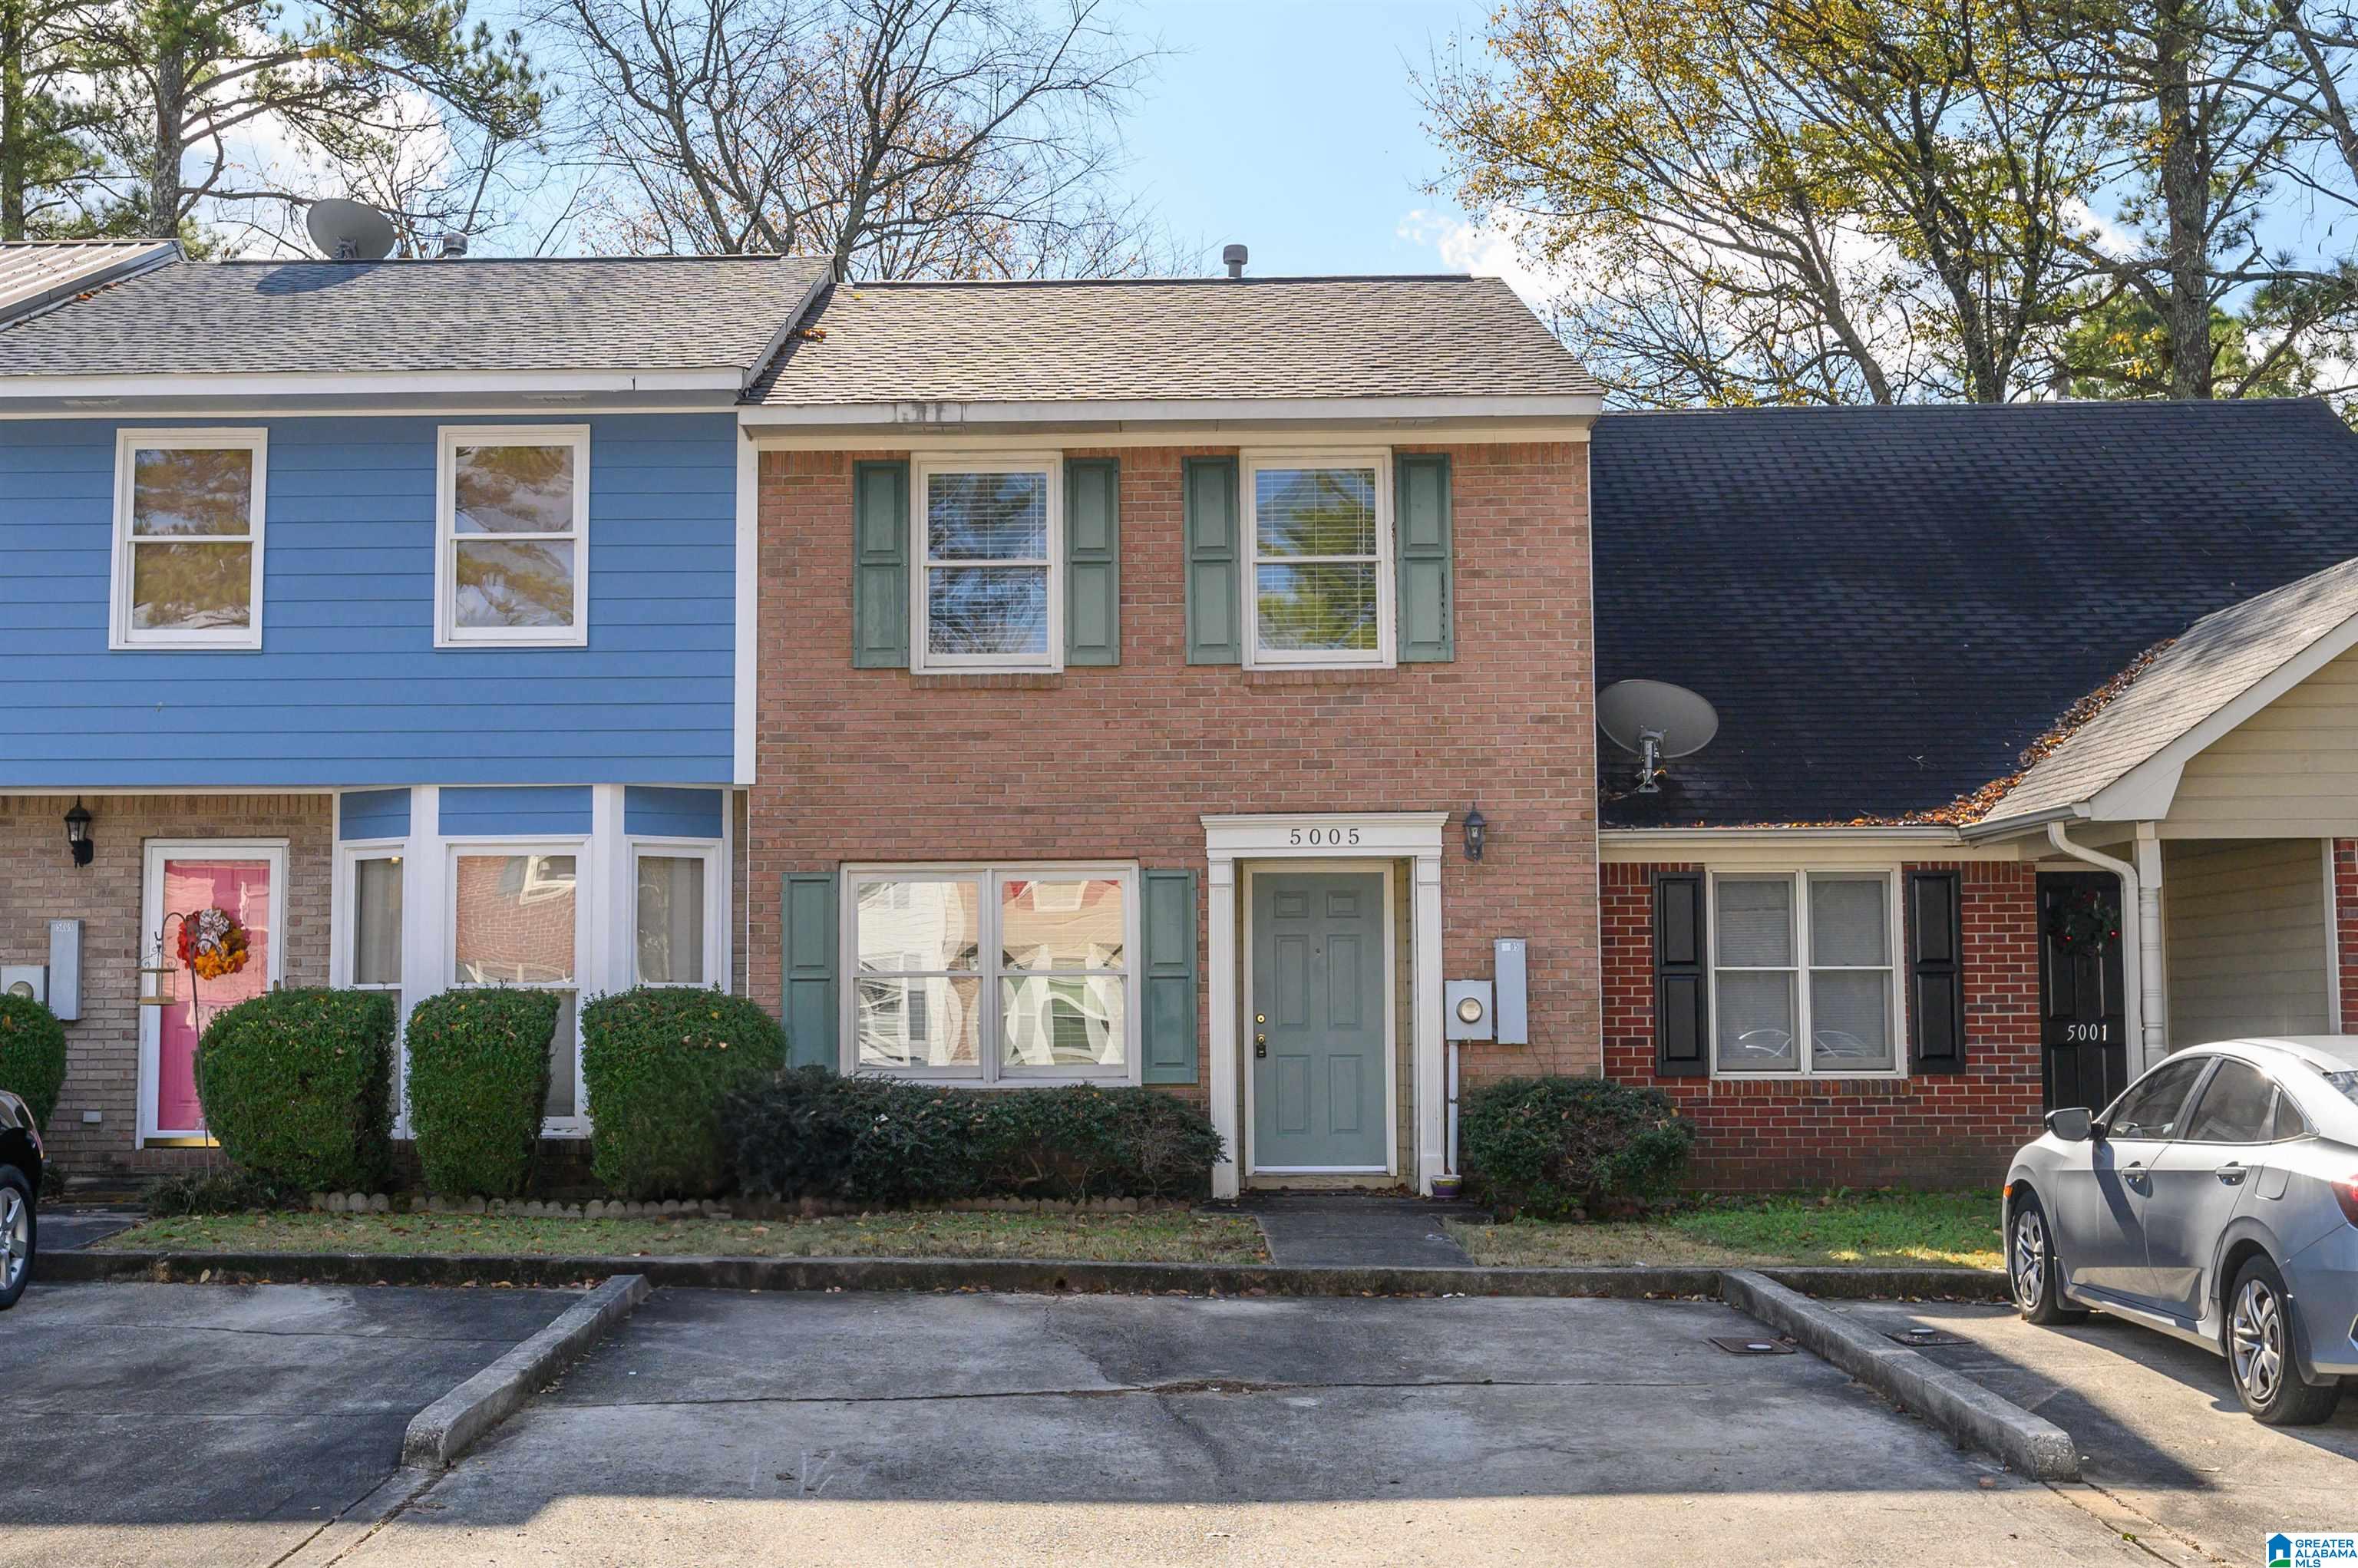
Active
$119,900
2
bds
|
0
ba
|
1,108
sqft
|
built
2000
5005 Falling Creek Ln, Birmingham, AL 35235
$200
Cash flow
8.7%
Cash-on-Cash Return
8.3%
Cap rate
1.0%
Rent to Value Ratio
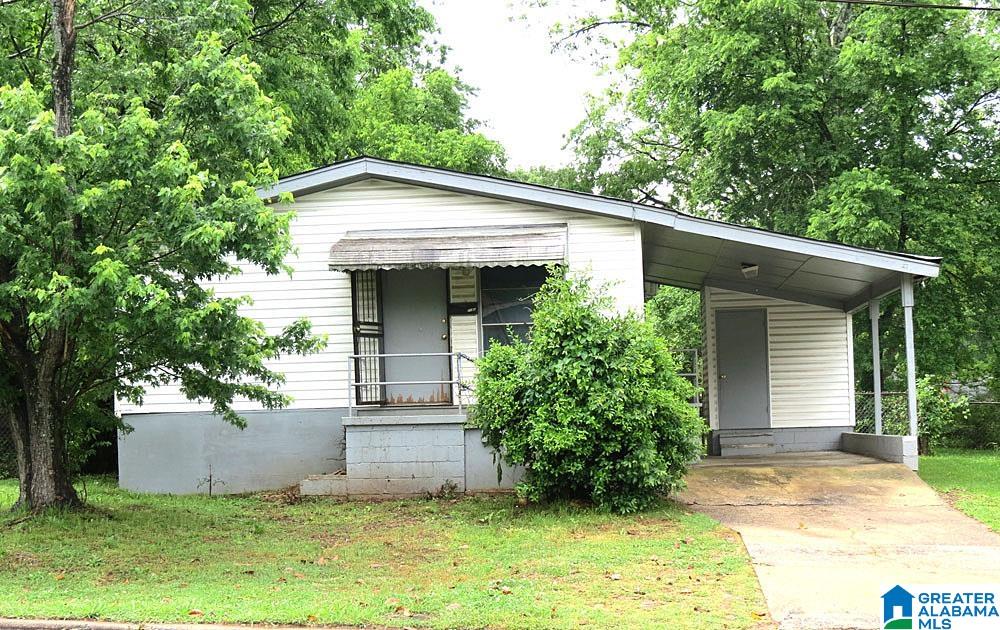
Active
$59,900
3
bds
|
0
ba
|
864
sqft
|
built
1959
1541 Dennison Ave SW, Birmingham, AL 35211
$690
Cash flow
13.4%
Cash-on-Cash Return
13.8%
Cap rate
1.7%
Rent to Value Ratio

Active
$379,000
3
bds
|
0
ba
|
2,428
sqft
|
built
1956
5456 11th Ave S, Birmingham, AL 35222
$-743
Cash flow
-10.2%
Cash-on-Cash Return
3.9%
Cap rate
0.5%
Rent to Value Ratio
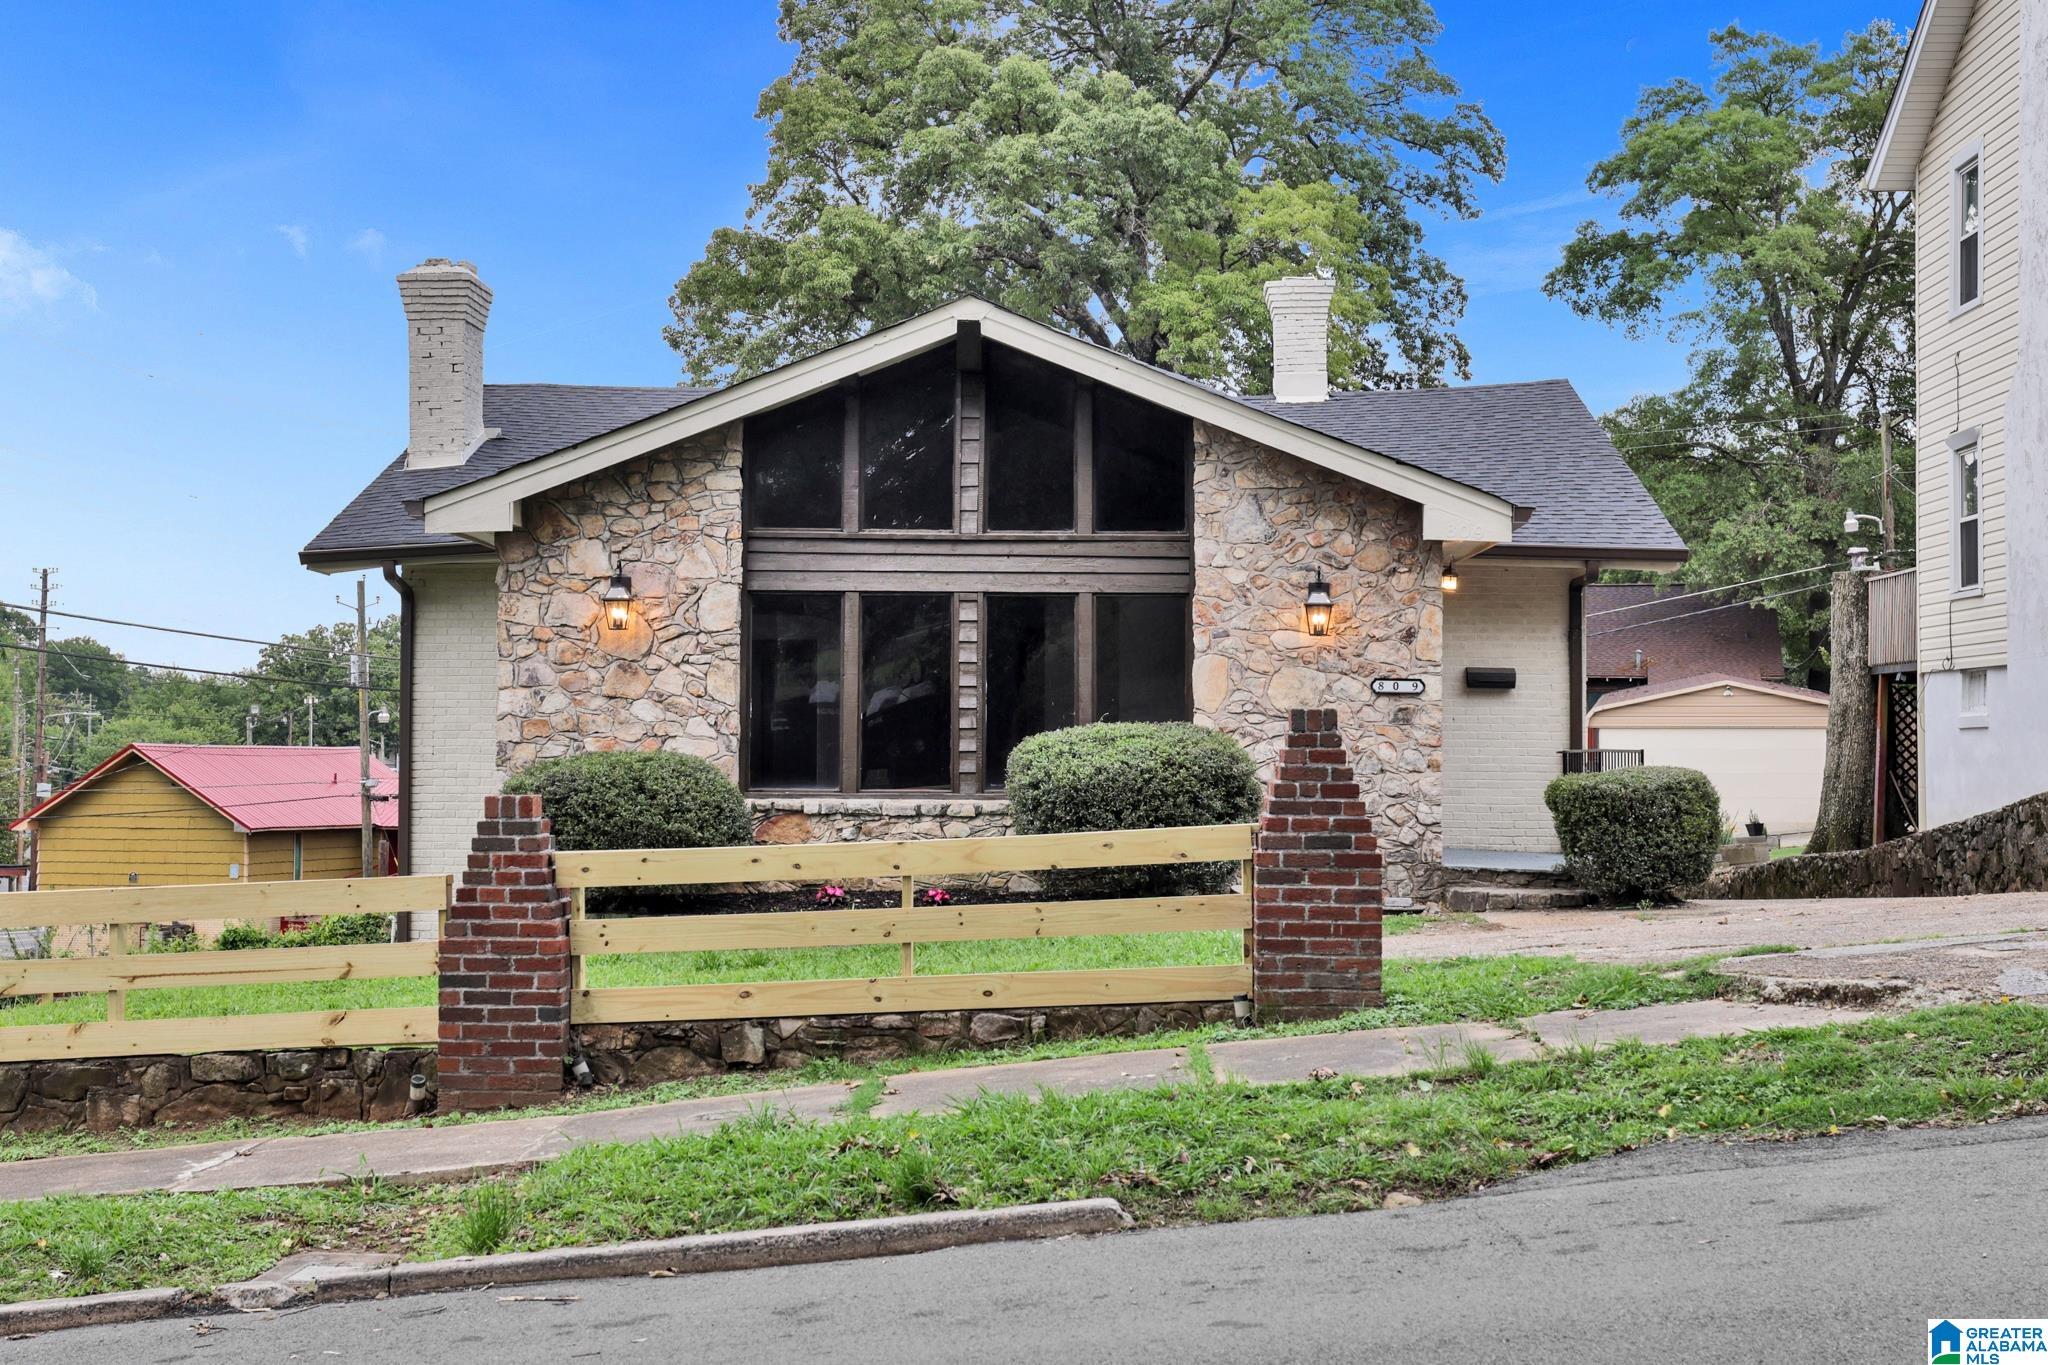
Active
$275,000
4
bds
|
0
ba
|
2,644
sqft
|
built
1935
809 15th St W, Birmingham, AL 35208
$-198
Cash flow
-3.8%
Cash-on-Cash Return
5.4%
Cap rate
0.7%
Rent to Value Ratio
Active
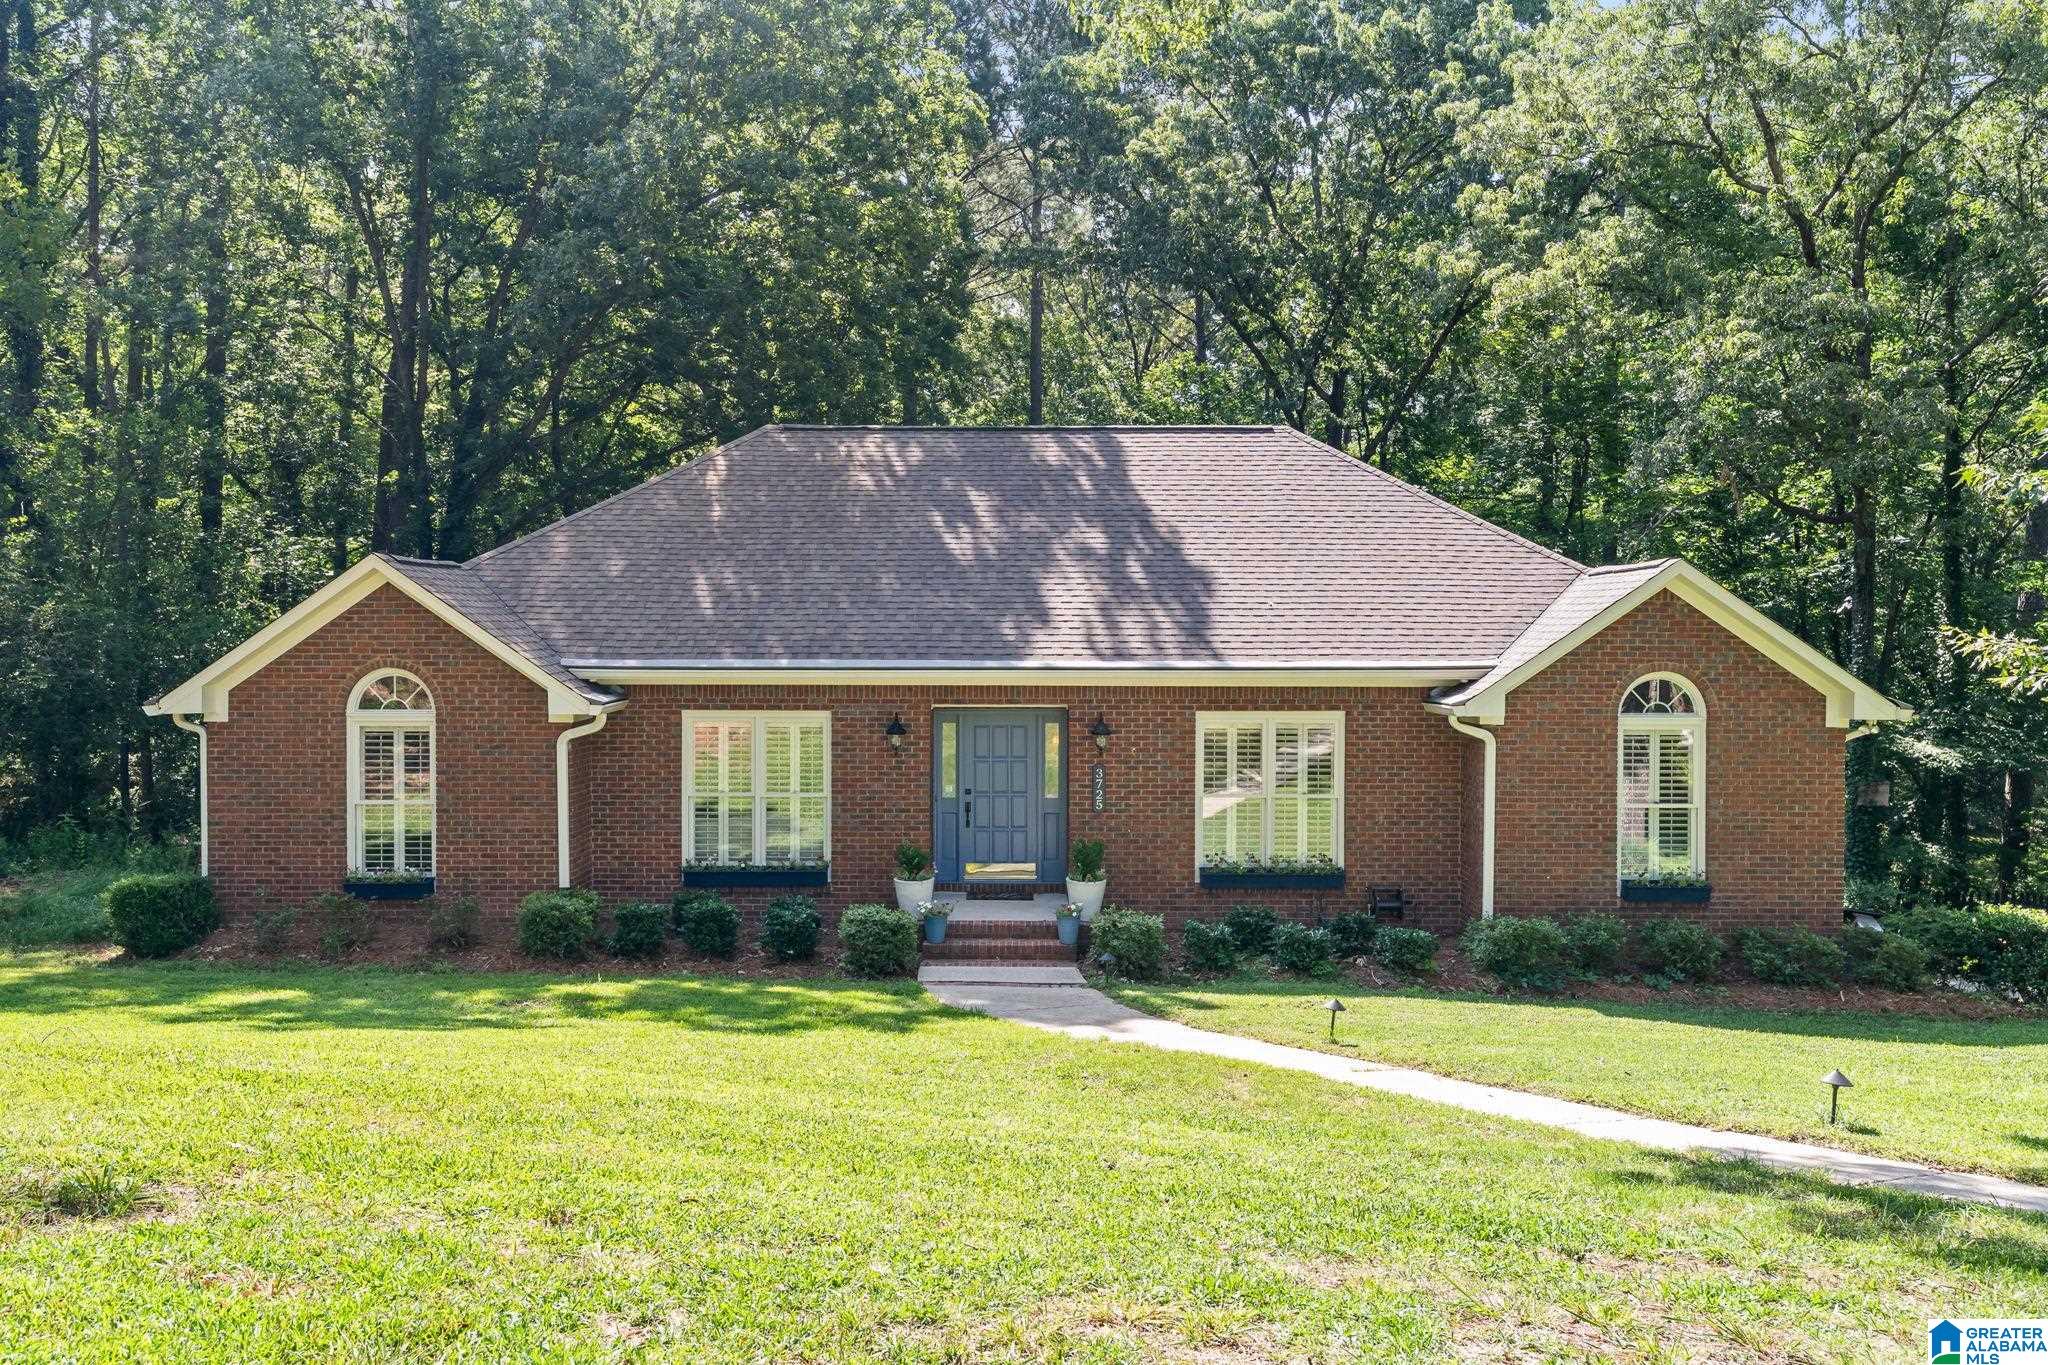
$629,900
4
bds
|
0
ba
|
3,400
sqft
|
built
1986
3725 Cumberland Trce, Birmingham, AL 35242
$-1,298
Cash flow
-10.8%
Cash-on-Cash Return
3.8%
Cap rate
0.5%
Rent to Value Ratio
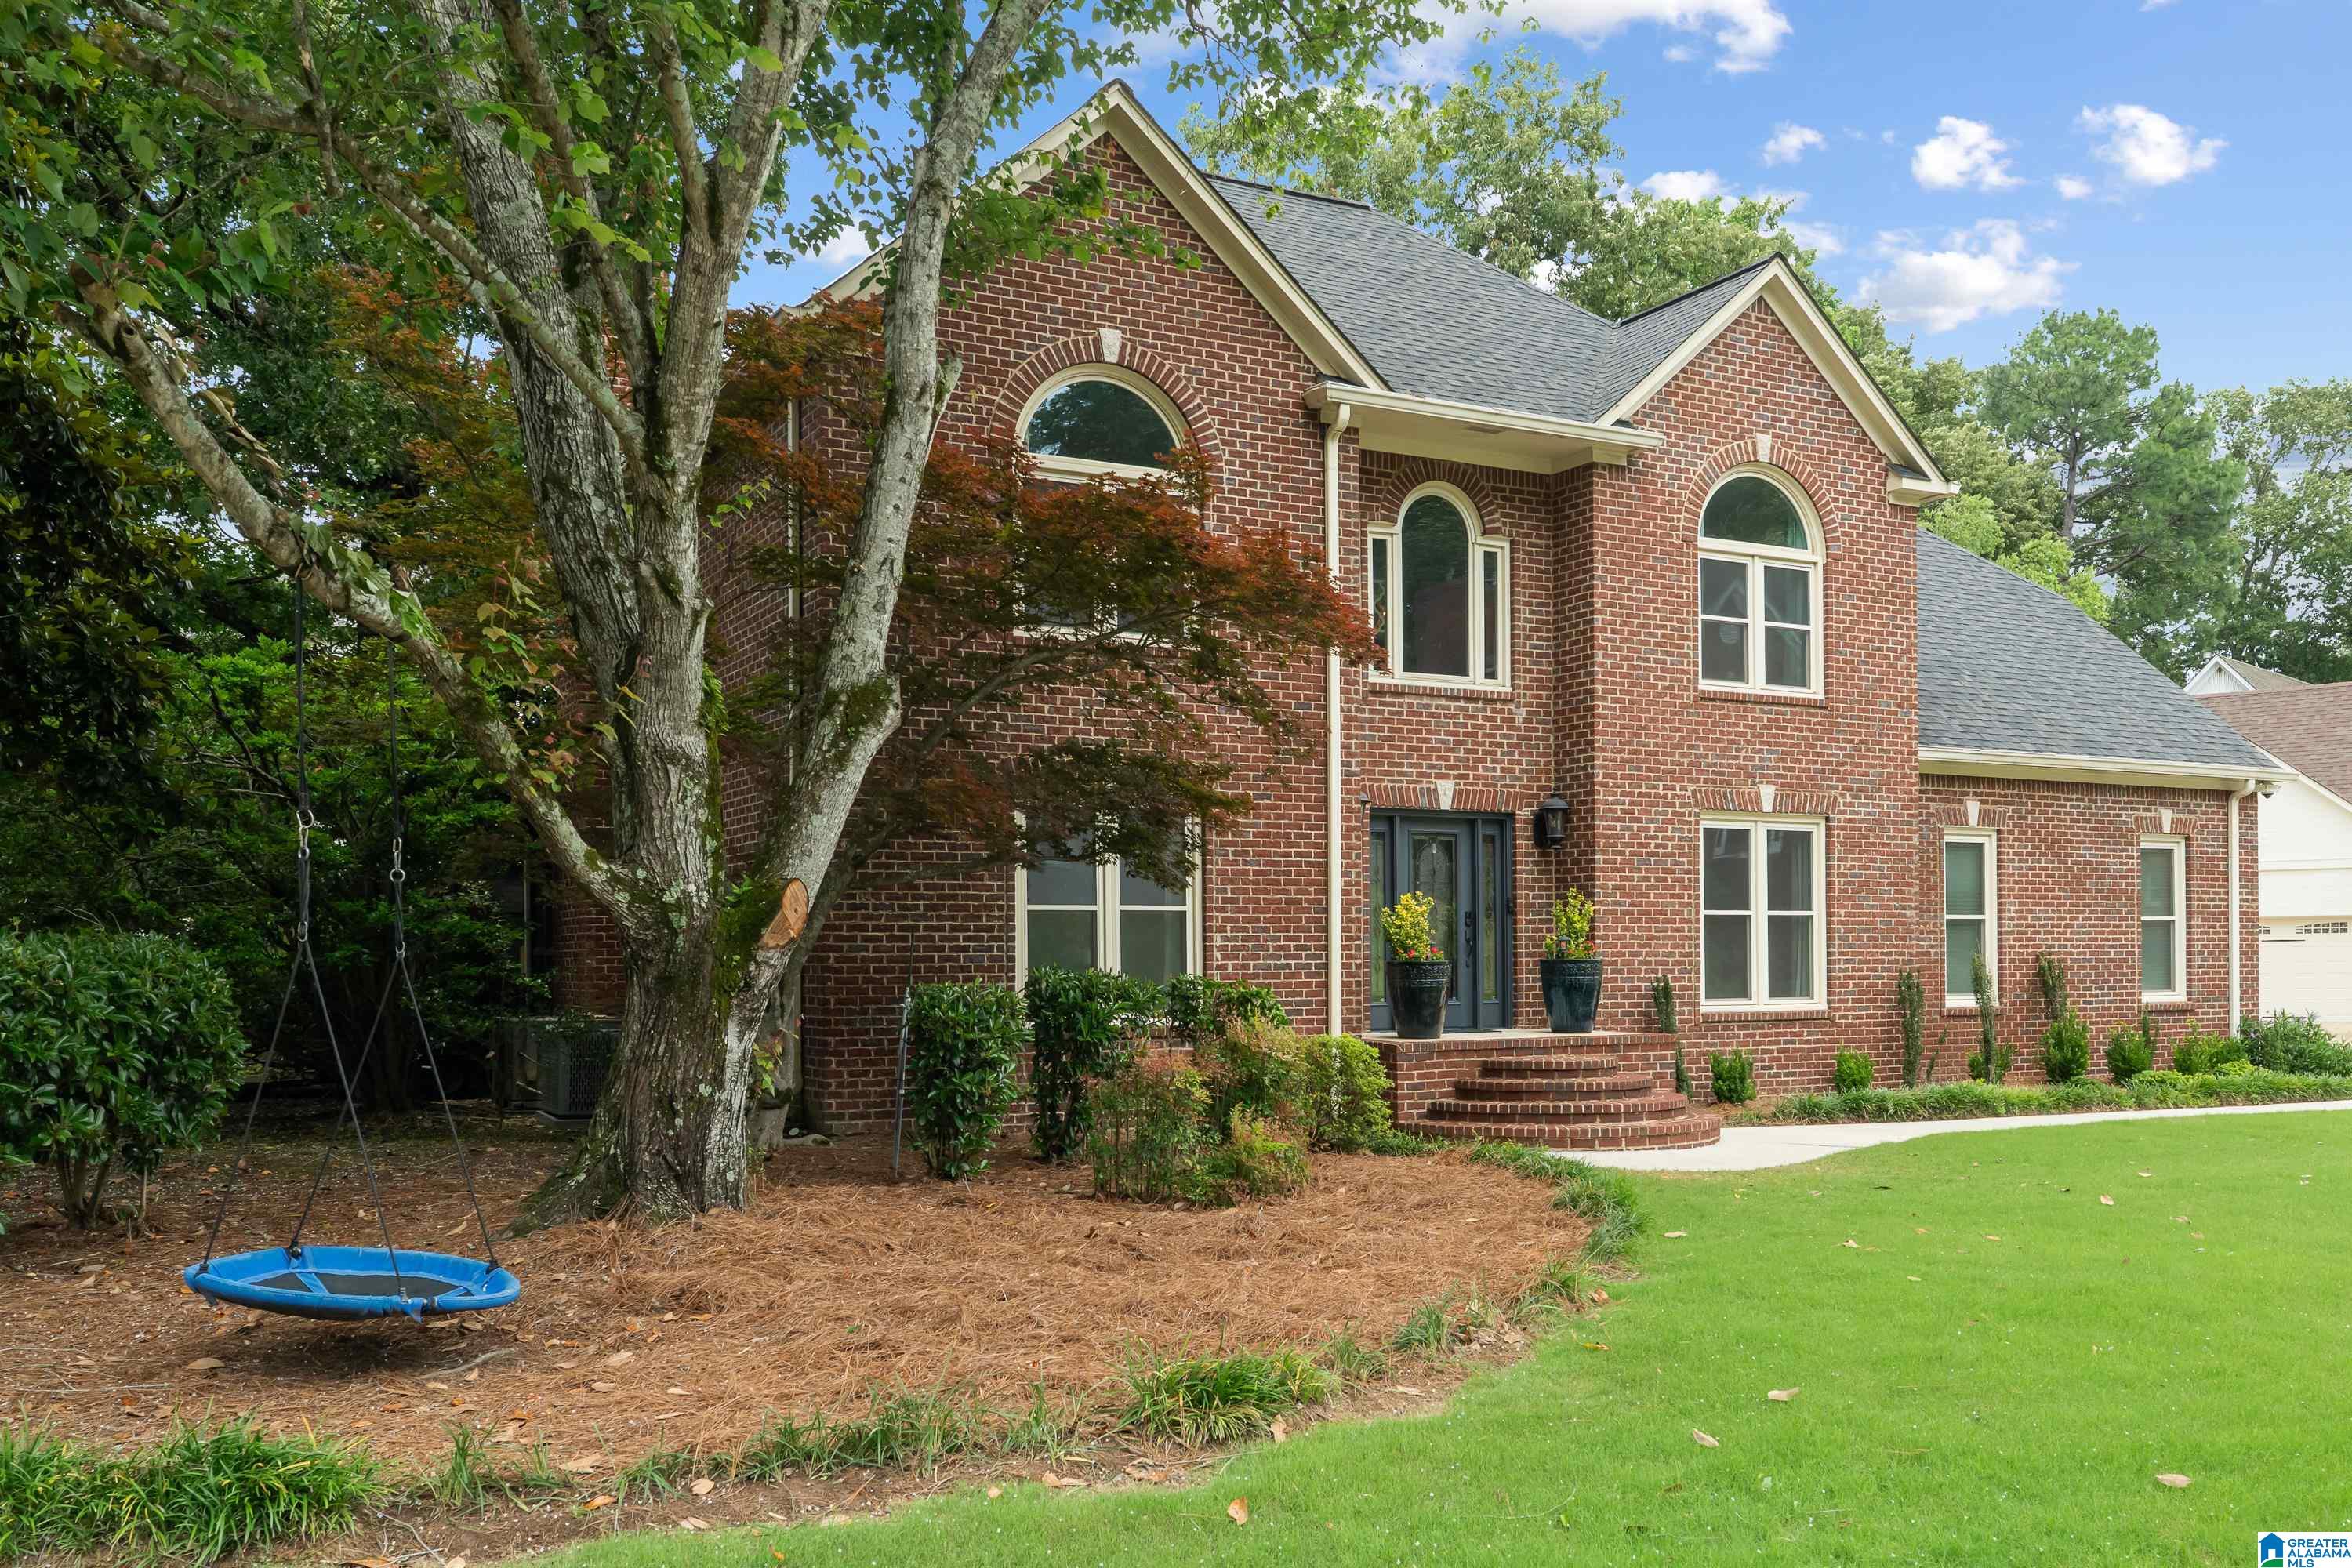
Pending
$479,900
3
bds
|
0
ba
|
1,385
sqft
|
built
1961
668 Edgemoor Dr, Birmingham, AL 35209
$-995
Cash flow
-10.8%
Cash-on-Cash Return
3.8%
Cap rate
0.5%
Rent to Value Ratio
Active
$115,000
3
bds
|
0
ba
|
1,000
sqft
|
built
1962
232 Navajo Trl, Birmingham, AL 35215
$226
Cash flow
10.3%
Cash-on-Cash Return
8.6%
Cap rate
1.0%
Rent to Value Ratio
Active
$247,000
3
bds
|
0
ba
|
1,763
sqft
|
built
1978
1132 Martinwood Ln, Birmingham, AL 35235
$87
Cash flow
1.8%
Cash-on-Cash Return
6.7%
Cap rate
0.8%
Rent to Value Ratio
Active
$205,000
1
bds
|
0
ba
|
616
sqft
|
built
2007
2020 5th Ave S, Birmingham, AL 35233
$-108
Cash flow
-2.7%
Cash-on-Cash Return
5.7%
Cap rate
0.7%
Rent to Value Ratio
Pending
$95,000
3
bds
|
0
ba
|
904
sqft
|
built
1925
1316 Court R, Birmingham, AL 35218
$262
Cash flow
14.4%
Cash-on-Cash Return
9.6%
Cap rate
1.2%
Rent to Value Ratio
Active
$171,900
3
bds
|
0
ba
|
1,840
sqft
|
built
1967
952 Crown Dr, Birmingham, AL 35235
$-3
Cash flow
-0.1%
Cash-on-Cash Return
6.3%
Cap rate
0.8%
Rent to Value Ratio
Active
$65,000
3
bds
|
0
ba
|
1,110
sqft
|
built
1910
1012 15th St SW, Birmingham, AL 35211
$759
Cash flow
13.6%
Cash-on-Cash Return
14.0%
Cap rate
1.7%
Rent to Value Ratio
Active
$325,000
3
bds
|
0
ba
|
1,910
sqft
|
built
1925
1320 33rd St N, Birmingham, AL 35234
$-874
Cash flow
-14.0%
Cash-on-Cash Return
3.1%
Cap rate
0.4%
Rent to Value Ratio
Active
$139,900
3
bds
|
0
ba
|
1,232
sqft
|
built
1930
900 4th Ave W, Birmingham, AL 35204
$26
Cash flow
1.0%
Cash-on-Cash Return
6.5%
Cap rate
0.8%
Rent to Value Ratio
Active
$145,000
4
bds
|
0
ba
|
1,756
sqft
|
built
1925
4633 Court S, Birmingham, AL 35208
$345
Cash flow
12.4%
Cash-on-Cash Return
9.1%
Cap rate
1.1%
Rent to Value Ratio
Active under contract
$165,000
2
bds
|
0
ba
|
1,276
sqft
|
built
2006
2080 Willow Glenn Dr, Birmingham, AL 35215
$92
Cash flow
2.9%
Cash-on-Cash Return
7.0%
Cap rate
0.8%
Rent to Value Ratio
Active
$52,500
3
bds
|
0
ba
|
1,096
sqft
|
built
1954
201 Carol Dr, Birmingham, AL 35215
$759
Cash flow
16.8%
Cash-on-Cash Return
17.3%
Cap rate
2.1%
Rent to Value Ratio
Active
$475,000
3
bds
|
0
ba
|
1,778
sqft
|
built
1972
400 Shiloh Cir, Birmingham, AL 35213
$-348
Cash flow
-3.8%
Cash-on-Cash Return
5.4%
Cap rate
0.7%
Rent to Value Ratio
Active
$149,900
1
bds
|
0
ba
|
616
sqft
|
built
1965
2727 Highland Ave S, Birmingham, AL 35205
$-357
Cash flow
-12.4%
Cash-on-Cash Return
3.4%
Cap rate
0.8%
Rent to Value Ratio
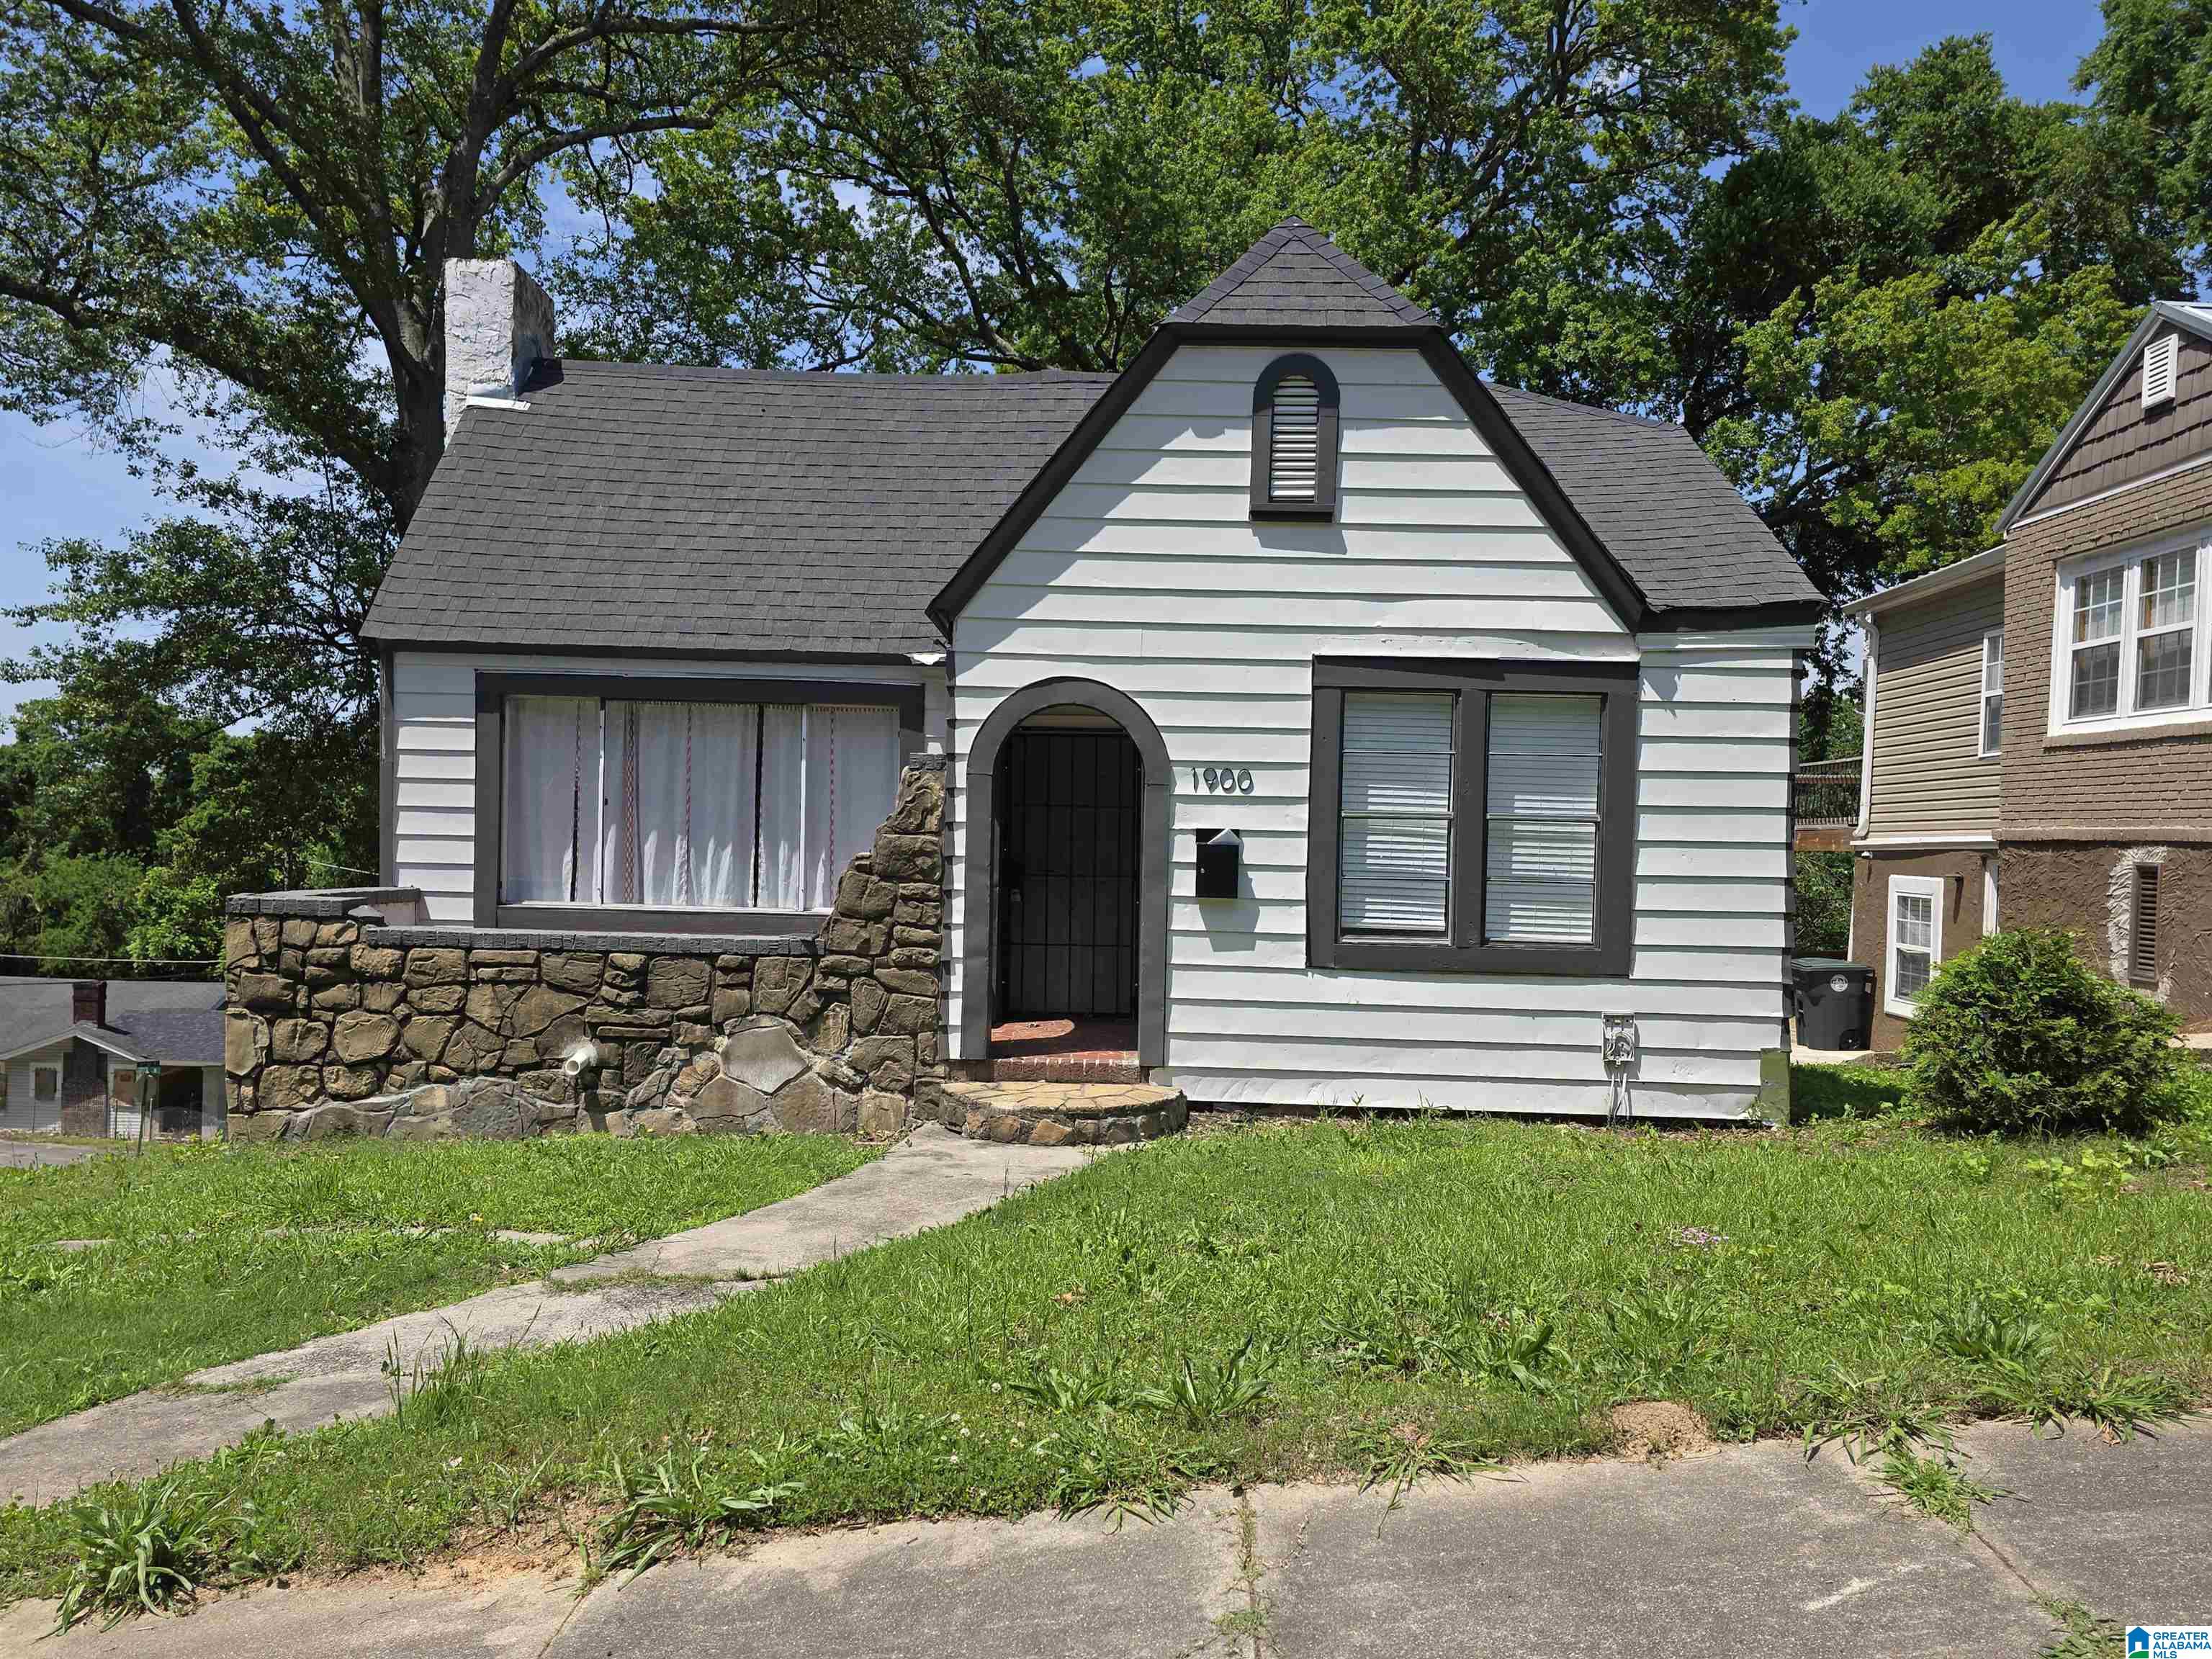
Active
$148,000
3
bds
|
0
ba
|
2,184
sqft
|
built
1936
1900 Portage Ave, Birmingham, AL 35234
$53
Cash flow
1.9%
Cash-on-Cash Return
6.7%
Cap rate
0.8%
Rent to Value Ratio
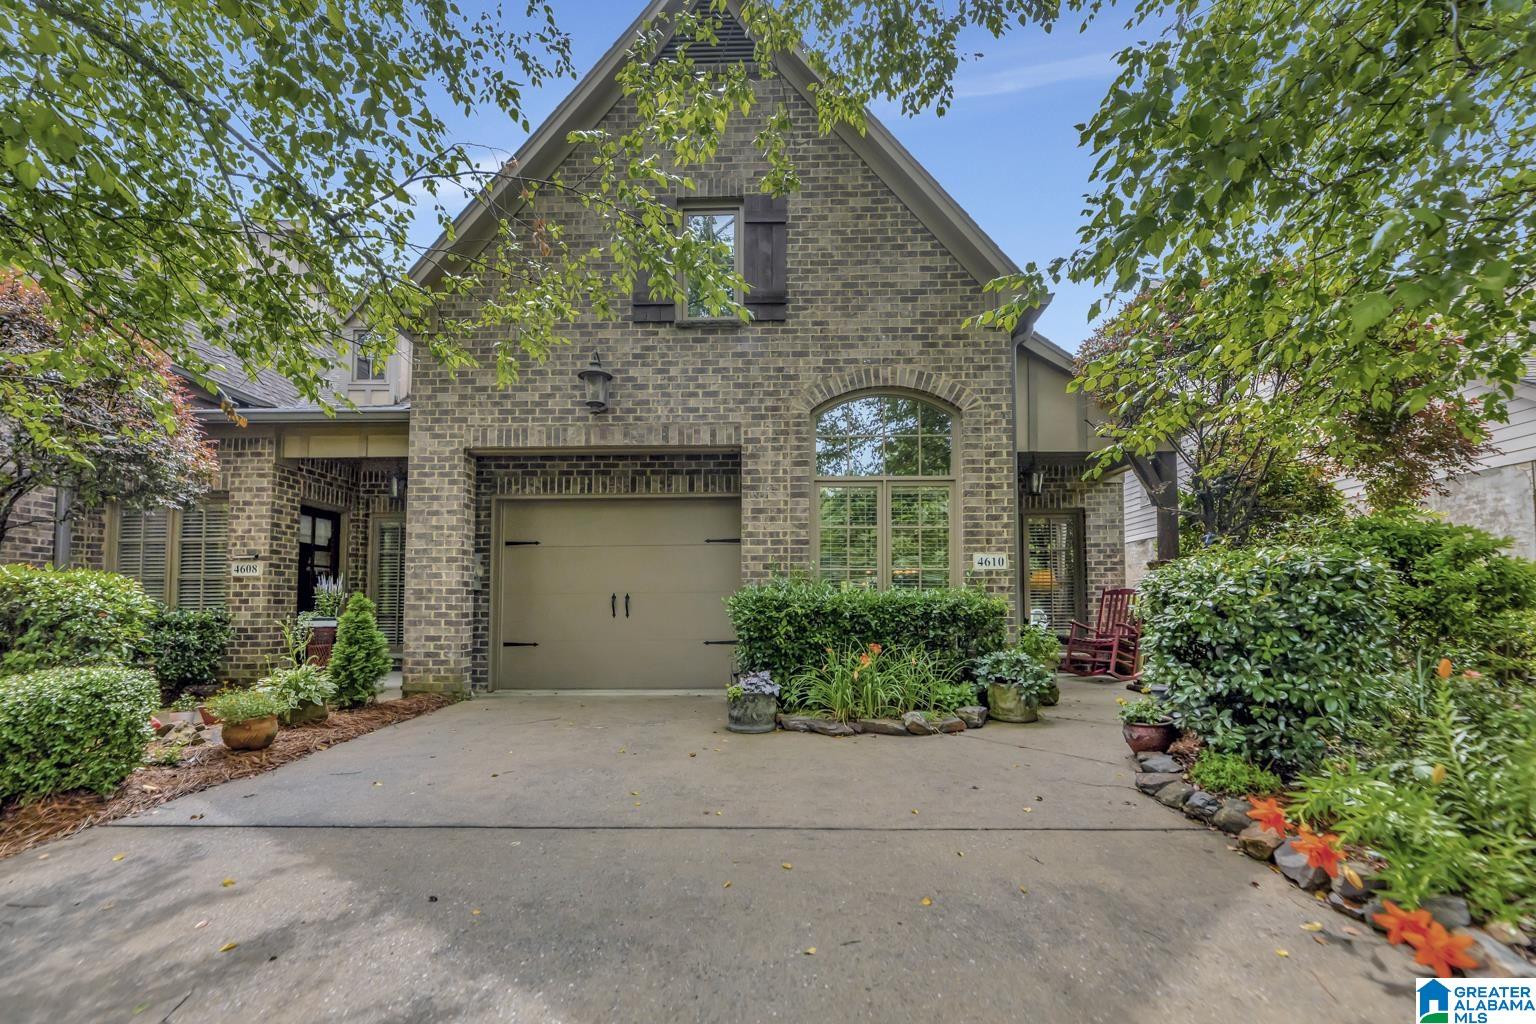
Active
$412,000
4
bds
|
0
ba
|
2,248
sqft
|
built
2008
4610 Cotswold Ln, Birmingham, AL 35242
$-516
Cash flow
-6.5%
Cash-on-Cash Return
4.8%
Cap rate
0.6%
Rent to Value Ratio
Active
$749,900
4
bds
|
0
ba
|
5,002
sqft
|
built
1990
4100 Kinross Cir, Birmingham, AL 35242
$-1,466
Cash flow
-10.2%
Cash-on-Cash Return
3.9%
Cap rate
0.5%
Rent to Value Ratio
Active
$269,900
3
bds
|
0
ba
|
1,518
sqft
|
built
1930
2120 Brewster Rd, Birmingham, AL 35235
$-447
Cash flow
-8.6%
Cash-on-Cash Return
4.3%
Cap rate
0.5%
Rent to Value Ratio
Active
$114,999
3
bds
|
0
ba
|
1,248
sqft
|
built
1947
1861 Woodland Ave SW, Birmingham, AL 35211
$157
Cash flow
7.1%
Cash-on-Cash Return
7.9%
Cap rate
1.0%
Rent to Value Ratio
Active
$220,000
3
bds
|
0
ba
|
1,644
sqft
|
built
1979
717 Country View Ter, Birmingham, AL 35215
$90
Cash flow
2.1%
Cash-on-Cash Return
6.8%
Cap rate
0.8%
Rent to Value Ratio