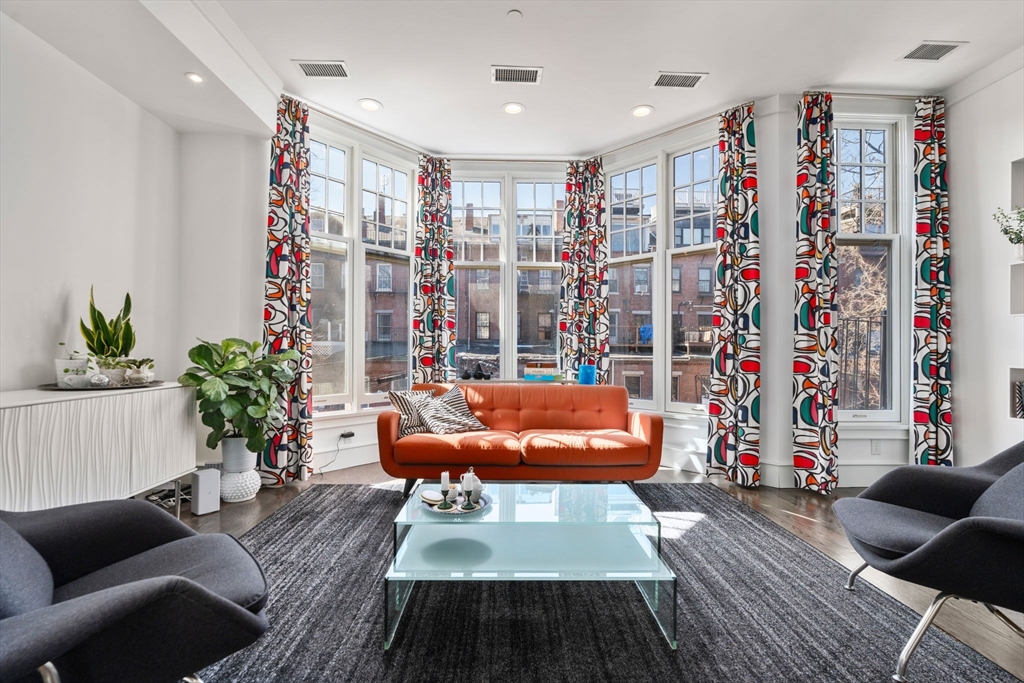
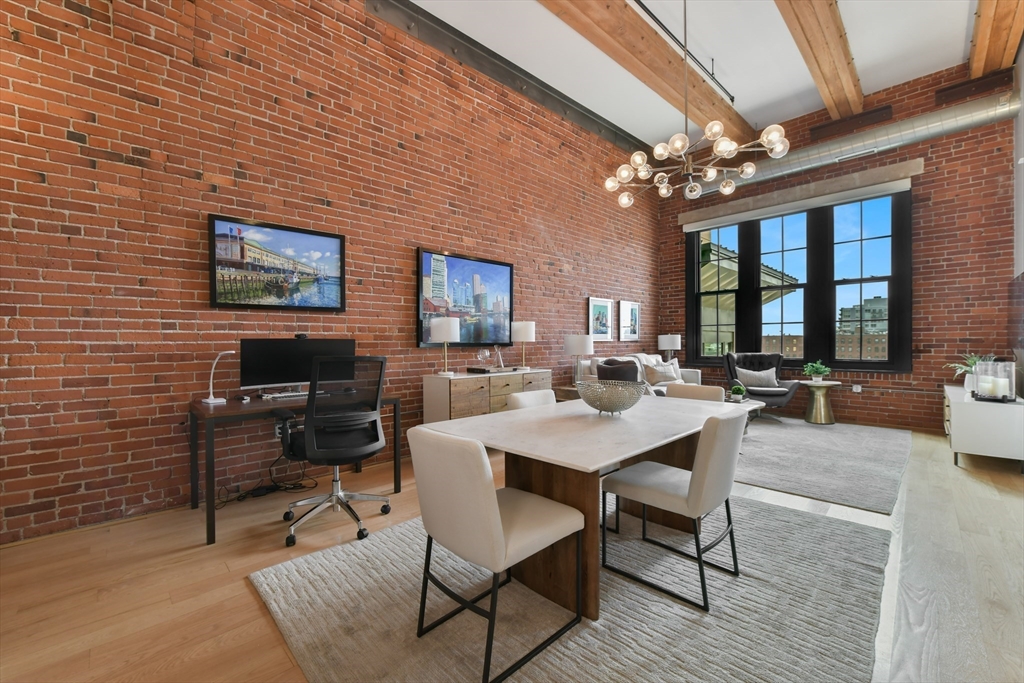
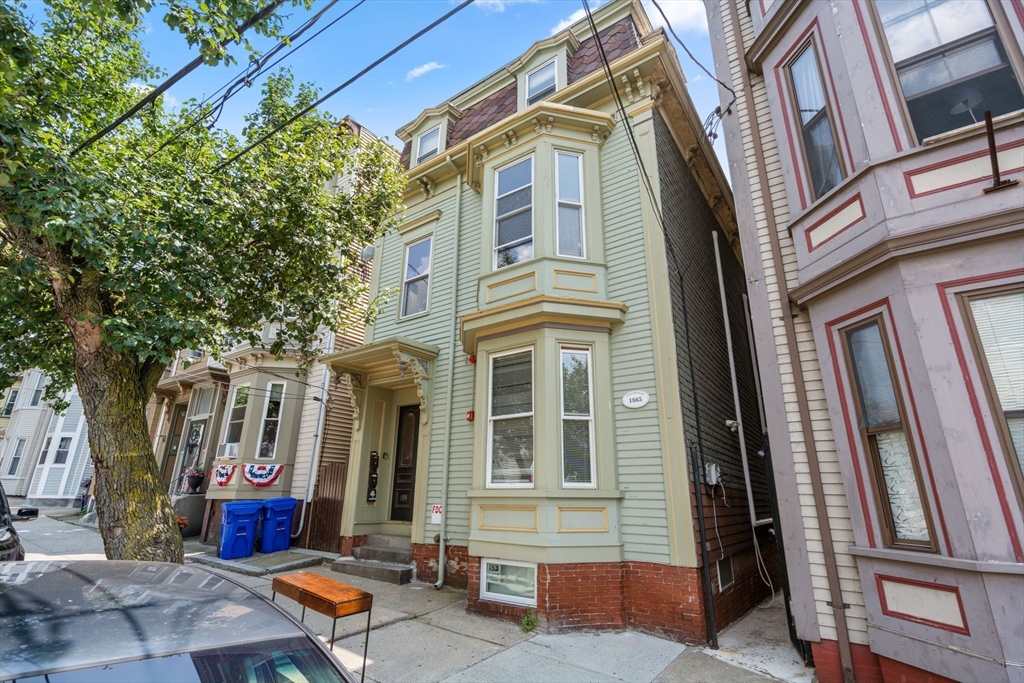
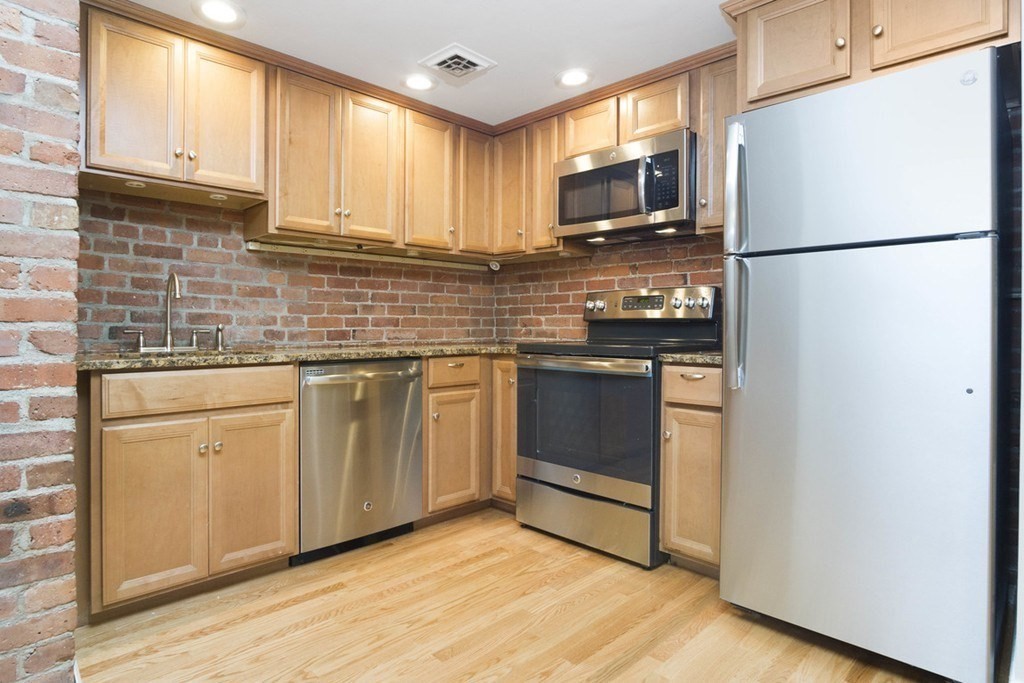
Boston, MA Investment Properties for Sale
Browse homes for sale and investment properties in Boston, MA. Refine your search by price, property type, or more.
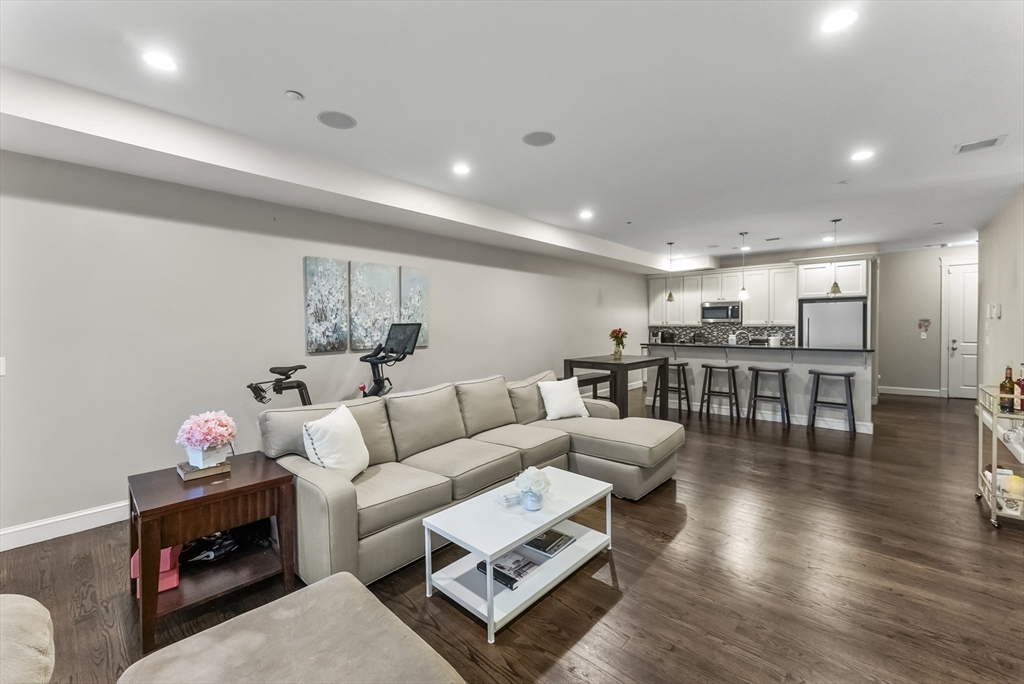
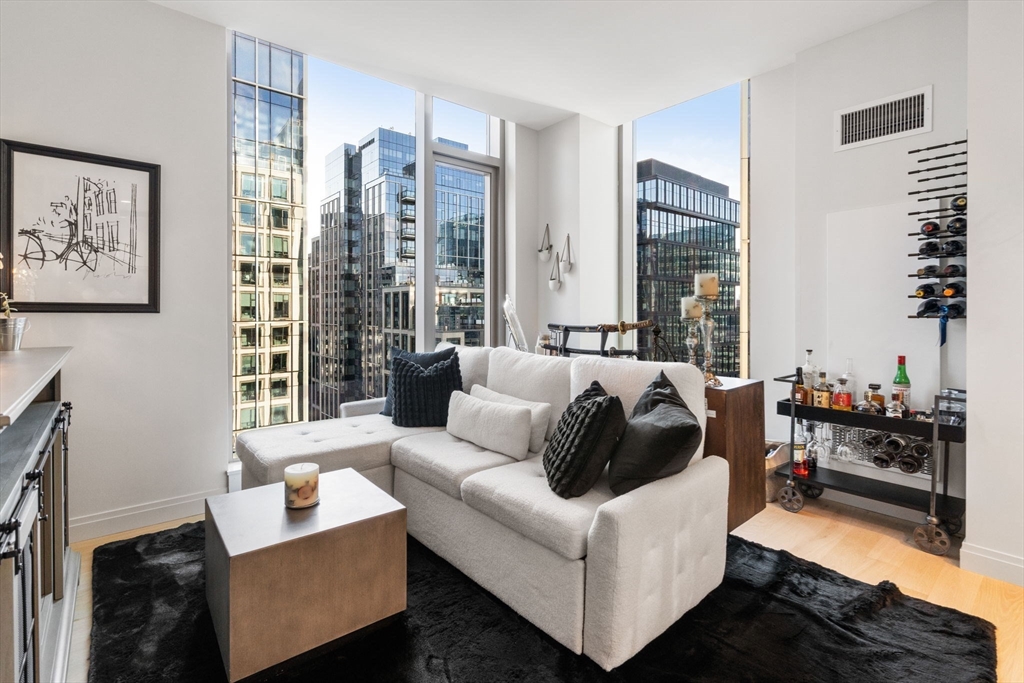
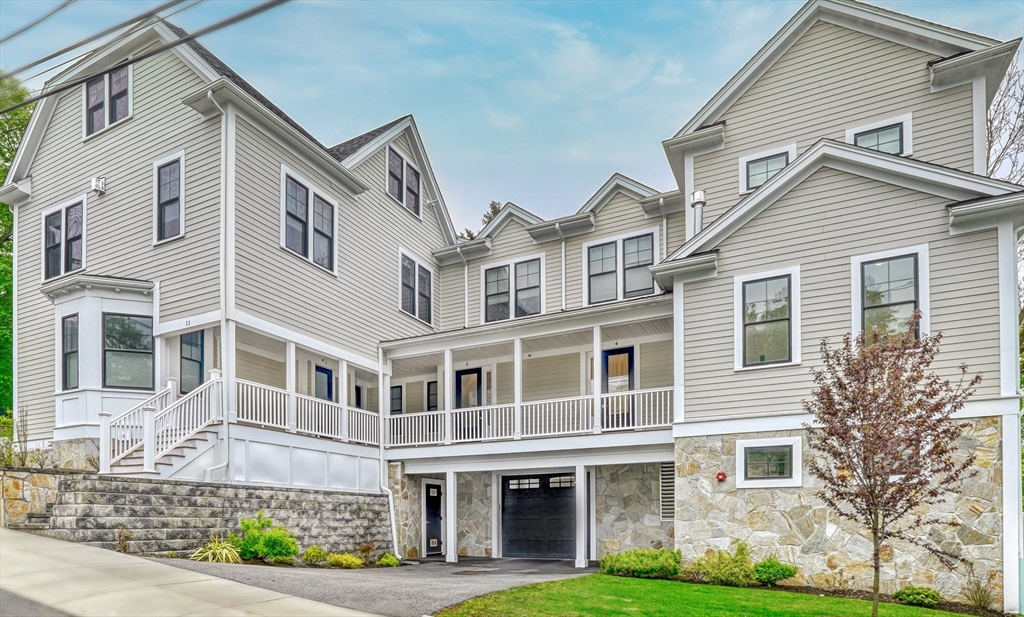
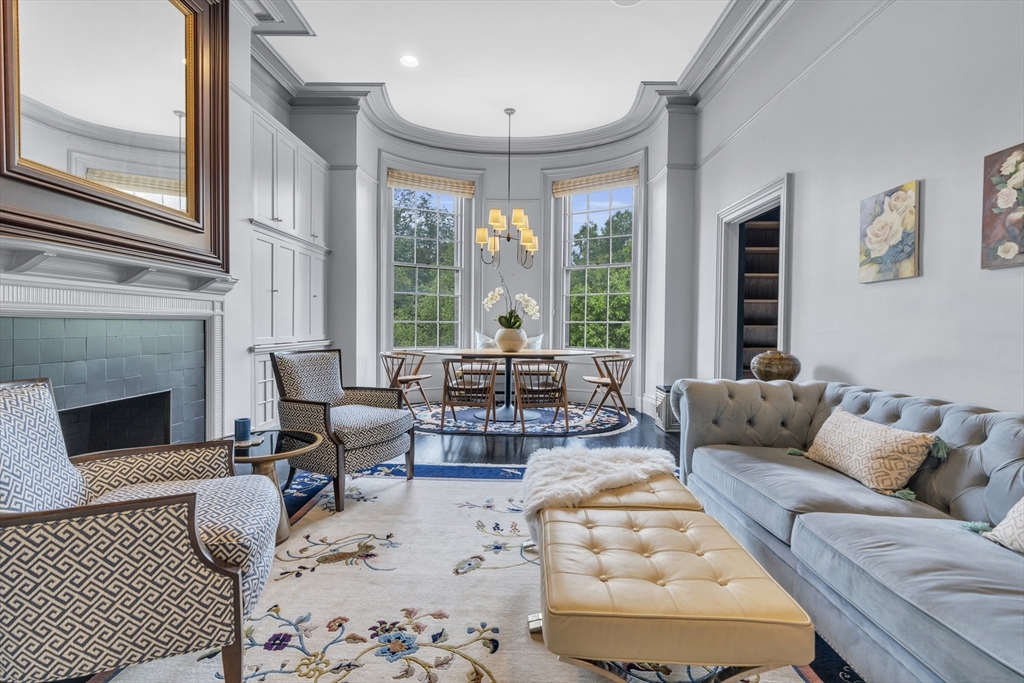
Best cash flowing properties in Boston, MA
Active
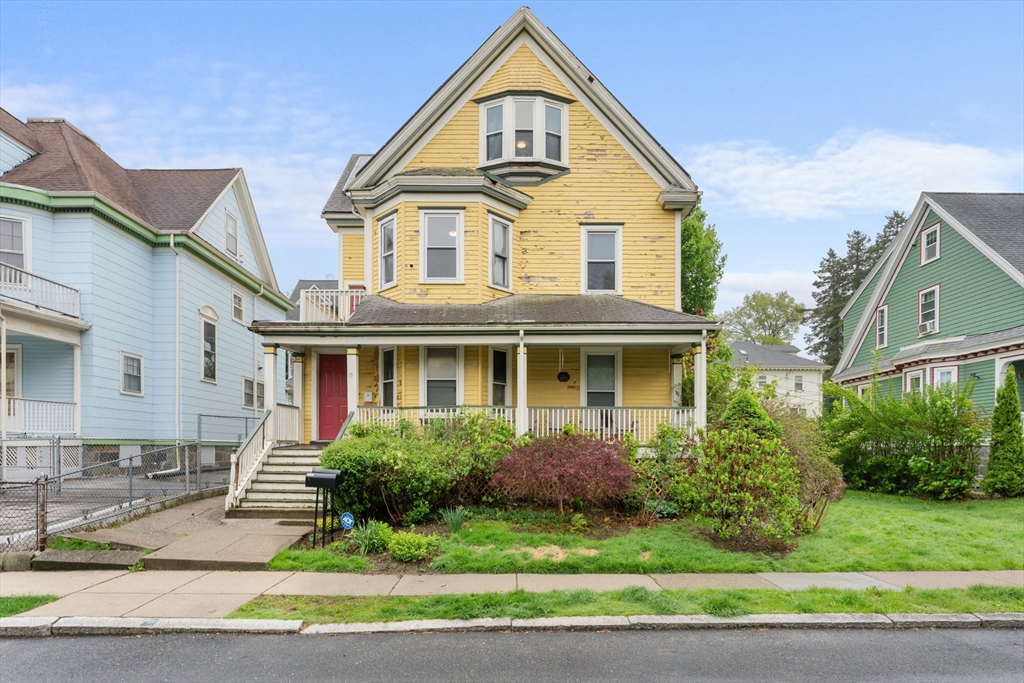
$375,000
2
bds
|
2
ba
|
689
sqft
|
built
1920
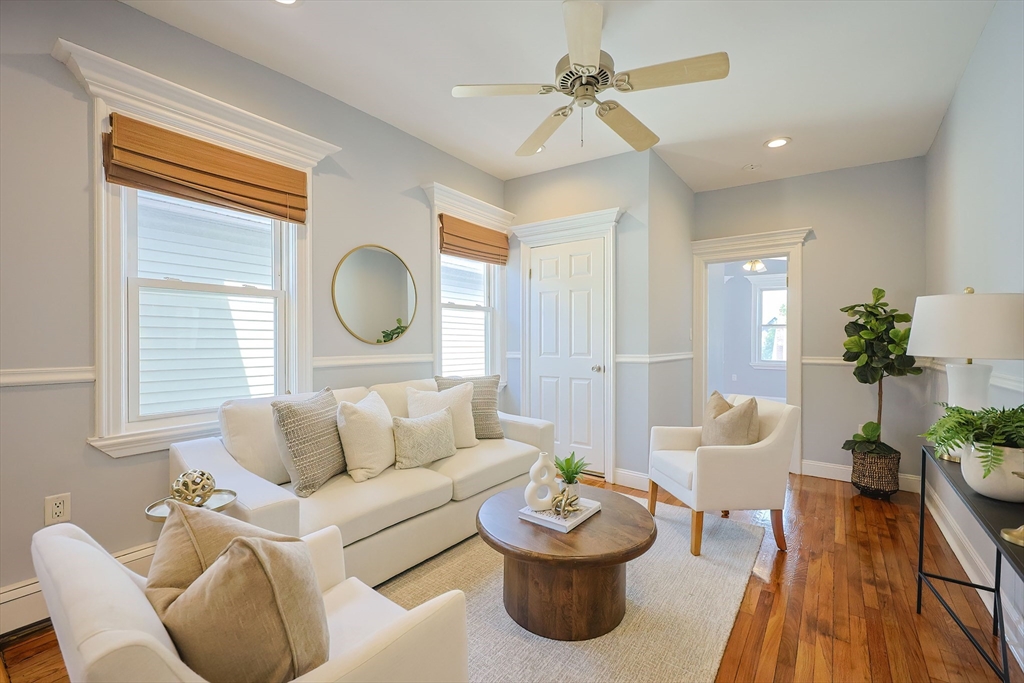
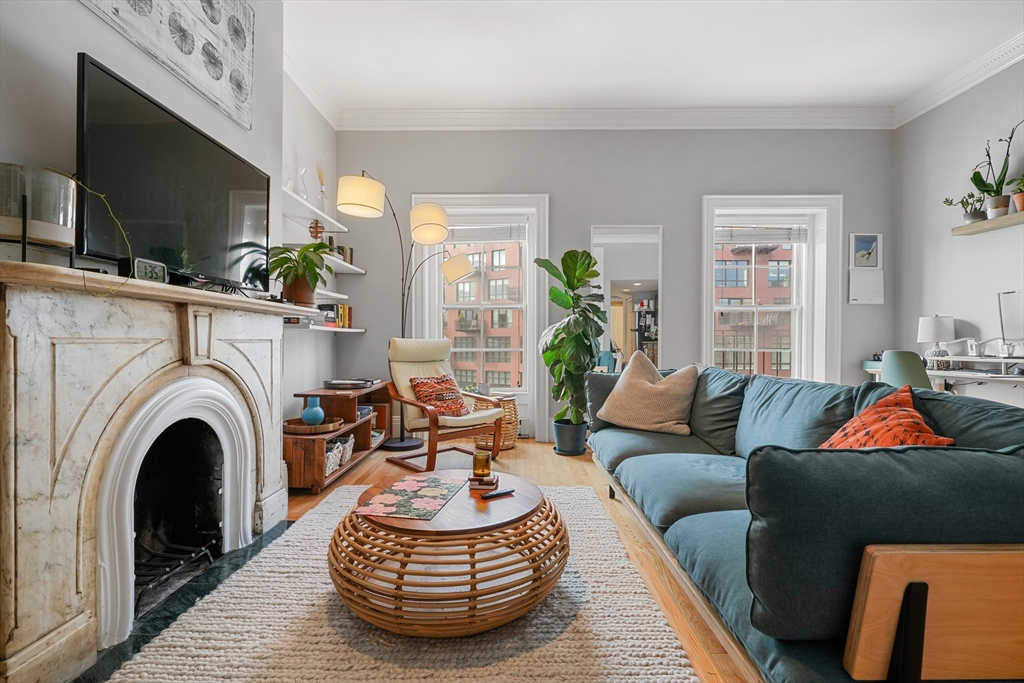
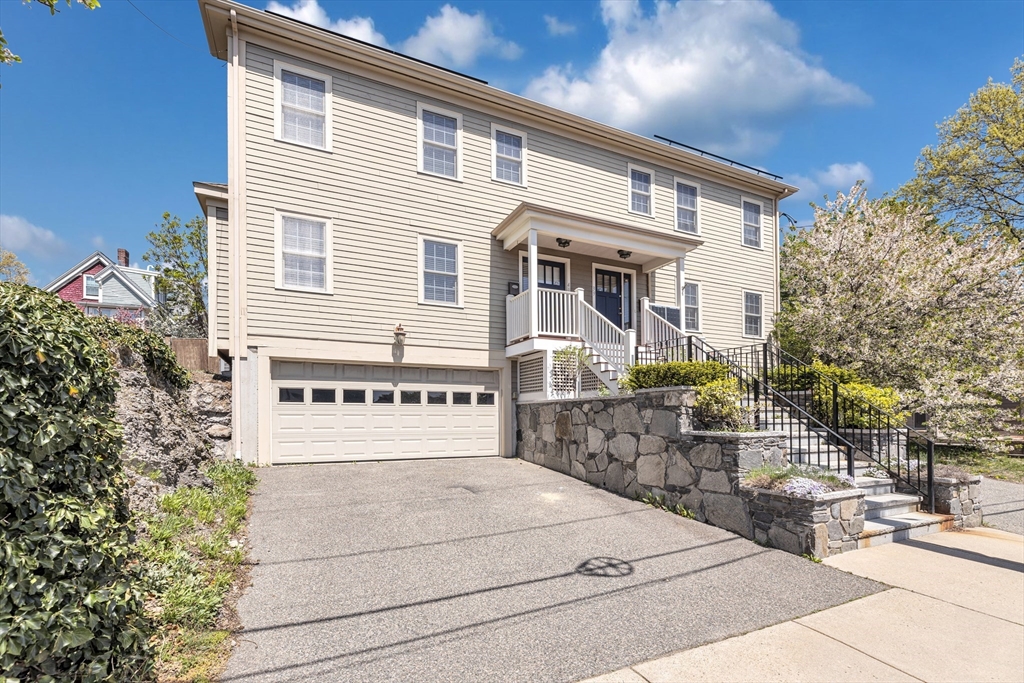
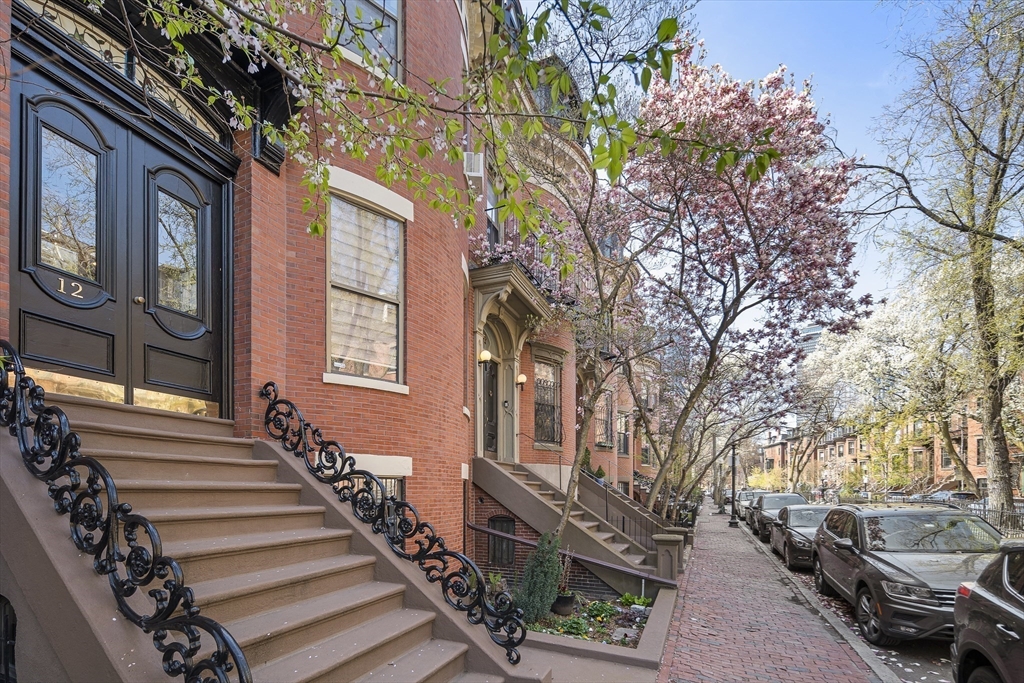
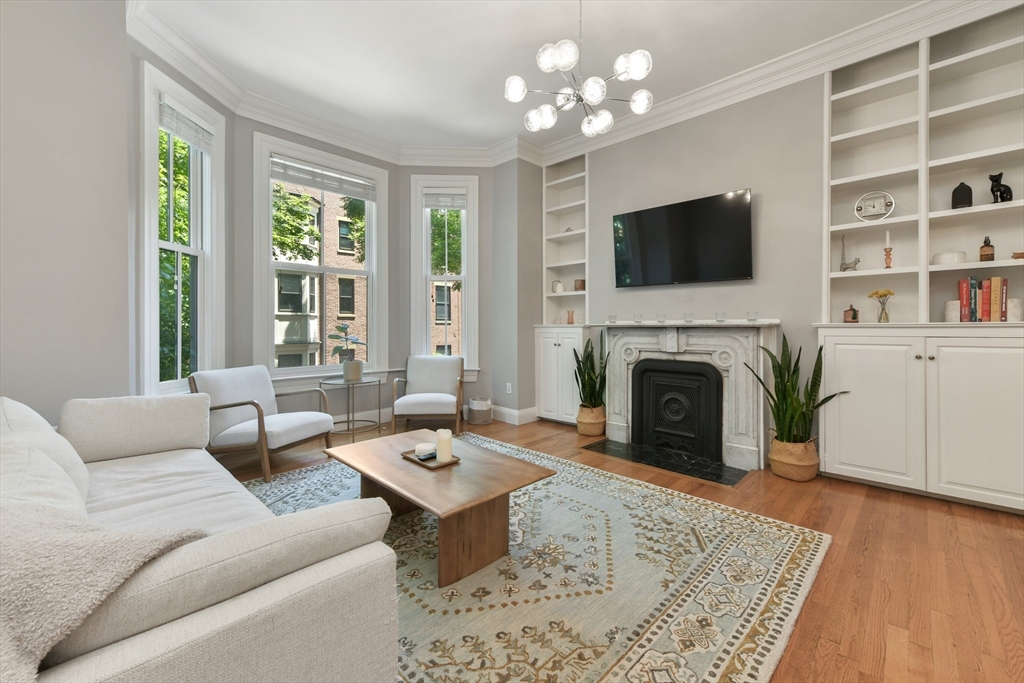
55 Devon St, Boston, MA 02121
$-372
Cash flow
-5.2%
Cash-on-Cash Return
4.5%
Cap rate
0.7%
Rent to Value Ratio
Active
$520,000
1
bds
|
1
ba
|
530
sqft
|
built
1880
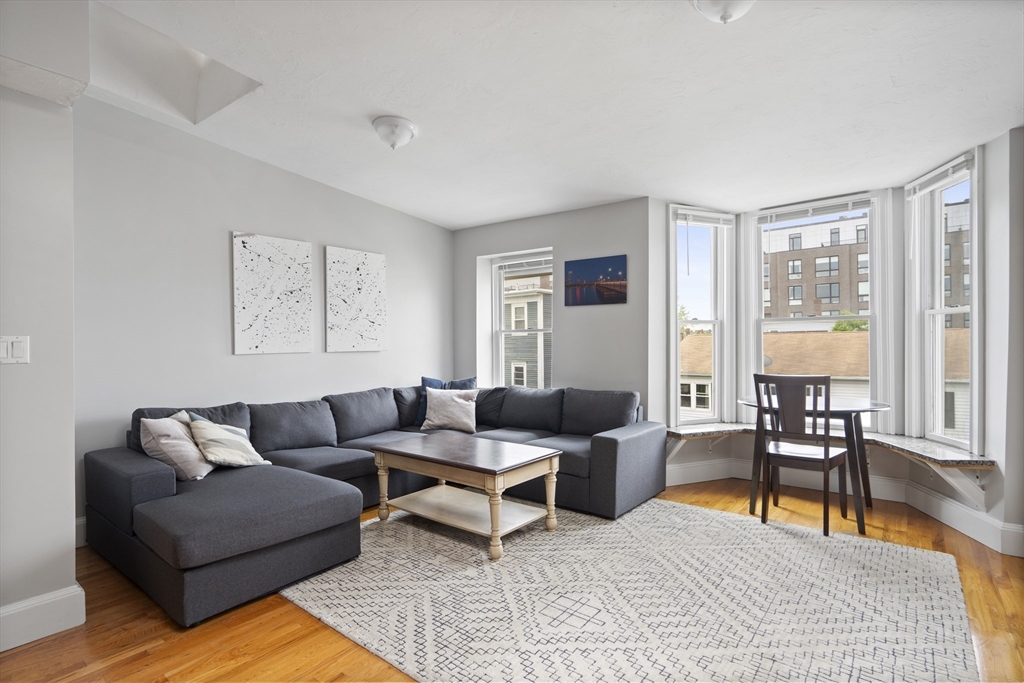
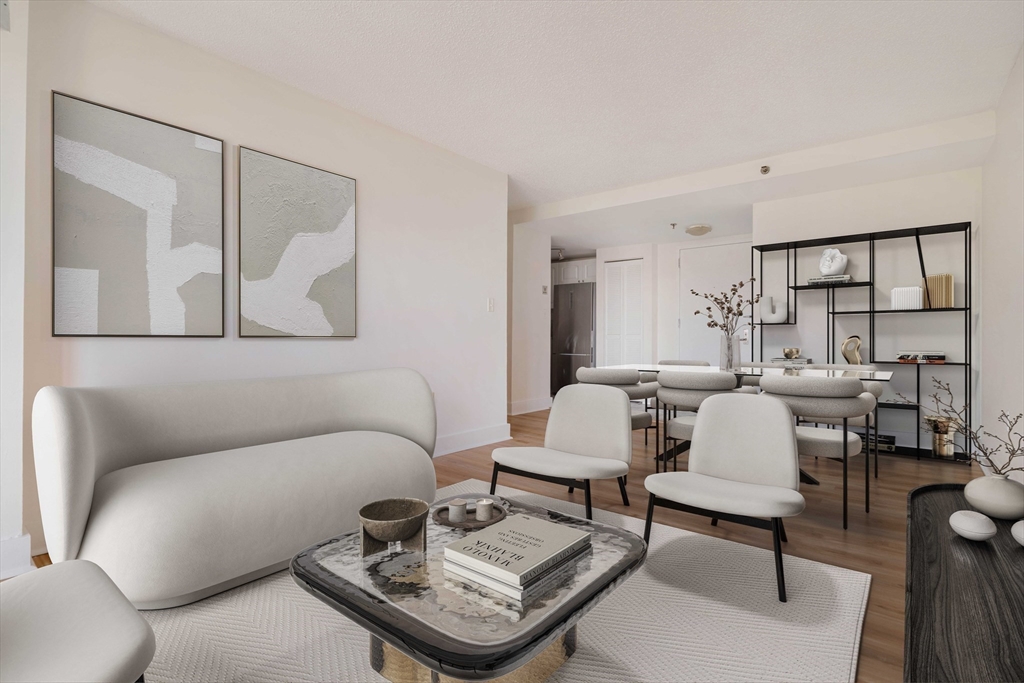
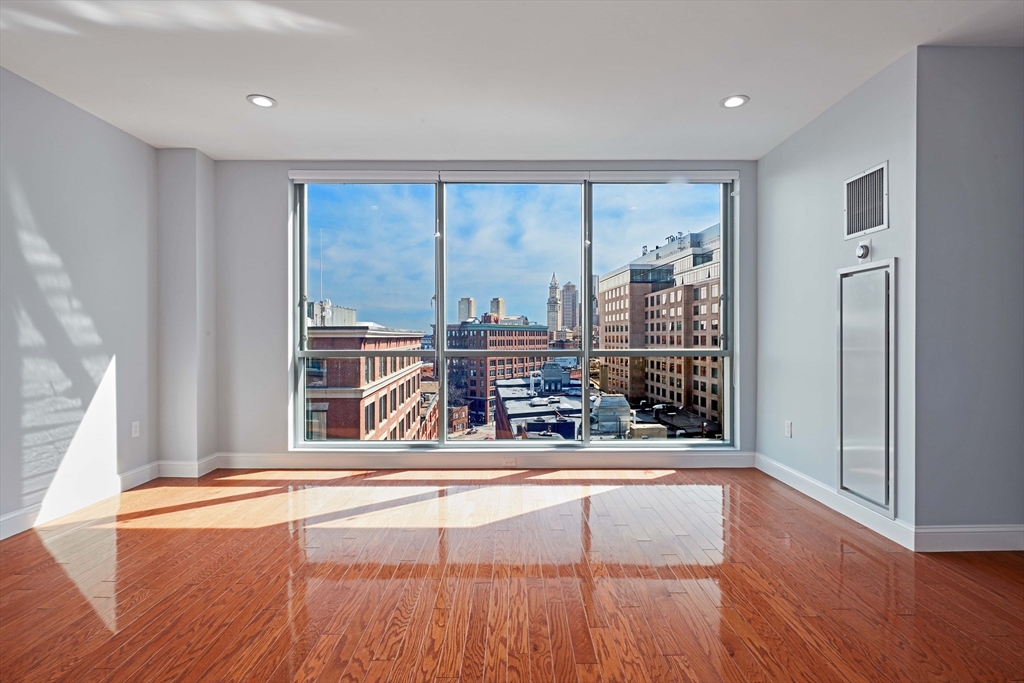
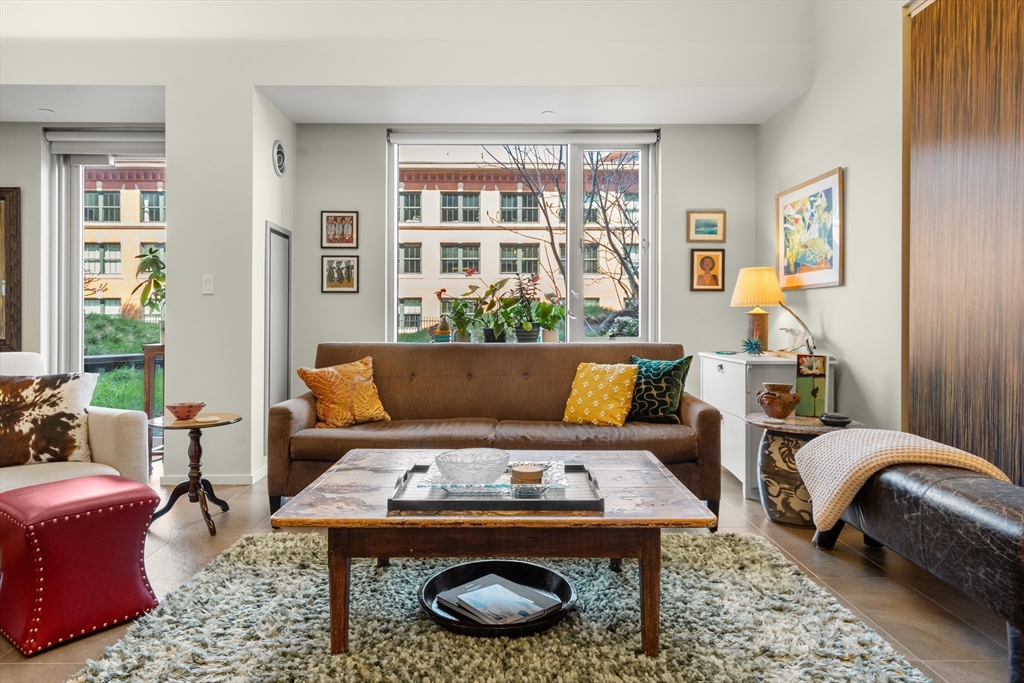
288 W 3rd St, Boston, MA 02127
$-1,040
Cash flow
-10.4%
Cash-on-Cash Return
3.3%
Cap rate
0.6%
Rent to Value Ratio
1,069 out of 1,740 properties for sale in Boston, MA
Limited Results Shown
Create a free account, or log in to reveal all property listings and enjoy the complete experience.
Active
$749,000
2
bds
|
2
ba
|
1,111
sqft
|
built
1900
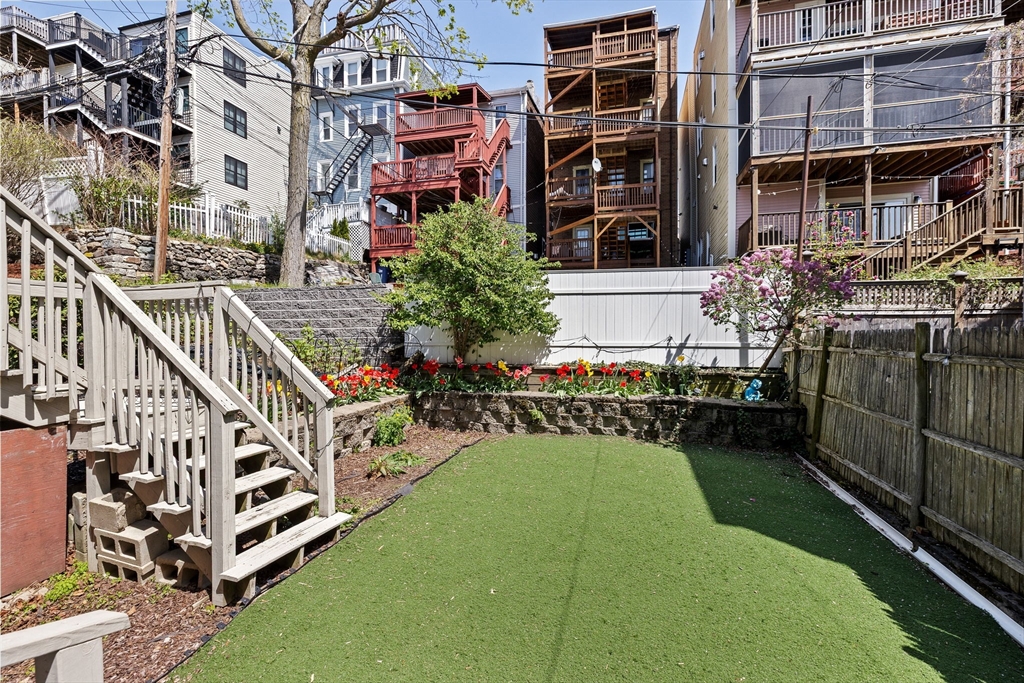
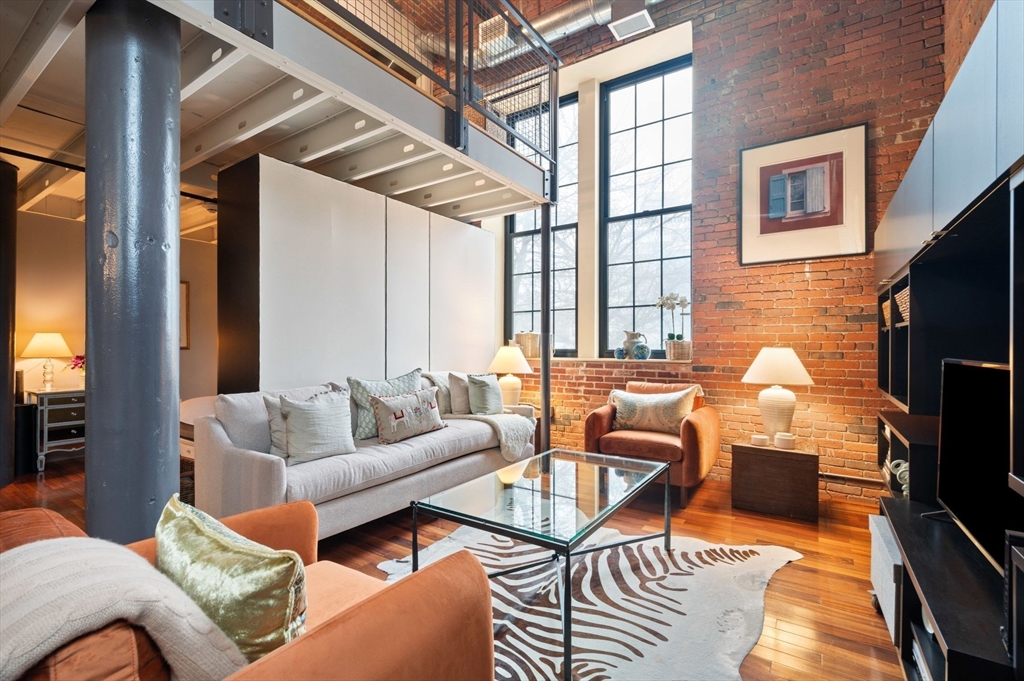
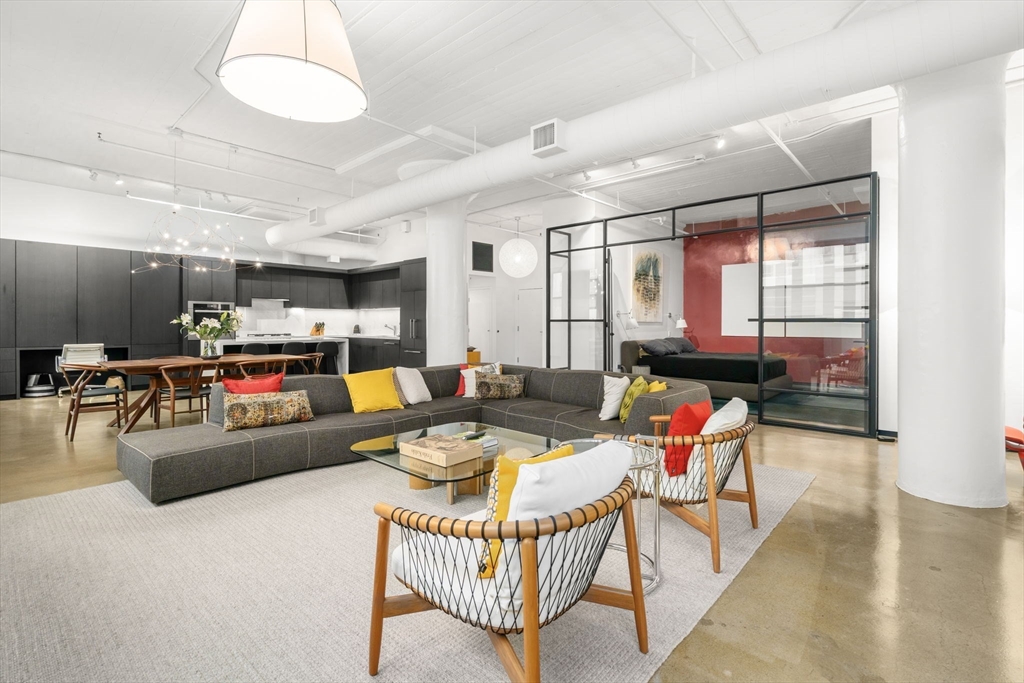
58 Gates St, Boston, MA 02127
$-1,884
Cash flow
-13.1%
Cash-on-Cash Return
2.7%
Cap rate
0.5%
Rent to Value Ratio
Active
$2,999,999
7
bds
|
6
ba
|
3,000
sqft
|
built
1910
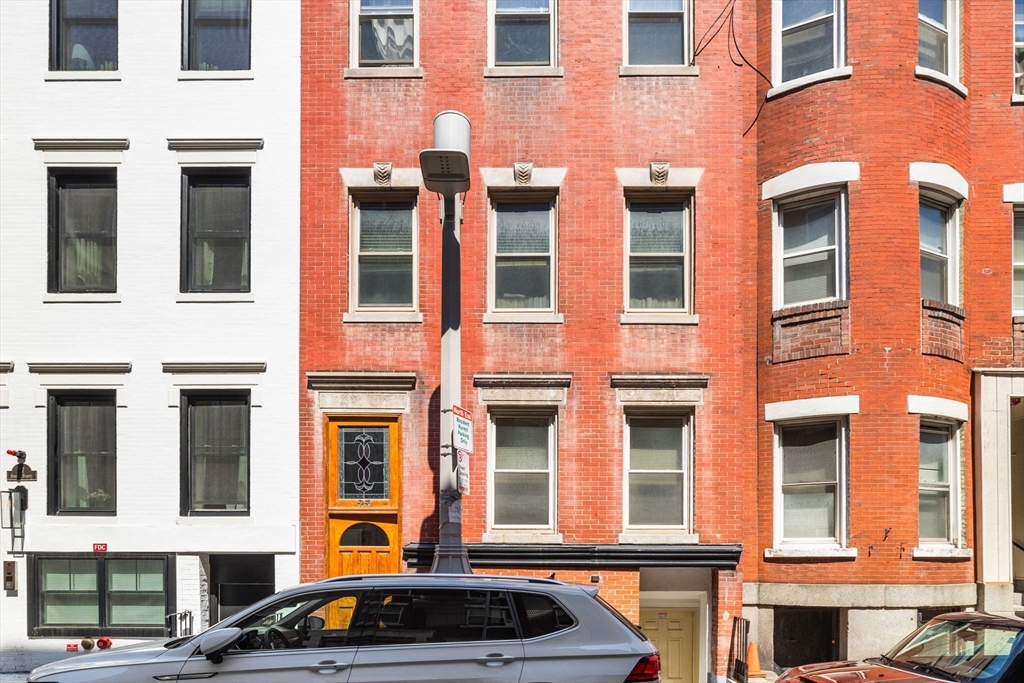
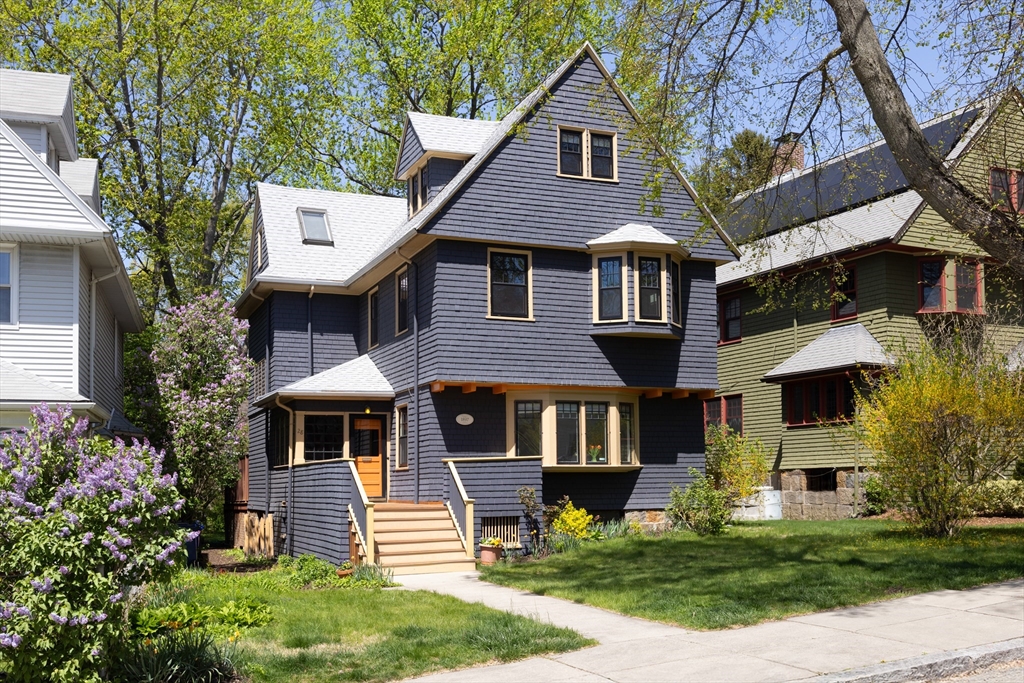
25 Sheafe St, Boston, MA 02113
$-11,892
Cash flow
-20.7%
Cash-on-Cash Return
0.9%
Cap rate
0.2%
Rent to Value Ratio

Active
$1,089,000
2
bds
|
1
ba
|
1,015
sqft
|
built
1910
114 Fenway, Boston, MA 02115
$-3,619
Cash flow
-17.3%
Cash-on-Cash Return
1.7%
Cap rate
0.3%
Rent to Value Ratio
Active
$1,349,000
6
bds
|
3
ba
|
3,027
sqft
|
built
1894
15 Centervale Park, Boston, MA 02124
$-4,594
Cash flow
-17.8%
Cash-on-Cash Return
1.6%
Cap rate
0.3%
Rent to Value Ratio

Active
$995,000
4
bds
|
2
ba
|
1,785
sqft
|
built
1900
4 Ethel St, Boston, MA 02131
$-2,336
Cash flow
-12.2%
Cash-on-Cash Return
2.9%
Cap rate
0.4%
Rent to Value Ratio

Active
$635,000
1
bds
|
1
ba
|
406
sqft
|
built
1837
12 Melrose St, Boston, MA 02116
$-1,781
Cash flow
-14.6%
Cash-on-Cash Return
2.3%
Cap rate
0.4%
Rent to Value Ratio
Active
$765,000
2
bds
|
1
ba
|
934
sqft
|
built
1900
857 Beacon St, Boston, MA 02215
$-2,656
Cash flow
-18.1%
Cash-on-Cash Return
1.5%
Cap rate
0.4%
Rent to Value Ratio
Active
$599,000
1
bds
|
1
ba
|
837
sqft
|
built
2011
691 Massachusetts Ave, Boston, MA 02118
$-1,955
Cash flow
-17.0%
Cash-on-Cash Return
1.8%
Cap rate
0.5%
Rent to Value Ratio
Active
$2,849,000
9
bds
|
3
ba
|
4,221
sqft
|
built
1900
915 E 4th St, Boston, MA 02127
$-11,880
Cash flow
-21.8%
Cash-on-Cash Return
0.7%
Cap rate
0.2%
Rent to Value Ratio

Active
$649,000
1
bds
|
1
ba
|
715
sqft
|
built
1887
309 Emerson St, Boston, MA 02127
$-1,730
Cash flow
-13.9%
Cash-on-Cash Return
2.5%
Cap rate
0.5%
Rent to Value Ratio
Active
$675,000
1
bds
|
1
ba
|
708
sqft
|
built
1905
528 Tremont St, Boston, MA 02116
$-1,618
Cash flow
-12.5%
Cash-on-Cash Return
2.8%
Cap rate
0.5%
Rent to Value Ratio

Active
$2,595,000
4
bds
|
4
ba
|
2,892
sqft
|
built
1890
289 K St, Boston, MA 02127
$-10,241
Cash flow
-20.6%
Cash-on-Cash Return
0.9%
Cap rate
0.2%
Rent to Value Ratio
Active
$1,325,000
3
bds
|
3
ba
|
2,125
sqft
|
built
2006
41 Bynner St, Boston, MA 02130
$-2,918
Cash flow
-11.5%
Cash-on-Cash Return
3.0%
Cap rate
0.4%
Rent to Value Ratio

Active
$1,150,000
3
bds
|
3
ba
|
1,932
sqft
|
built
2021
11 Conway St, Boston, MA 02131
$-2,258
Cash flow
-10.2%
Cash-on-Cash Return
3.3%
Cap rate
0.5%
Rent to Value Ratio
Active
$375,000
2
bds
|
2
ba
|
689
sqft
|
built
1920
55 Devon St, Boston, MA 02121
$-372
Cash flow
-5.2%
Cash-on-Cash Return
4.5%
Cap rate
0.7%
Rent to Value Ratio
Active
$580,000
2
bds
|
2
ba
|
782
sqft
|
built
1989
15 N Beacon St, Boston, MA 02134
$-1,823
Cash flow
-16.4%
Cash-on-Cash Return
1.9%
Cap rate
0.6%
Rent to Value Ratio

Active
$1,800,000
5
bds
|
6
ba
|
4,357
sqft
|
built
2024
1 Marlin Rd, Boston, MA 02132
$-6,031
Cash flow
-17.5%
Cash-on-Cash Return
1.7%
Cap rate
0.3%
Rent to Value Ratio
Active
$799,000
2
bds
|
2
ba
|
1,180
sqft
|
built
1900
251 Heath St, Boston, MA 02130
$-2,578
Cash flow
-16.8%
Cash-on-Cash Return
1.8%
Cap rate
0.5%
Rent to Value Ratio

Active
$1,175,000
3
bds
|
2
ba
|
1,902
sqft
|
built
1939
80 Mount Vernon St, Boston, MA 02108
$-3,721
Cash flow
-16.5%
Cash-on-Cash Return
1.9%
Cap rate
0.3%
Rent to Value Ratio
Active
$520,000
1
bds
|
1
ba
|
530
sqft
|
built
1880
288 W 3rd St, Boston, MA 02127
$-1,040
Cash flow
-10.4%
Cash-on-Cash Return
3.3%
Cap rate
0.6%
Rent to Value Ratio
Active
$1,695,000
2
bds
|
2
ba
|
1,425
sqft
|
built
1890
12 Concord Sq, Boston, MA 02118
$-5,064
Cash flow
-15.6%
Cash-on-Cash Return
2.1%
Cap rate
0.3%
Rent to Value Ratio
Active
$820,000
1
bds
|
1
ba
|
987
sqft
|
built
2003
234 Causeway St, Boston, MA 02114
$-3,400
Cash flow
-21.6%
Cash-on-Cash Return
0.7%
Cap rate
0.4%
Rent to Value Ratio
Active
$1,635,000
2
bds
|
2
ba
|
1,719
sqft
|
built
1920
437 D St, Boston, MA 02210
$-6,369
Cash flow
-20.3%
Cash-on-Cash Return
1.0%
Cap rate
0.3%
Rent to Value Ratio

Active
$839,000
2
bds
|
2
ba
|
1,277
sqft
|
built
2002
300 Allston St, Boston, MA 02135
$-2,467
Cash flow
-15.3%
Cash-on-Cash Return
2.1%
Cap rate
0.5%
Rent to Value Ratio

Active
$1,179,000
2
bds
|
3
ba
|
1,331
sqft
|
built
2014
525 E 1st St, Boston, MA 02127
$-2,768
Cash flow
-12.2%
Cash-on-Cash Return
2.9%
Cap rate
0.5%
Rent to Value Ratio
Active
$1,365,000
6
bds
|
2
ba
|
2,637
sqft
|
built
1897
28 Roslin St, Boston, MA 02124
$-3,323
Cash flow
-12.7%
Cash-on-Cash Return
2.8%
Cap rate
0.4%
Rent to Value Ratio
Active
$850,000
2
bds
|
2
ba
|
1,496
sqft
|
built
2012
350 W 2nd St, Boston, MA 02127
$-2,017
Cash flow
-12.4%
Cash-on-Cash Return
2.8%
Cap rate
0.6%
Rent to Value Ratio
Active
$1,229,000
1
bds
|
1
ba
|
646
sqft
|
built
2018
133 Seaport Blvd, Boston, MA 02210
$-4,544
Cash flow
-19.3%
Cash-on-Cash Return
1.2%
Cap rate
0.4%
Rent to Value Ratio
Active
$1,150,000
3
bds
|
3
ba
|
1,932
sqft
|
built
2021
11 Conway St, Boston, MA 02131
$-2,939
Cash flow
-13.3%
Cash-on-Cash Return
2.6%
Cap rate
0.4%
Rent to Value Ratio
Active
$2,750,000
3
bds
|
2
ba
|
1,500
sqft
|
built
1867
60 Commonwealth Ave, Boston, MA 02116
$-10,103
Cash flow
-19.2%
Cash-on-Cash Return
1.3%
Cap rate
0.3%
Rent to Value Ratio
Active
$1,059,000
1
bds
|
1
ba
|
932
sqft
|
built
1899
112 W Concord St, Boston, MA 02118
$-3,443
Cash flow
-17.0%
Cash-on-Cash Return
1.8%
Cap rate
0.4%
Rent to Value Ratio
Active
$939,000
1
bds
|
1
ba
|
739
sqft
|
built
1899
319 A St, Boston, MA 02210
$-3,637
Cash flow
-20.2%
Cash-on-Cash Return
1.0%
Cap rate
0.4%
Rent to Value Ratio
Active
$1,650,000
9
bds
|
5
ba
|
3,848
sqft
|
built
1865
109 Eutaw St, Boston, MA 02128
$-7,133
Cash flow
-22.6%
Cash-on-Cash Return
0.5%
Cap rate
0.2%
Rent to Value Ratio
Active
$851,000
2
bds
|
1
ba
|
851
sqft
|
built
1915
95 Gainsborough St, Boston, MA 02115
$-2,319
Cash flow
-14.2%
Cash-on-Cash Return
2.4%
Cap rate
0.5%
Rent to Value Ratio
Active
$1,295,000
2
bds
|
1
ba
|
941
sqft
|
built
1900
66 Waltham St, Boston, MA 02118
$-4,164
Cash flow
-16.8%
Cash-on-Cash Return
1.8%
Cap rate
0.4%
Rent to Value Ratio

Active
$689,000
2
bds
|
2
ba
|
1,316
sqft
|
built
2018
178 Thornton St, Boston, MA 02119
$-1,799
Cash flow
-13.6%
Cash-on-Cash Return
2.5%
Cap rate
0.6%
Rent to Value Ratio
Active
$1,125,000
2
bds
|
2
ba
|
1,261
sqft
|
built
2006
141 Dorchester Ave, Boston, MA 02127
$-3,530
Cash flow
-16.4%
Cash-on-Cash Return
1.9%
Cap rate
0.5%
Rent to Value Ratio

Active
$5,950,000
4
bds
|
5
ba
|
4,138
sqft
|
built
1827
16 W Cedar St, Boston, MA 02108
$-25,500
Cash flow
-22.4%
Cash-on-Cash Return
0.5%
Cap rate
0.2%
Rent to Value Ratio
Active
$1,350,000
2
bds
|
2
ba
|
1,075
sqft
|
built
2021
45 Lewis St, Boston, MA 02128
$-5,233
Cash flow
-20.2%
Cash-on-Cash Return
1.0%
Cap rate
0.3%
Rent to Value Ratio
Active
$779,000
1
bds
|
1
ba
|
928
sqft
|
built
1899
234 Causeway St, Boston, MA 02114
$-2,530
Cash flow
-16.9%
Cash-on-Cash Return
1.8%
Cap rate
0.5%
Rent to Value Ratio