Boston, MA Investment Properties for Sale
Browse homes for sale and investment properties in Boston, MA. Refine your search by price, property type, or more.
Best cash flowing properties in Boston, MA
Active
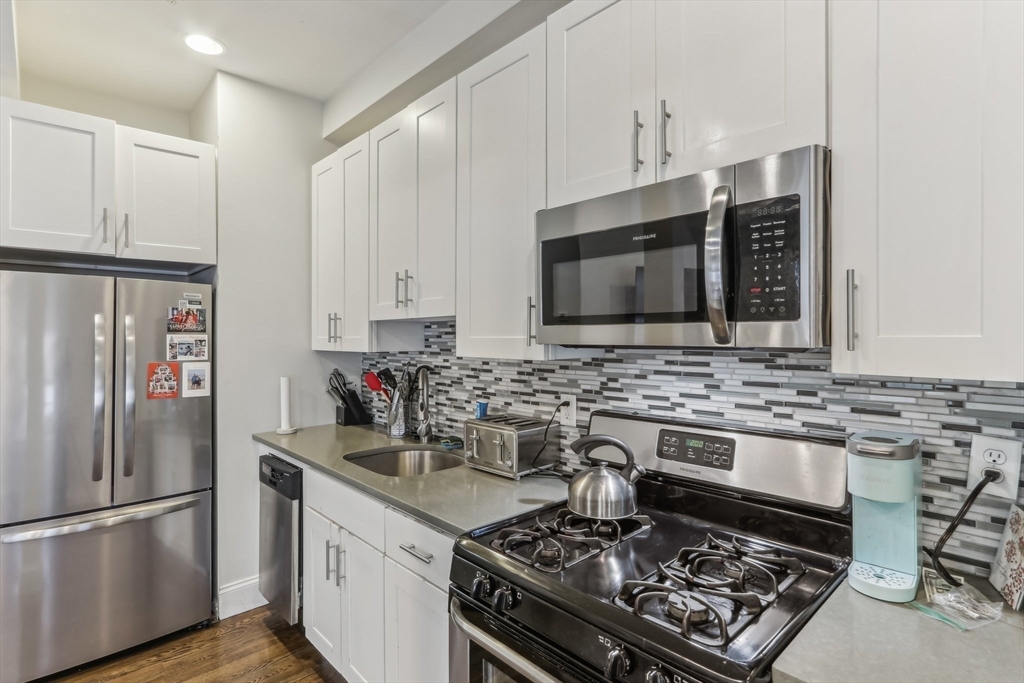
$299,500
2
bds
|
1
ba
|
712
sqft
|
built
1965
7 Oakcrest Rd, Boston, MA 02136
$-699
Cash flow
-12.2%
Cash-on-Cash Return
3.5%
Cap rate
0.8%
Rent to Value Ratio
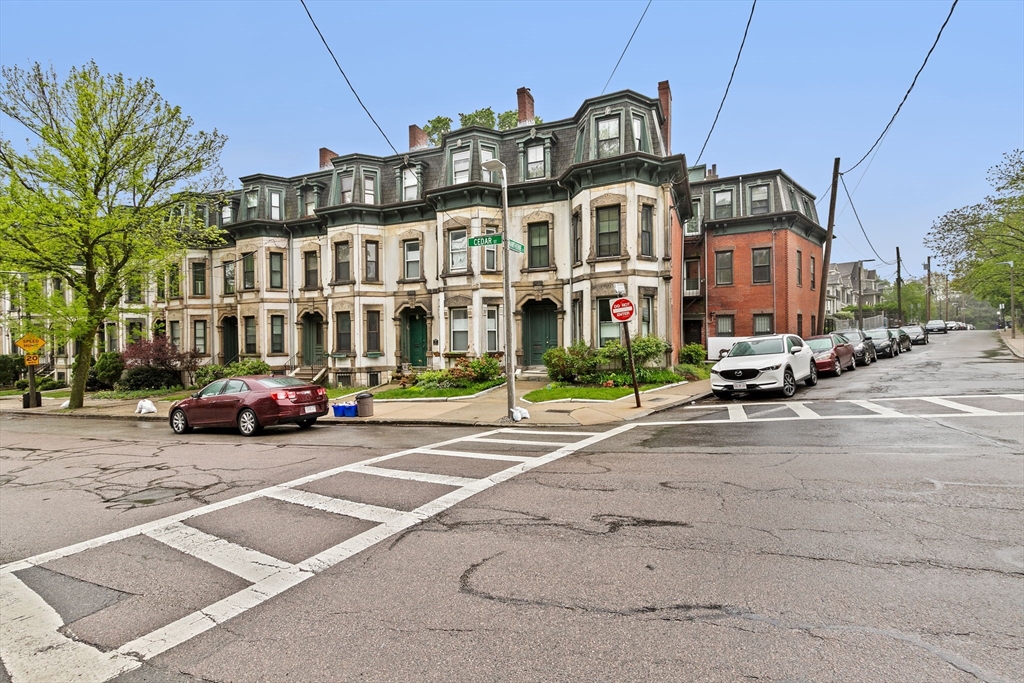
Pending
$535,000
2
bds
|
2
ba
|
1,131
sqft
|
built
1900
46A Cedar St, Boston, MA 02119
$-1,061
Cash flow
-10.3%
Cash-on-Cash Return
3.9%
Cap rate
0.7%
Rent to Value Ratio
1,044 out of 1,662 properties for sale in Boston, MA
Limited Results Shown
Create a free account, or log in to reveal all property listings and enjoy the complete experience.
Active
$3,500,000
12
bds
|
8
ba
|
4,889
sqft
|
built
1920
845 E 2nd St, Boston, MA 02127
$-16,338
Cash flow
-24.4%
Cash-on-Cash Return
0.7%
Cap rate
0.1%
Rent to Value Ratio
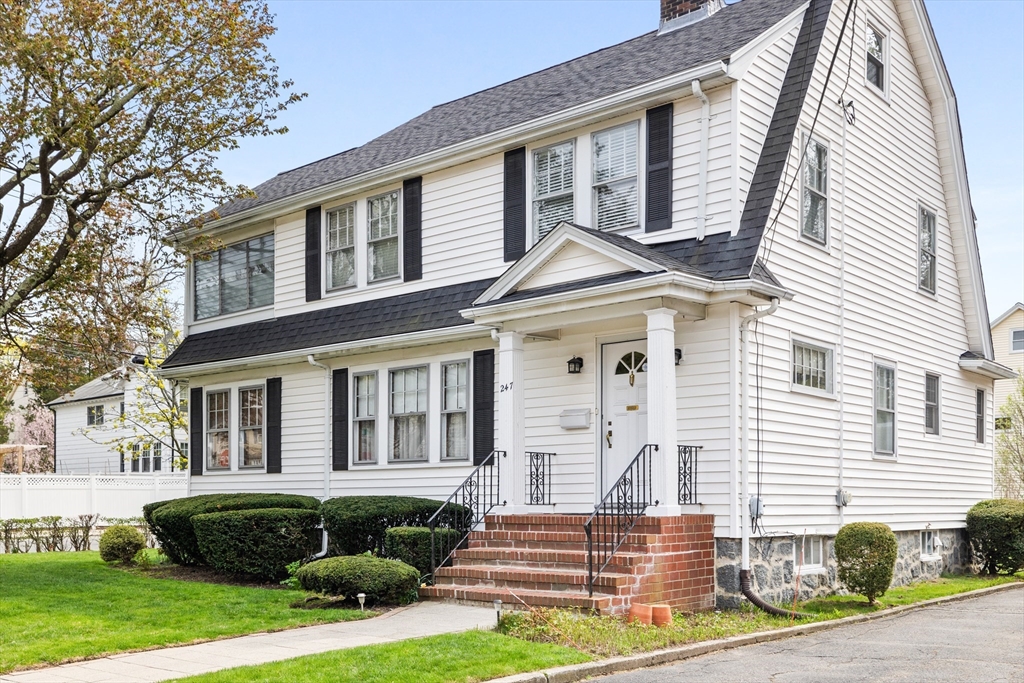
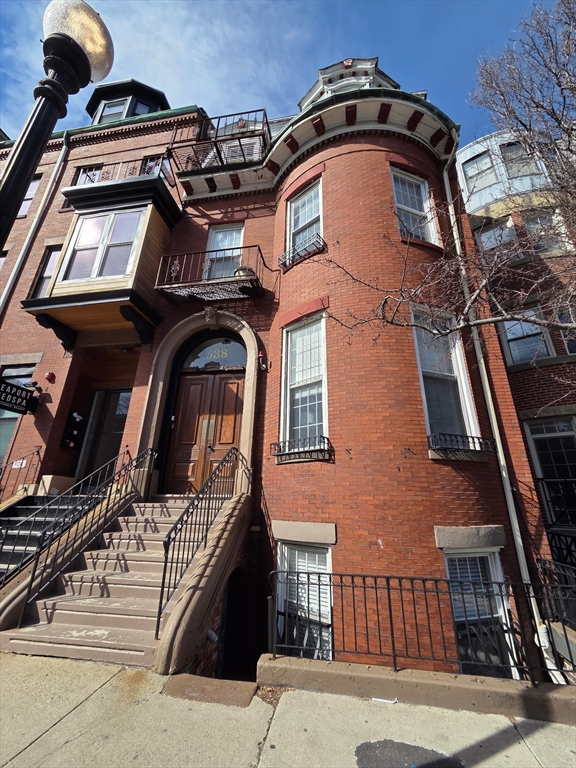
Active
$1,199,000
4
bds
|
2
ba
|
2,763
sqft
|
built
1931
247 Bellevue St, Boston, MA 02132
$-4,011
Cash flow
-17.5%
Cash-on-Cash Return
2.3%
Cap rate
0.3%
Rent to Value Ratio
Active
$599,900
2
bds
|
1
ba
|
800
sqft
|
built
1899
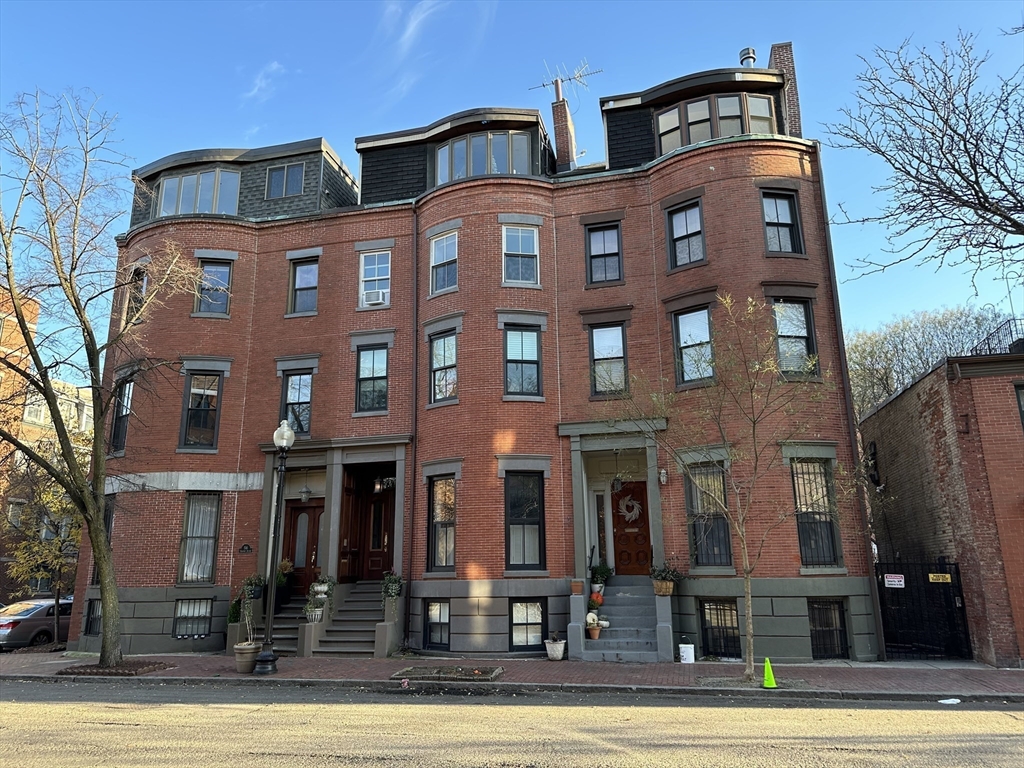
520 Shawmut Ave, Boston, MA 02118
$-1,932
Cash flow
-16.8%
Cash-on-Cash Return
2.4%
Cap rate
0.5%
Rent to Value Ratio
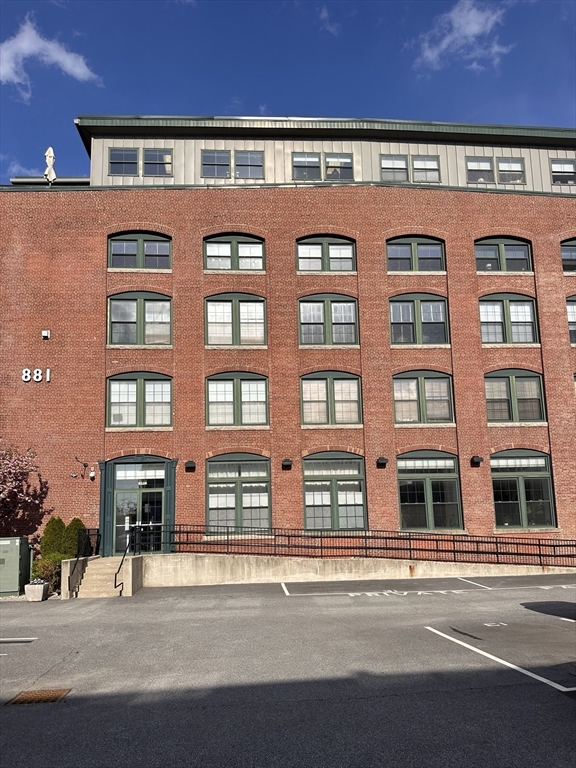
Active
$739,000
1
bds
|
1
ba
|
1,039
sqft
|
built
1899
881 E 1st St, Boston, MA 02127
$-1,736
Cash flow
-12.3%
Cash-on-Cash Return
3.4%
Cap rate
0.5%
Rent to Value Ratio
Active
$955,000
2
bds
|
2
ba
|
1,063
sqft
|
built
2020
420 W Broadway, Boston, MA 02127
$-2,613
Cash flow
-14.3%
Cash-on-Cash Return
3.0%
Cap rate
0.5%
Rent to Value Ratio
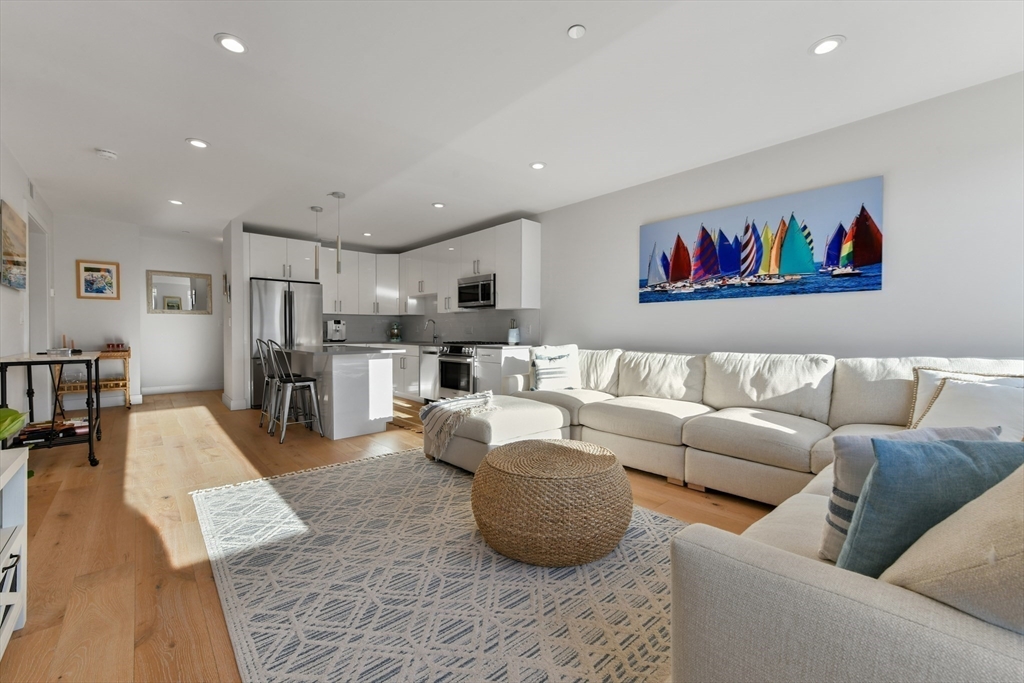
Active
$899,000
1
bds
|
2
ba
|
881
sqft
|
built
1920
120 Norway St, Boston, MA 02115
$-2,938
Cash flow
-17.1%
Cash-on-Cash Return
2.3%
Cap rate
0.5%
Rent to Value Ratio
Active
$2,599,000
2
bds
|
3
ba
|
1,953
sqft
|
built
2013
251 Shawmut Ave, Boston, MA 02118
$-9,586
Cash flow
-19.2%
Cash-on-Cash Return
1.8%
Cap rate
0.4%
Rent to Value Ratio
Active
$875,000
2
bds
|
2
ba
|
966
sqft
|
built
1900
2 Clarendon St, Boston, MA 02116
$-3,573
Cash flow
-21.3%
Cash-on-Cash Return
1.4%
Cap rate
0.5%
Rent to Value Ratio
Active
$849,900
2
bds
|
2
ba
|
952
sqft
|
built
2019
3531 Washington St, Boston, MA 02130
$-2,799
Cash flow
-17.2%
Cash-on-Cash Return
2.3%
Cap rate
0.5%
Rent to Value Ratio
Active
$299,500
2
bds
|
1
ba
|
712
sqft
|
built
1965
7 Oakcrest Rd, Boston, MA 02136
$-699
Cash flow
-12.2%
Cash-on-Cash Return
3.5%
Cap rate
0.8%
Rent to Value Ratio
Active
$1,345,000
2
bds
|
2
ba
|
966
sqft
|
built
2007
45 Province St, Boston, MA 02108
$-5,243
Cash flow
-20.3%
Cash-on-Cash Return
1.6%
Cap rate
0.4%
Rent to Value Ratio
Active
$1,888,800
3
bds
|
2
ba
|
1,790
sqft
|
built
1881
197 Commonwealth Ave, Boston, MA 02116
$-6,786
Cash flow
-18.7%
Cash-on-Cash Return
2.0%
Cap rate
0.4%
Rent to Value Ratio
Active
$6,995,000
2
bds
|
3
ba
|
2,162
sqft
|
built
2015
22 Liberty Pl, Boston, MA 02127
$-38,645
Cash flow
-28.8%
Cash-on-Cash Return
-0.4%
Cap rate
0.1%
Rent to Value Ratio
Pending
$535,000
2
bds
|
2
ba
|
1,131
sqft
|
built
1900
46A Cedar St, Boston, MA 02119
$-1,061
Cash flow
-10.3%
Cash-on-Cash Return
3.9%
Cap rate
0.7%
Rent to Value Ratio
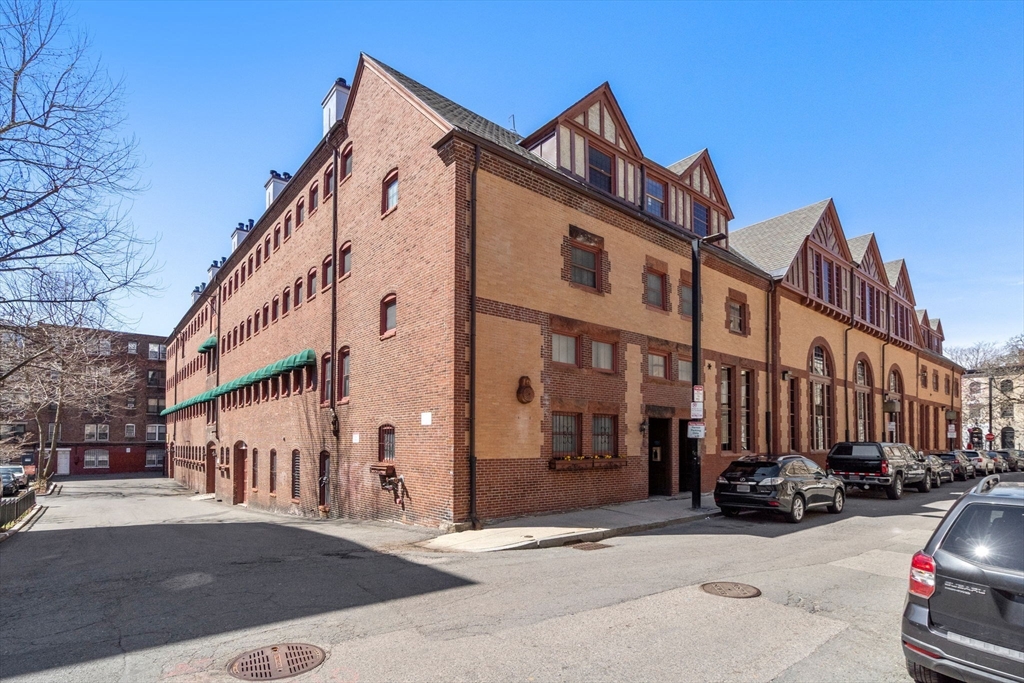
Active
$875,000
2
bds
|
2
ba
|
1,176
sqft
|
built
1905
290 W 5th St, Boston, MA 02127
$-2,706
Cash flow
-16.1%
Cash-on-Cash Return
2.6%
Cap rate
0.5%
Rent to Value Ratio
Active
$649,500
1
bds
|
1
ba
|
675
sqft
|
built
1890
110 Riverway, Boston, MA 02215
$-1,874
Cash flow
-15.1%
Cash-on-Cash Return
2.8%
Cap rate
0.5%
Rent to Value Ratio
Pending
$1,479,000
11
bds
|
4
ba
|
4,053
sqft
|
built
1900
154 Stanwood St, Boston, MA 02121
$-6,207
Cash flow
-21.9%
Cash-on-Cash Return
1.2%
Cap rate
0.2%
Rent to Value Ratio
Active
$899,000
1
bds
|
2
ba
|
935
sqft
|
built
2020
771 Harrison Ave, Boston, MA 02118
$-2,726
Cash flow
-15.8%
Cash-on-Cash Return
2.6%
Cap rate
0.5%
Rent to Value Ratio
Active
$1,335,000
5
bds
|
2
ba
|
2,288
sqft
|
built
1910
102 Greaton Rd, Boston, MA 02132
$-5,040
Cash flow
-19.7%
Cash-on-Cash Return
1.7%
Cap rate
0.3%
Rent to Value Ratio
Active
$750,000
4
bds
|
2
ba
|
1,480
sqft
|
built
1958
85 Salman St, Boston, MA 02132
$-2,044
Cash flow
-14.2%
Cash-on-Cash Return
3.0%
Cap rate
0.5%
Rent to Value Ratio
Active
$649,999
3
bds
|
2
ba
|
1,837
sqft
|
built
1935
78 Hutchings St, Boston, MA 02121
$-1,113
Cash flow
-8.9%
Cash-on-Cash Return
4.2%
Cap rate
0.6%
Rent to Value Ratio
Pending
$1,375,000
3
bds
|
3
ba
|
1,655
sqft
|
built
2016
111 B St, Boston, MA 02127
$-4,092
Cash flow
-15.5%
Cash-on-Cash Return
2.7%
Cap rate
0.5%
Rent to Value Ratio
Active
$2,795,000
3
bds
|
3
ba
|
3,082
sqft
|
built
1900
22 Worcester Sq, Boston, MA 02118
$-11,161
Cash flow
-20.8%
Cash-on-Cash Return
1.5%
Cap rate
0.3%
Rent to Value Ratio
Active
$919,000
2
bds
|
2
ba
|
953
sqft
|
built
2022
457 W Broadway, Boston, MA 02127
$-2,947
Cash flow
-16.7%
Cash-on-Cash Return
2.4%
Cap rate
0.5%
Rent to Value Ratio
Active
$595,000
2
bds
|
1
ba
|
933
sqft
|
built
1895
121 E Cottage St, Boston, MA 02125
$-1,878
Cash flow
-16.5%
Cash-on-Cash Return
2.5%
Cap rate
0.5%
Rent to Value Ratio
Active
$2,750,000
10
bds
|
6
ba
|
3,717
sqft
|
built
1920
781 Parker St, Boston, MA 02120
$-12,379
Cash flow
-23.5%
Cash-on-Cash Return
0.9%
Cap rate
0.2%
Rent to Value Ratio
Active under contract
$739,900
4
bds
|
2
ba
|
1,596
sqft
|
built
1964
202 Glenellen Rd, Boston, MA 02132
$-1,751
Cash flow
-12.3%
Cash-on-Cash Return
3.4%
Cap rate
0.5%
Rent to Value Ratio
Active
$599,900
3
bds
|
1
ba
|
1,300
sqft
|
built
1925
1472 Commonwealth Ave, Boston, MA 02135
$-1,784
Cash flow
-15.5%
Cash-on-Cash Return
2.7%
Cap rate
0.6%
Rent to Value Ratio
Active
$5,990,000
3
bds
|
4
ba
|
4,002
sqft
|
built
2006
500 Atlantic Ave, Boston, MA 02210
$-36,981
Cash flow
-32.2%
Cash-on-Cash Return
-1.1%
Cap rate
0.2%
Rent to Value Ratio
Active
$4,000,488
8
bds
|
8
ba
|
3,292
sqft
|
built
1920
538 E Broadway, Boston, MA 02127
$-20,228
Cash flow
-26.4%
Cash-on-Cash Return
0.2%
Cap rate
0.1%
Rent to Value Ratio
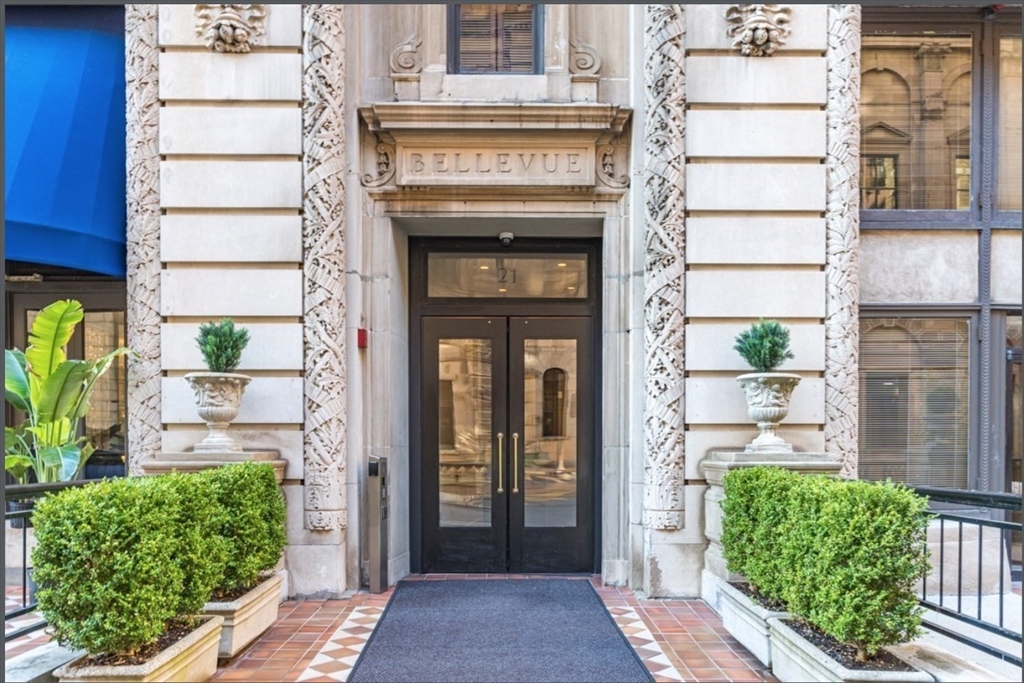
Active
$518,000
1
bds
|
1
ba
|
325
sqft
|
built
1899
21 Beacon St, Boston, MA 02108
$-1,516
Cash flow
-15.3%
Cash-on-Cash Return
2.8%
Cap rate
0.5%
Rent to Value Ratio
Active
$1,375,000
2
bds
|
2
ba
|
1,215
sqft
|
built
1899
199 State St, Boston, MA 02109
$-5,958
Cash flow
-22.6%
Cash-on-Cash Return
1.1%
Cap rate
0.3%
Rent to Value Ratio

Active
$1,850,000
2
bds
|
2
ba
|
1,208
sqft
|
built
1850
28 Atlantic Ave, Boston, MA 02110
$-8,016
Cash flow
-22.6%
Cash-on-Cash Return
1.1%
Cap rate
0.4%
Rent to Value Ratio
Active under contract
$619,000
2
bds
|
1
ba
|
762
sqft
|
built
1940
200 W 8th St, Boston, MA 02127
$-1,602
Cash flow
-13.5%
Cash-on-Cash Return
3.2%
Cap rate
0.6%
Rent to Value Ratio
Active
$4,250,000
3
bds
|
3
ba
|
1,973
sqft
|
built
1987
20 Rowes Wharf, Boston, MA 02110
$-23,545
Cash flow
-28.9%
Cash-on-Cash Return
-0.4%
Cap rate
0.2%
Rent to Value Ratio
Pending
$1,075,000
4
bds
|
3
ba
|
2,080
sqft
|
built
1955
48 Nonantum St, Boston, MA 02135
$-3,709
Cash flow
-18.0%
Cash-on-Cash Return
2.1%
Cap rate
0.4%
Rent to Value Ratio
Active
$3,575,000
1
bds
|
2
ba
|
1,125
sqft
|
built
1982
2 Commonwealth Ave, Boston, MA 02116
$-18,679
Cash flow
-27.3%
Cash-on-Cash Return
0.0%
Cap rate
0.2%
Rent to Value Ratio
Active
$675,000
1
bds
|
1
ba
|
535
sqft
|
built
1899
21 Beacon St, Boston, MA 02108
$-2,348
Cash flow
-18.1%
Cash-on-Cash Return
2.1%
Cap rate
0.5%
Rent to Value Ratio
Active
$5,650,000
3
bds
|
5
ba
|
4,013
sqft
|
built
1827
32 W Cedar St, Boston, MA 02108
$-27,164
Cash flow
-25.1%
Cash-on-Cash Return
0.5%
Cap rate
0.2%
Rent to Value Ratio
Active
$1,490,000
5
bds
|
3
ba
|
2,016
sqft
|
built
1872
31 Worthington St, Boston, MA 02120
$-3,388
Cash flow
-11.9%
Cash-on-Cash Return
3.5%
Cap rate
0.5%
Rent to Value Ratio