Boston, MA Investment Properties for Sale
Browse homes for sale and investment properties in Boston, MA. Refine your search by price, property type, or more.
Best cash flowing properties in Boston, MA
Active
$375,000
2
bds
|
2
ba
|
689
sqft
|
built
1920
55 Devon St, Boston, MA 02121
$-555
Cash flow
-7.7%
Cash-on-Cash Return
4.5%
Cap rate
0.7%
Rent to Value Ratio
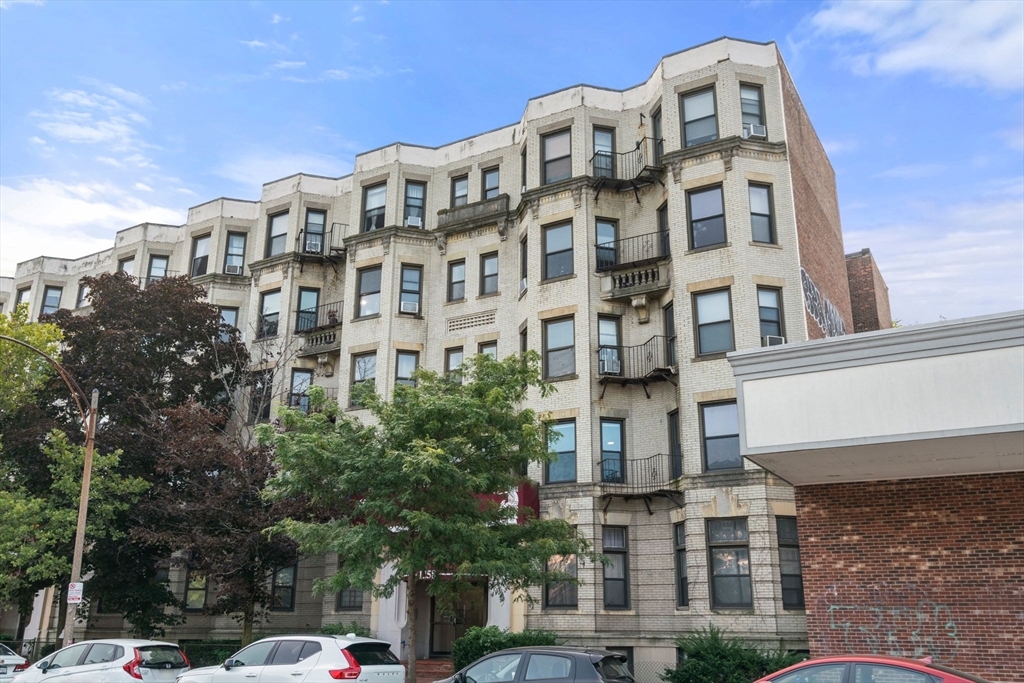
Active
$349,000
1
bds
|
1
ba
|
357
sqft
|
built
1920
1258 Commonwealth Ave, Boston, MA 02134
$-842
Cash flow
-12.6%
Cash-on-Cash Return
3.4%
Cap rate
0.6%
Rent to Value Ratio
1,049 out of 1,672 properties for sale in Boston, MA
Limited Results Shown
Create a free account, or log in to reveal all property listings and enjoy the complete experience.
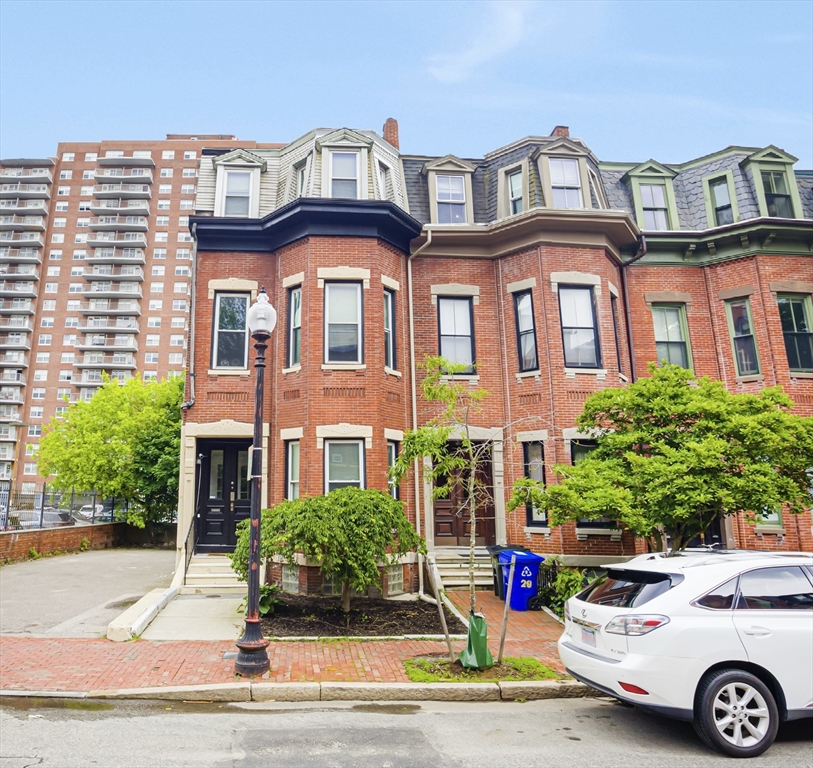
Active
$1,490,000
5
bds
|
3
ba
|
2,016
sqft
|
built
1872
31 Worthington St, Boston, MA 02120
$-3,388
Cash flow
-11.9%
Cash-on-Cash Return
3.5%
Cap rate
0.5%
Rent to Value Ratio
Active
$349,000
1
bds
|
1
ba
|
357
sqft
|
built
1920
1258 Commonwealth Ave, Boston, MA 02134
$-842
Cash flow
-12.6%
Cash-on-Cash Return
3.4%
Cap rate
0.6%
Rent to Value Ratio
Active
$1,150,000
2
bds
|
3
ba
|
2,184
sqft
|
built
1895
1241-1251 Adams St, Boston, MA 02124
$-5,101
Cash flow
-23.1%
Cash-on-Cash Return
0.9%
Cap rate
0.4%
Rent to Value Ratio
Active
$2,899,999
7
bds
|
6
ba
|
3,000
sqft
|
built
1910
25 Sheafe St, Boston, MA 02113
$-12,835
Cash flow
-23.1%
Cash-on-Cash Return
1.0%
Cap rate
0.2%
Rent to Value Ratio

Active
$949,000
4
bds
|
2
ba
|
1,785
sqft
|
built
1900
4 Ethel St, Boston, MA 02131
$-2,581
Cash flow
-14.2%
Cash-on-Cash Return
3.0%
Cap rate
0.4%
Rent to Value Ratio
Active
$765,000
2
bds
|
1
ba
|
934
sqft
|
built
1900
857 Beacon St, Boston, MA 02215
$-3,030
Cash flow
-20.7%
Cash-on-Cash Return
1.5%
Cap rate
0.4%
Rent to Value Ratio
Active
$1,100,000
3
bds
|
3
ba
|
1,932
sqft
|
built
2021
11 Conway St, Boston, MA 02131
$-3,240
Cash flow
-15.4%
Cash-on-Cash Return
2.7%
Cap rate
0.5%
Rent to Value Ratio
Active
$850,000
2
bds
|
2
ba
|
1,496
sqft
|
built
2012
350 W 2nd St, Boston, MA 02127
$-2,433
Cash flow
-14.9%
Cash-on-Cash Return
2.8%
Cap rate
0.6%
Rent to Value Ratio
Active
$1,179,000
2
bds
|
3
ba
|
1,331
sqft
|
built
2014
525 E 1st St, Boston, MA 02127
$-3,344
Cash flow
-14.8%
Cash-on-Cash Return
2.9%
Cap rate
0.5%
Rent to Value Ratio
Active
$1,199,000
1
bds
|
1
ba
|
646
sqft
|
built
2018
133 Seaport Blvd, Boston, MA 02210
$-4,988
Cash flow
-21.7%
Cash-on-Cash Return
1.3%
Cap rate
0.5%
Rent to Value Ratio
Active
$2,849,000
9
bds
|
3
ba
|
4,221
sqft
|
built
1900
915 E 4th St, Boston, MA 02127
$-13,272
Cash flow
-24.3%
Cash-on-Cash Return
0.7%
Cap rate
0.2%
Rent to Value Ratio
Active
$375,000
2
bds
|
2
ba
|
689
sqft
|
built
1920
55 Devon St, Boston, MA 02121
$-555
Cash flow
-7.7%
Cash-on-Cash Return
4.5%
Cap rate
0.7%
Rent to Value Ratio
Active
$560,000
2
bds
|
2
ba
|
782
sqft
|
built
1989
15 N Beacon St, Boston, MA 02134
$-2,002
Cash flow
-18.7%
Cash-on-Cash Return
2.0%
Cap rate
0.6%
Rent to Value Ratio

Pending
$1,800,000
5
bds
|
6
ba
|
4,357
sqft
|
built
2024
1 Marlin Rd, Boston, MA 02132
$-6,910
Cash flow
-20.0%
Cash-on-Cash Return
1.7%
Cap rate
0.3%
Rent to Value Ratio
Active
$785,000
2
bds
|
2
ba
|
1,058
sqft
|
built
1900
251 Heath St, Boston, MA 02130
$-2,895
Cash flow
-19.2%
Cash-on-Cash Return
1.8%
Cap rate
0.5%
Rent to Value Ratio
Active under contract
$1,175,000
3
bds
|
2
ba
|
1,902
sqft
|
built
1939
80 Mount Vernon St, Boston, MA 02108
$-4,295
Cash flow
-19.1%
Cash-on-Cash Return
1.9%
Cap rate
0.3%
Rent to Value Ratio
Active
$2,595,000
4
bds
|
4
ba
|
2,892
sqft
|
built
1890
289 K St, Boston, MA 02127
$-11,509
Cash flow
-23.1%
Cash-on-Cash Return
0.9%
Cap rate
0.2%
Rent to Value Ratio
Active
$1,100,000
3
bds
|
3
ba
|
1,932
sqft
|
built
2021
11 Conway St, Boston, MA 02131
$-2,559
Cash flow
-12.1%
Cash-on-Cash Return
3.5%
Cap rate
0.5%
Rent to Value Ratio
Active
$1,625,000
2
bds
|
2
ba
|
1,425
sqft
|
built
1890
12 Concord Sq, Boston, MA 02118
$-5,527
Cash flow
-17.7%
Cash-on-Cash Return
2.2%
Cap rate
0.4%
Rent to Value Ratio
Active
$820,000
1
bds
|
1
ba
|
987
sqft
|
built
2003
234 Causeway St, Boston, MA 02114
$-3,801
Cash flow
-24.2%
Cash-on-Cash Return
0.7%
Cap rate
0.4%
Rent to Value Ratio
Active
$1,635,000
2
bds
|
2
ba
|
1,719
sqft
|
built
1920
437 D St, Boston, MA 02210
$-7,168
Cash flow
-22.9%
Cash-on-Cash Return
1.0%
Cap rate
0.3%
Rent to Value Ratio

Active
$799,000
2
bds
|
2
ba
|
1,277
sqft
|
built
2002
300 Allston St, Boston, MA 02135
$-2,668
Cash flow
-17.4%
Cash-on-Cash Return
2.3%
Cap rate
0.5%
Rent to Value Ratio
Active
$2,750,000
3
bds
|
2
ba
|
1,500
sqft
|
built
1867
60 Commonwealth Ave, Boston, MA 02116
$-11,446
Cash flow
-21.7%
Cash-on-Cash Return
1.3%
Cap rate
0.3%
Rent to Value Ratio
Active
$939,000
1
bds
|
1
ba
|
739
sqft
|
built
1899
319 A St, Boston, MA 02210
$-4,095
Cash flow
-22.8%
Cash-on-Cash Return
1.0%
Cap rate
0.4%
Rent to Value Ratio
Active
$1,650,000
9
bds
|
5
ba
|
3,848
sqft
|
built
1865
109 Eutaw St, Boston, MA 02128
$-7,939
Cash flow
-25.1%
Cash-on-Cash Return
0.5%
Cap rate
0.2%
Rent to Value Ratio
Active
$851,000
2
bds
|
1
ba
|
851
sqft
|
built
1915
95 Gainsborough St, Boston, MA 02115
$-2,735
Cash flow
-16.8%
Cash-on-Cash Return
2.4%
Cap rate
0.5%
Rent to Value Ratio
Active
$1,295,000
2
bds
|
1
ba
|
941
sqft
|
built
1900
66 Waltham St, Boston, MA 02118
$-4,797
Cash flow
-19.3%
Cash-on-Cash Return
1.8%
Cap rate
0.4%
Rent to Value Ratio

Active
$689,000
2
bds
|
2
ba
|
1,316
sqft
|
built
2018
178 Thornton St, Boston, MA 02119
$-2,135
Cash flow
-16.2%
Cash-on-Cash Return
2.5%
Cap rate
0.6%
Rent to Value Ratio
Active
$1,125,000
2
bds
|
2
ba
|
1,261
sqft
|
built
2006
141 Dorchester Ave, Boston, MA 02127
$-4,079
Cash flow
-18.9%
Cash-on-Cash Return
1.9%
Cap rate
0.5%
Rent to Value Ratio
Active
$1,499,000
2
bds
|
2
ba
|
1,114
sqft
|
built
1890
19 Hancock St, Boston, MA 02114
$-5,350
Cash flow
-18.6%
Cash-on-Cash Return
2.0%
Cap rate
0.4%
Rent to Value Ratio
Active
$779,000
1
bds
|
1
ba
|
928
sqft
|
built
1899
234 Causeway St, Boston, MA 02114
$-2,911
Cash flow
-19.5%
Cash-on-Cash Return
1.8%
Cap rate
0.5%
Rent to Value Ratio
Active
$715,000
2
bds
|
2
ba
|
1,014
sqft
|
built
1988
147 Kelton St, Boston, MA 02134
$-2,304
Cash flow
-16.8%
Cash-on-Cash Return
2.4%
Cap rate
0.5%
Rent to Value Ratio

Active
$5,950,000
4
bds
|
5
ba
|
4,138
sqft
|
built
1827
16 W Cedar St, Boston, MA 02108
$-28,406
Cash flow
-24.9%
Cash-on-Cash Return
0.5%
Cap rate
0.2%
Rent to Value Ratio
Active
$1,350,000
2
bds
|
2
ba
|
1,075
sqft
|
built
2021
45 Lewis St, Boston, MA 02128
$-5,892
Cash flow
-22.8%
Cash-on-Cash Return
1.0%
Cap rate
0.3%
Rent to Value Ratio
Active
$539,900
2
bds
|
1
ba
|
671
sqft
|
built
1920
609-611 Dorchester Ave, Boston, MA 02127
$-1,324
Cash flow
-12.8%
Cash-on-Cash Return
3.3%
Cap rate
0.6%
Rent to Value Ratio
Active
$1,075,000
2
bds
|
2
ba
|
1,021
sqft
|
built
2006
181 Essex St, Boston, MA 02111
$-4,267
Cash flow
-20.7%
Cash-on-Cash Return
1.5%
Cap rate
0.4%
Rent to Value Ratio
Active
$515,000
2
bds
|
1
ba
|
820
sqft
|
built
1918
6 Bellvista Rd, Boston, MA 02135
$-1,556
Cash flow
-15.8%
Cash-on-Cash Return
2.6%
Cap rate
0.6%
Rent to Value Ratio
Active
$1,695,000
8
bds
|
3
ba
|
2,706
sqft
|
built
1905
7 Transit St, Boston, MA 02127
$-7,011
Cash flow
-21.6%
Cash-on-Cash Return
1.3%
Cap rate
0.3%
Rent to Value Ratio
Active
$1,295,000
2
bds
|
2
ba
|
1,220
sqft
|
built
2006
80 Broad St, Boston, MA 02110
$-5,267
Cash flow
-21.2%
Cash-on-Cash Return
1.4%
Cap rate
0.5%
Rent to Value Ratio
Active
$745,000
2
bds
|
1
ba
|
938
sqft
|
built
2020
610 Rutherford Ave, Boston, MA 02129
$-2,594
Cash flow
-18.2%
Cash-on-Cash Return
2.1%
Cap rate
0.5%
Rent to Value Ratio