Boston, MA Investment Properties for Sale
Browse homes for sale and investment properties in Boston, MA. Refine your search by price, property type, or more.
Best cash flowing properties in Boston, MA
Active
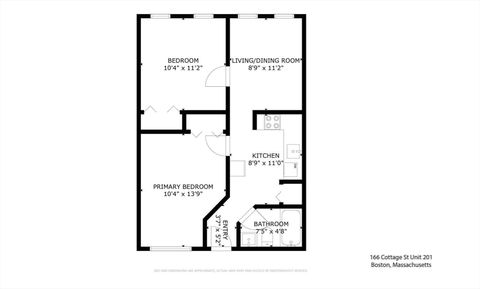
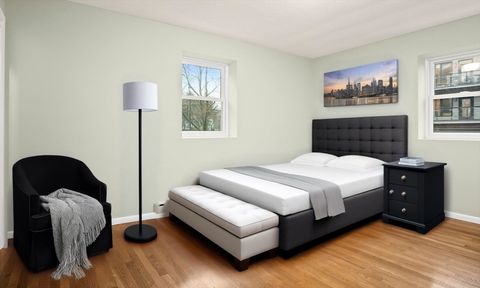
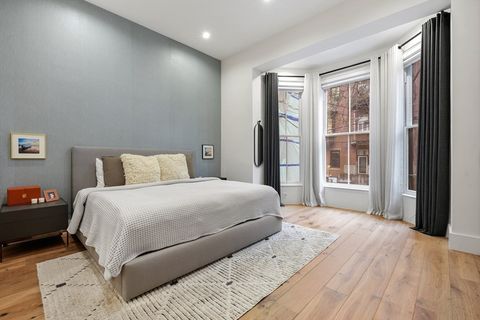
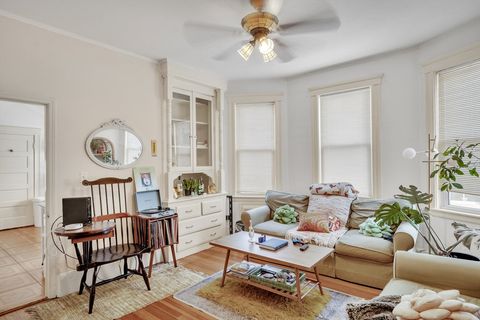
$429,900
2
bds
|
1
ba
|
574
sqft
|
built
1910
166 Cottage St, Boston, MA 02128
$-799
Cash flow
-9.7%
Cash-on-Cash Return
4.0%
Cap rate
0.6%
Rent to Value Ratio
Active
$389,900
2
bds
|
1
ba
|
735
sqft
|
built
1960
1185 Adams St, Boston, MA 02124
$-1,018
Cash flow
-13.6%
Cash-on-Cash Return
3.1%
Cap rate
0.6%
Rent to Value Ratio
1,112 out of 1,762 properties for sale in Boston, MA
Limited Results Shown
Create a free account, or log in to reveal all property listings and enjoy the complete experience.
Active
$4,750,000
4
bds
|
4
ba
|
2,179
sqft
|
built
1900
7 Marlborough St, Boston, MA 02116
$-22,167
Cash flow
-24.3%
Cash-on-Cash Return
0.7%
Cap rate
0.2%
Rent to Value Ratio
Active
$899,900
1
bds
|
1
ba
|
747
sqft
|
built
2019
65 Lewis St, Boston, MA 02128
$-3,280
Cash flow
-19.0%
Cash-on-Cash Return
1.9%
Cap rate
0.4%
Rent to Value Ratio
Active
$699,000
3
bds
|
3
ba
|
1,513
sqft
|
built
1924
33 Shannon St, Boston, MA 02135
$-2,201
Cash flow
-16.4%
Cash-on-Cash Return
2.5%
Cap rate
0.5%
Rent to Value Ratio
Active
$1,125,000
1
bds
|
1
ba
|
937
sqft
|
built
2020
100 Shawmut Ave, Boston, MA 02118
$-3,814
Cash flow
-17.7%
Cash-on-Cash Return
2.2%
Cap rate
0.5%
Rent to Value Ratio
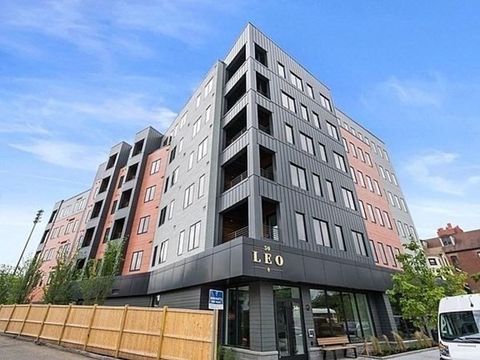
Active
$598,000
1
bds
|
1
ba
|
708
sqft
|
built
2022
50 Leo M Birmingham Pkwy, Boston, MA 02135
$-1,998
Cash flow
-17.4%
Cash-on-Cash Return
2.3%
Cap rate
0.5%
Rent to Value Ratio

Active
$5,500,000
5
bds
|
7
ba
|
5,300
sqft
|
built
2000
64 Walker St, Boston, MA 02129
$-25,688
Cash flow
-24.4%
Cash-on-Cash Return
0.7%
Cap rate
0.1%
Rent to Value Ratio
Active
$2,995,000
3
bds
|
3
ba
|
1,860
sqft
|
built
1930
113 Commonwealth Ave, Boston, MA 02116
$-12,861
Cash flow
-22.4%
Cash-on-Cash Return
1.1%
Cap rate
0.3%
Rent to Value Ratio
Active
$389,900
2
bds
|
1
ba
|
735
sqft
|
built
1960
1185 Adams St, Boston, MA 02124
$-1,018
Cash flow
-13.6%
Cash-on-Cash Return
3.1%
Cap rate
0.6%
Rent to Value Ratio
Active
$9,500,000
2
bds
|
3
ba
|
2,945
sqft
|
built
2015
1 Dalton St, Boston, MA 02115
$-60,692
Cash flow
-33.3%
Cash-on-Cash Return
-1.4%
Cap rate
0.1%
Rent to Value Ratio
Active
$1,895,000
2
bds
|
3
ba
|
1,557
sqft
|
built
2006
500 Atlantic Ave, Boston, MA 02210
$-8,312
Cash flow
-22.9%
Cash-on-Cash Return
1.0%
Cap rate
0.5%
Rent to Value Ratio
Active
$1,825,000
3
bds
|
2
ba
|
1,427
sqft
|
built
1900
312 Shawmut Ave, Boston, MA 02118
$-8,346
Cash flow
-23.9%
Cash-on-Cash Return
0.8%
Cap rate
0.2%
Rent to Value Ratio
Active
$5,395,000
3
bds
|
4
ba
|
3,303
sqft
|
built
2000
2 Avery St, Boston, MA 02111
$-31,775
Cash flow
-30.7%
Cash-on-Cash Return
-0.8%
Cap rate
0.2%
Rent to Value Ratio
Active
$649,500
2
bds
|
2
ba
|
1,100
sqft
|
built
2021
127 E Cottage St, Boston, MA 02125
$-1,868
Cash flow
-15.0%
Cash-on-Cash Return
2.8%
Cap rate
0.5%
Rent to Value Ratio
Active
$1,099,000
2
bds
|
2
ba
|
1,710
sqft
|
built
1899
96 South St, Boston, MA 02111
$-3,265
Cash flow
-15.5%
Cash-on-Cash Return
2.7%
Cap rate
0.5%
Rent to Value Ratio
Active
$6,800,000
3
bds
|
4
ba
|
2,974
sqft
|
built
1900
5 Joy St, Boston, MA 02108
$-36,076
Cash flow
-27.7%
Cash-on-Cash Return
-0.1%
Cap rate
0.1%
Rent to Value Ratio
Active
$679,000
4
bds
|
2
ba
|
1,456
sqft
|
built
1900
24 Fifield St, Boston, MA 02122
$-1,325
Cash flow
-10.2%
Cash-on-Cash Return
3.9%
Cap rate
0.6%
Rent to Value Ratio

Active
$1,795,000
3
bds
|
2
ba
|
1,522
sqft
|
built
1920
33 Concord St, Boston, MA 02129
$-7,000
Cash flow
-20.3%
Cash-on-Cash Return
1.6%
Cap rate
0.3%
Rent to Value Ratio
Active
$1,799,000
2
bds
|
3
ba
|
2,037
sqft
|
built
2017
469 E 4th St, Boston, MA 02127
$-5,296
Cash flow
-15.4%
Cash-on-Cash Return
2.7%
Cap rate
0.4%
Rent to Value Ratio
Active
$1,299,000
11
bds
|
3
ba
|
3,000
sqft
|
built
1890
75 Ruthven St, Boston, MA 02121
$-5,944
Cash flow
-23.9%
Cash-on-Cash Return
0.8%
Cap rate
0.2%
Rent to Value Ratio
Active
$624,900
3
bds
|
1
ba
|
1,338
sqft
|
built
1890
76-78 Tuttle St, Boston, MA 02125
$-2,086
Cash flow
-17.4%
Cash-on-Cash Return
2.3%
Cap rate
0.5%
Rent to Value Ratio

Active
$869,000
2
bds
|
2
ba
|
1,065
sqft
|
built
2004
1 Nassau St, Boston, MA 02111
$-4,027
Cash flow
-24.2%
Cash-on-Cash Return
0.7%
Cap rate
0.5%
Rent to Value Ratio
Active
$1,295,000
2
bds
|
2
ba
|
1,513
sqft
|
built
2015
405 W 1st St, Boston, MA 02127
$-4,319
Cash flow
-17.4%
Cash-on-Cash Return
2.3%
Cap rate
0.4%
Rent to Value Ratio
Active
$645,000
3
bds
|
1
ba
|
1,176
sqft
|
built
1905
149 Hollingsworth St, Boston, MA 02136
$-1,367
Cash flow
-11.1%
Cash-on-Cash Return
3.7%
Cap rate
0.6%
Rent to Value Ratio
Active
$3,995,000
4
bds
|
4
ba
|
2,716
sqft
|
built
1900
9 Milford St, Boston, MA 02118
$-18,287
Cash flow
-23.9%
Cash-on-Cash Return
0.8%
Cap rate
0.2%
Rent to Value Ratio
Active
$2,000,000
1
bds
|
1
ba
|
1,016
sqft
|
built
1900
128 Marlborough St, Boston, MA 02116
$-8,399
Cash flow
-21.9%
Cash-on-Cash Return
1.2%
Cap rate
0.3%
Rent to Value Ratio

Active
$1,175,000
4
bds
|
2
ba
|
1,649
sqft
|
built
1890
659 E 6th St, Boston, MA 02127
$-2,688
Cash flow
-11.9%
Cash-on-Cash Return
3.5%
Cap rate
0.5%
Rent to Value Ratio
Active
$1,339,000
2
bds
|
2
ba
|
1,178
sqft
|
built
1920
437 D St, Boston, MA 02210
$-3,650
Cash flow
-14.2%
Cash-on-Cash Return
3.0%
Cap rate
0.5%
Rent to Value Ratio

Active
$700,000
1
bds
|
1
ba
|
529
sqft
|
built
1900
240 Marlborough St, Boston, MA 02116
$-1,811
Cash flow
-13.5%
Cash-on-Cash Return
3.2%
Cap rate
0.5%
Rent to Value Ratio
Active
$710,000
1
bds
|
1
ba
|
609
sqft
|
built
1988
2 Clarendon St, Boston, MA 02116
$-2,740
Cash flow
-20.1%
Cash-on-Cash Return
1.6%
Cap rate
0.5%
Rent to Value Ratio
Active
$735,000
1
bds
|
1
ba
|
606
sqft
|
built
1928
282 Newbury St, Boston, MA 02116
$-2,451
Cash flow
-17.4%
Cash-on-Cash Return
2.3%
Cap rate
0.5%
Rent to Value Ratio

Active
$699,000
1
bds
|
1
ba
|
732
sqft
|
built
2020
50 Hichborn St, Boston, MA 02135
$-2,584
Cash flow
-19.3%
Cash-on-Cash Return
1.8%
Cap rate
0.4%
Rent to Value Ratio
Active
$1,159,000
3
bds
|
2
ba
|
2,325
sqft
|
built
1985
12 Eagle St, Boston, MA 02132
$-4,357
Cash flow
-19.6%
Cash-on-Cash Return
1.8%
Cap rate
0.3%
Rent to Value Ratio
Active
$929,000
3
bds
|
2
ba
|
1,580
sqft
|
built
1900
10 Windom St, Boston, MA 02134
$-2,142
Cash flow
-12.0%
Cash-on-Cash Return
3.5%
Cap rate
0.5%
Rent to Value Ratio
Active
$1,100,000
2
bds
|
2
ba
|
1,348
sqft
|
built
2020
20 W 5th St, Boston, MA 02127
$-3,047
Cash flow
-14.5%
Cash-on-Cash Return
2.9%
Cap rate
0.6%
Rent to Value Ratio
Active
$919,000
2
bds
|
2
ba
|
1,064
sqft
|
built
2004
1 Nassau St, Boston, MA 02111
$-4,116
Cash flow
-23.4%
Cash-on-Cash Return
0.9%
Cap rate
0.5%
Rent to Value Ratio
Active
$429,900
2
bds
|
1
ba
|
574
sqft
|
built
1910
166 Cottage St, Boston, MA 02128
$-799
Cash flow
-9.7%
Cash-on-Cash Return
4.0%
Cap rate
0.6%
Rent to Value Ratio

Active
$1,995,000
2
bds
|
2
ba
|
1,201
sqft
|
built
2018
133 Seaport Blvd, Boston, MA 02210
$-8,166
Cash flow
-21.4%
Cash-on-Cash Return
1.4%
Cap rate
0.4%
Rent to Value Ratio
Active
$679,500
2
bds
|
2
ba
|
1,100
sqft
|
built
2021
127 E Cottage St, Boston, MA 02125
$-2,024
Cash flow
-15.5%
Cash-on-Cash Return
2.7%
Cap rate
0.5%
Rent to Value Ratio

Active
$554,000
1
bds
|
1
ba
|
700
sqft
|
built
1899
202 K St, Boston, MA 02127
$-1,702
Cash flow
-16.0%
Cash-on-Cash Return
2.6%
Cap rate
0.5%
Rent to Value Ratio
Active
$510,000
1
bds
|
1
ba
|
620
sqft
|
built
1910
838 E Broadway, Boston, MA 02127
$-1,651
Cash flow
-16.9%
Cash-on-Cash Return
2.4%
Cap rate
0.5%
Rent to Value Ratio