Boston, MA Investment Properties for Sale
Browse homes for sale and investment properties in Boston, MA. Refine your search by price, property type, or more.
Best cash flowing properties in Boston, MA
Active
$499,000
0
bds
|
1
ba
|
327
sqft
|
built
1899
80 Revere St, Boston, MA 02114
$-1,012
Cash flow
-10.6%
Cash-on-Cash Return
3.2%
Cap rate
0.6%
Rent to Value Ratio

Active
$599,900
4
bds
|
1
ba
|
1,163
sqft
|
built
1947
110 Lanark Rd, Boston, MA 02135
$-1,424
Cash flow
-12.4%
Cash-on-Cash Return
2.8%
Cap rate
0.5%
Rent to Value Ratio
1,040 out of 1,650 properties for sale in Boston, MA
Limited Results Shown
Create a free account, or log in to reveal all property listings and enjoy the complete experience.

Active under contract
$1,195,000
1
bds
|
2
ba
|
1,080
sqft
|
built
2004
1 Charles St S, Boston, MA 02116
$-4,689
Cash flow
-20.5%
Cash-on-Cash Return
1.0%
Cap rate
0.4%
Rent to Value Ratio
Active
$1,249,990
1
bds
|
1
ba
|
646
sqft
|
built
2018
133 Seaport Blvd, Boston, MA 02210
$-4,314
Cash flow
-18.0%
Cash-on-Cash Return
1.5%
Cap rate
0.4%
Rent to Value Ratio
Active
$979,000
2
bds
|
1
ba
|
980
sqft
|
built
1920
74 Fenway, Boston, MA 02115
$-2,828
Cash flow
-15.1%
Cash-on-Cash Return
2.2%
Cap rate
0.5%
Rent to Value Ratio
Active
$3,700,000
14
bds
|
11
ba
|
6,509
sqft
|
built
1900
27 Dudley St, Boston, MA 02119
$-15,928
Cash flow
-22.5%
Cash-on-Cash Return
0.5%
Cap rate
0.1%
Rent to Value Ratio
Active
$1,375,000
3
bds
|
3
ba
|
3,017
sqft
|
built
1982
241 Perkins St, Boston, MA 02130
$-8,496
Cash flow
-32.2%
Cash-on-Cash Return
-1.7%
Cap rate
0.4%
Rent to Value Ratio
Active
$4,595,000
2
bds
|
3
ba
|
1,859
sqft
|
built
2015
22 Liberty Dr, Boston, MA 02210
$-23,187
Cash flow
-26.3%
Cash-on-Cash Return
-0.4%
Cap rate
0.2%
Rent to Value Ratio
Active
$795,000
2
bds
|
2
ba
|
1,162
sqft
|
built
2000
1306 Columbia Rd, Boston, MA 02127
$-2,514
Cash flow
-16.5%
Cash-on-Cash Return
1.9%
Cap rate
0.5%
Rent to Value Ratio
Active
$1,850,000
1
bds
|
2
ba
|
1,134
sqft
|
built
2009
400 Stuart St, Boston, MA 02116
$-6,676
Cash flow
-18.8%
Cash-on-Cash Return
1.3%
Cap rate
0.4%
Rent to Value Ratio

Active
$2,499,000
2
bds
|
3
ba
|
2,036
sqft
|
built
2000
1 Avery St, Boston, MA 02111
$-12,062
Cash flow
-25.2%
Cash-on-Cash Return
-0.1%
Cap rate
0.3%
Rent to Value Ratio
Active
$3,995,000
7
bds
|
4
ba
|
4,642
sqft
|
built
1880
30 Cumberland St, Boston, MA 02115
$-17,780
Cash flow
-23.2%
Cash-on-Cash Return
0.3%
Cap rate
0.2%
Rent to Value Ratio
Active
$1,565,000
2
bds
|
2
ba
|
1,291
sqft
|
built
2009
45 Province St, Boston, MA 02108
$-5,401
Cash flow
-18.0%
Cash-on-Cash Return
1.5%
Cap rate
0.4%
Rent to Value Ratio

Active
$3,450,000
3
bds
|
3
ba
|
2,653
sqft
|
built
2006
500 Atlantic Ave, Boston, MA 02210
$-17,647
Cash flow
-26.7%
Cash-on-Cash Return
-0.5%
Cap rate
0.3%
Rent to Value Ratio

Active
$7,890,000
5
bds
|
7
ba
|
4,151
sqft
|
built
1890
160 Mount Vernon St, Boston, MA 02108
$-35,050
Cash flow
-23.2%
Cash-on-Cash Return
0.3%
Cap rate
0.1%
Rent to Value Ratio
Active
$1,025,000
1
bds
|
1
ba
|
773
sqft
|
built
1900
294 Newbury St, Boston, MA 02115
$-3,540
Cash flow
-18.0%
Cash-on-Cash Return
1.5%
Cap rate
0.4%
Rent to Value Ratio
Active
$550,000
3
bds
|
1
ba
|
912
sqft
|
built
1910
710 Walk Hill St, Boston, MA 02126
$-1,435
Cash flow
-13.6%
Cash-on-Cash Return
2.5%
Cap rate
0.5%
Rent to Value Ratio
Active
$790,000
1
bds
|
1
ba
|
864
sqft
|
built
2006
80 Broad St, Boston, MA 02110
$-2,830
Cash flow
-18.7%
Cash-on-Cash Return
1.4%
Cap rate
0.4%
Rent to Value Ratio

Active
$1,495,000
2
bds
|
2
ba
|
1,240
sqft
|
built
1925
285 Columbus Ave, Boston, MA 02116
$-3,600
Cash flow
-12.6%
Cash-on-Cash Return
2.8%
Cap rate
0.5%
Rent to Value Ratio

Active
$725,000
1
bds
|
2
ba
|
1,014
sqft
|
built
2019
3531 Washington St, Boston, MA 02130
$-1,981
Cash flow
-14.3%
Cash-on-Cash Return
2.4%
Cap rate
0.5%
Rent to Value Ratio
Active
$1,695,000
2
bds
|
2
ba
|
1,290
sqft
|
built
1904
40 Isabella St, Boston, MA 02116
$-5,211
Cash flow
-16.0%
Cash-on-Cash Return
2.0%
Cap rate
0.4%
Rent to Value Ratio
Active
$849,000
1
bds
|
1
ba
|
693
sqft
|
built
2016
319 A St, Boston, MA 02210
$-3,149
Cash flow
-19.4%
Cash-on-Cash Return
1.2%
Cap rate
0.4%
Rent to Value Ratio
Active
$1,995,000
2
bds
|
3
ba
|
1,571
sqft
|
built
2018
40 Traveler St, Boston, MA 02118
$-5,866
Cash flow
-15.3%
Cash-on-Cash Return
2.2%
Cap rate
0.5%
Rent to Value Ratio
Active
$955,000
2
bds
|
2
ba
|
1,119
sqft
|
built
2015
215 Athens St, Boston, MA 02127
$-2,866
Cash flow
-15.7%
Cash-on-Cash Return
2.1%
Cap rate
0.4%
Rent to Value Ratio
Active
$848,000
2
bds
|
2
ba
|
1,201
sqft
|
built
2019
214 Market St, Boston, MA 02135
$-2,496
Cash flow
-15.4%
Cash-on-Cash Return
2.1%
Cap rate
0.5%
Rent to Value Ratio
Active
$599,900
4
bds
|
1
ba
|
1,163
sqft
|
built
1947
110 Lanark Rd, Boston, MA 02135
$-1,424
Cash flow
-12.4%
Cash-on-Cash Return
2.8%
Cap rate
0.5%
Rent to Value Ratio
Active
$1,350,000
9
bds
|
3
ba
|
3,306
sqft
|
built
1910
51 Alpha Rd, Boston, MA 02124
$-4,232
Cash flow
-16.4%
Cash-on-Cash Return
1.9%
Cap rate
0.3%
Rent to Value Ratio
Active
$3,975,000
3
bds
|
3
ba
|
2,096
sqft
|
built
2016
1 Franklin St, Boston, MA 02110
$-18,861
Cash flow
-24.8%
Cash-on-Cash Return
0.0%
Cap rate
0.2%
Rent to Value Ratio
Active
$1,199,000
2
bds
|
2
ba
|
1,800
sqft
|
built
1890
90 South St, Boston, MA 02111
$-3,122
Cash flow
-13.6%
Cash-on-Cash Return
2.6%
Cap rate
0.5%
Rent to Value Ratio

Active
$1,475,000
2
bds
|
2
ba
|
1,011
sqft
|
built
2008
285 Columbus Ave, Boston, MA 02116
$-4,417
Cash flow
-15.6%
Cash-on-Cash Return
2.1%
Cap rate
0.4%
Rent to Value Ratio

Active
$1,945,000
2
bds
|
2
ba
|
1,213
sqft
|
built
2009
400 Stuart St, Boston, MA 02116
$-6,802
Cash flow
-18.2%
Cash-on-Cash Return
1.5%
Cap rate
0.4%
Rent to Value Ratio
Active
$815,000
2
bds
|
1
ba
|
1,330
sqft
|
built
2002
877 Harrison Ave, Boston, MA 02118
$-1,779
Cash flow
-11.4%
Cash-on-Cash Return
3.1%
Cap rate
0.6%
Rent to Value Ratio
Active
$2,950,000
2
bds
|
2
ba
|
1,406
sqft
|
built
2019
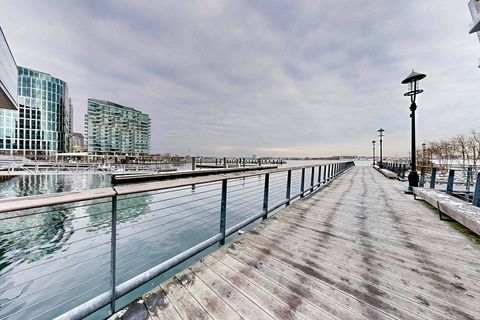
300 Pier 4 Blvd, Boston, MA 02210
$-11,752
Cash flow
-20.8%
Cash-on-Cash Return
0.9%
Cap rate
0.4%
Rent to Value Ratio
Active
$7,500,000
4
bds
|
5
ba
|
4,225
sqft
|
built
1850
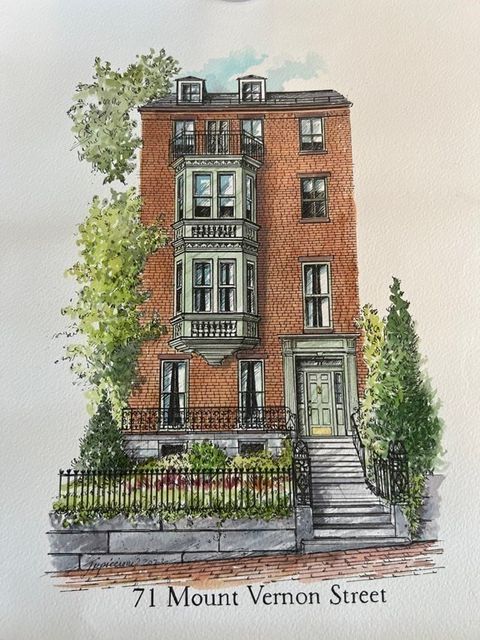
71 Mount Vernon St, Boston, MA 02108
$-31,102
Cash flow
-21.6%
Cash-on-Cash Return
0.7%
Cap rate
0.1%
Rent to Value Ratio

Active
$1,895,000
2
bds
|
2
ba
|
1,281
sqft
|
built
2016
1 Franklin St, Boston, MA 02110
$-6,795
Cash flow
-18.7%
Cash-on-Cash Return
1.4%
Cap rate
0.4%
Rent to Value Ratio
Active
$899,000
bds
|
1
ba
|
506
sqft
|
built
2020
135 Seaport Blvd, Boston, MA 02210
$-3,221
Cash flow
-18.7%
Cash-on-Cash Return
1.4%
Cap rate
0.5%
Rent to Value Ratio
Active
$499,000
0
bds
|
1
ba
|
327
sqft
|
built
1899
80 Revere St, Boston, MA 02114
$-1,012
Cash flow
-10.6%
Cash-on-Cash Return
3.2%
Cap rate
0.6%
Rent to Value Ratio
Active
$12,900,000
5
bds
|
8
ba
|
7,777
sqft
|
built
1870
57 Hancock St, Boston, MA 02114
$-59,362
Cash flow
-24.0%
Cash-on-Cash Return
0.2%
Cap rate
0.1%
Rent to Value Ratio
Active
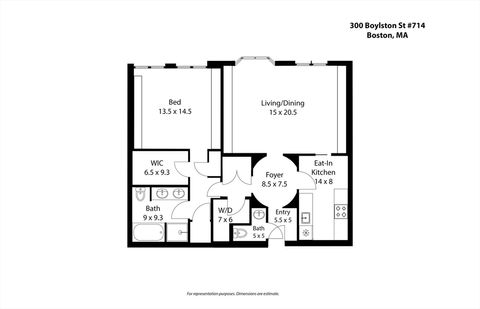
$1,795,000
1
bds
|
2
ba
|
1,142
sqft
|
built
1988
300 Boylston St, Boston, MA 02116
$-7,409
Cash flow
-21.5%
Cash-on-Cash Return
0.7%
Cap rate
0.4%
Rent to Value Ratio

Active
$1,594,999
3
bds
|
1
ba
|
828
sqft
|
built
1920
452 Park Dr, Boston, MA 02215
$-5,495
Cash flow
-18.0%
Cash-on-Cash Return
1.5%
Cap rate
0.2%
Rent to Value Ratio
Active
$5,499,000
6
bds
|
5
ba
|
4,554
sqft
|
built
1871
18 Hereford St, Boston, MA 02115
$-22,555
Cash flow
-21.4%
Cash-on-Cash Return
0.8%
Cap rate
0.2%
Rent to Value Ratio
Active
$1,550,000
11
bds
|
3
ba
|
4,389
sqft
|
built
1890
9 Harvard Ave, Boston, MA 02121
$-6,053
Cash flow
-20.4%
Cash-on-Cash Return
1.0%
Cap rate
0.2%
Rent to Value Ratio