Boston, MA Investment Properties for Sale
Browse homes for sale and investment properties in Boston, MA. Refine your search by price, property type, or more.
Best cash flowing properties in Boston, MA

Active
$375,000
2
bds
|
1
ba
|
660
sqft
|
built
1920
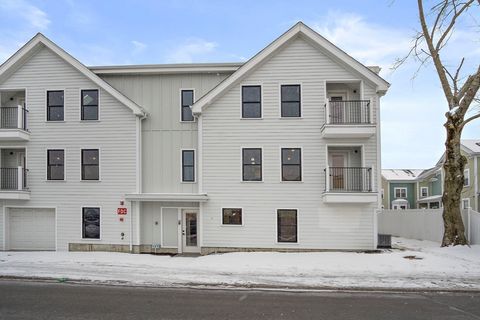
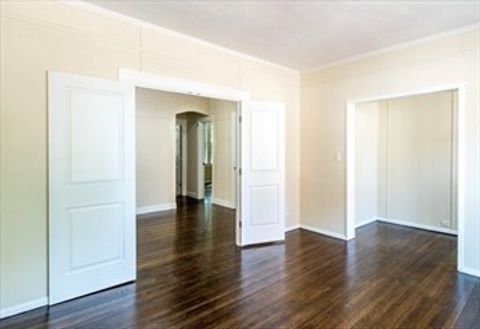
57 Brighton Ave, Boston, MA 02134
$-855
Cash flow
-11.9%
Cash-on-Cash Return
3.5%
Cap rate
0.7%
Rent to Value Ratio

Active
$375,000
2
bds
|
1
ba
|
635
sqft
|
built
1920
57 Brighton Ave, Boston, MA 02134
$-861
Cash flow
-12.0%
Cash-on-Cash Return
3.5%
Cap rate
0.7%
Rent to Value Ratio
941 out of 1,796 properties for sale in Boston, MA
Limited Results Shown
Create a free account, or log in to reveal all property listings and enjoy the complete experience.
Active
$3,475,000
2
bds
|
3
ba
|
2,350
sqft
|
built
1987
20 Rowes Wharf, Boston, MA 02110
$-18,707
Cash flow
-28.1%
Cash-on-Cash Return
-0.2%
Cap rate
0.3%
Rent to Value Ratio

Active
$1,895,000
2
bds
|
2
ba
|
1,068
sqft
|
built
2019
133 Seaport Blvd, Boston, MA 02210
$-8,466
Cash flow
-23.3%
Cash-on-Cash Return
0.9%
Cap rate
0.3%
Rent to Value Ratio

Active
$525,000
1
bds
|
1
ba
|
807
sqft
|
built
2020
11 Walley St, Boston, MA 02128
$-1,793
Cash flow
-17.8%
Cash-on-Cash Return
2.2%
Cap rate
0.5%
Rent to Value Ratio

Active
$2,675,000
2
bds
|
3
ba
|
2,242
sqft
|
built
2000
1 Avery St, Boston, MA 02111
$-13,544
Cash flow
-26.4%
Cash-on-Cash Return
0.2%
Cap rate
0.4%
Rent to Value Ratio

Active
$5,049,900
2
bds
|
3
ba
|
1,859
sqft
|
built
2015
22 Liberty Pl, Boston, MA 02127
$-27,785
Cash flow
-28.7%
Cash-on-Cash Return
-0.3%
Cap rate
0.2%
Rent to Value Ratio

Active
$1,649,000
2
bds
|
2
ba
|
1,420
sqft
|
built
2013
580 Washington St, Boston, MA 02111
$-5,915
Cash flow
-18.7%
Cash-on-Cash Return
2.0%
Cap rate
0.5%
Rent to Value Ratio

Active
$1,995,000
3
bds
|
2
ba
|
1,844
sqft
|
built
2017
32 Derne St, Boston, MA 02114
$-6,795
Cash flow
-17.8%
Cash-on-Cash Return
2.2%
Cap rate
0.6%
Rent to Value Ratio

Active
$675,000
1
bds
|
1
ba
|
516
sqft
|
built
1880
388 Marlborough St, Boston, MA 02115
$-2,537
Cash flow
-19.6%
Cash-on-Cash Return
1.8%
Cap rate
0.4%
Rent to Value Ratio

Active
$3,495,000
2
bds
|
3
ba
|
2,077
sqft
|
built
1988
300 Boylston St, Boston, MA 02116
$-16,913
Cash flow
-25.2%
Cash-on-Cash Return
0.5%
Cap rate
0.3%
Rent to Value Ratio

Active
$549,000
2
bds
|
2
ba
|
1,059
sqft
|
built
1890
496 E 7th St, Boston, MA 02127
$-1,343
Cash flow
-12.8%
Cash-on-Cash Return
3.3%
Cap rate
0.6%
Rent to Value Ratio
Active
$719,000
1
bds
|
1
ba
|
502
sqft
|
built
1900
15 River St, Boston, MA 02108
$-3,140
Cash flow
-22.8%
Cash-on-Cash Return
1.0%
Cap rate
0.4%
Rent to Value Ratio

Active
$1,925,000
1
bds
|
2
ba
|
1,128
sqft
|
built
2022
150 Seaport Blvd, Boston, MA 02210
$-8,267
Cash flow
-22.4%
Cash-on-Cash Return
1.1%
Cap rate
0.5%
Rent to Value Ratio

Active
$899,000
4
bds
|
4
ba
|
2,648
sqft
|
built
2005
2856 Washington St, Boston, MA 02119
$-2,631
Cash flow
-15.3%
Cash-on-Cash Return
2.8%
Cap rate
0.5%
Rent to Value Ratio

Active
$8,900,000
4
bds
|
4
ba
|
3,771
sqft
|
built
1860
36 Commonwealth Ave, Boston, MA 02116
$-49,451
Cash flow
-29.0%
Cash-on-Cash Return
-0.4%
Cap rate
0.1%
Rent to Value Ratio
Active
$2,399,000
4
bds
|
4
ba
|
2,745
sqft
|
built
2019
56 Belmont St, Boston, MA 02129
$-8,429
Cash flow
-18.3%
Cash-on-Cash Return
2.0%
Cap rate
0.4%
Rent to Value Ratio
Active
$369,000
2
bds
|
1
ba
|
730
sqft
|
built
1946
461 Arborway, Boston, MA 02130
$-1,019
Cash flow
-14.4%
Cash-on-Cash Return
2.9%
Cap rate
0.7%
Rent to Value Ratio

Active
$2,000,000
1
bds
|
2
ba
|
1,104
sqft
|
built
2022
150 Seaport Blvd, Boston, MA 02210
$-7,990
Cash flow
-20.8%
Cash-on-Cash Return
1.5%
Cap rate
0.4%
Rent to Value Ratio
Active
$1,689,900
2
bds
|
2
ba
|
1,250
sqft
|
built
1910
8 Garrison St, Boston, MA 02116
$-4,681
Cash flow
-14.5%
Cash-on-Cash Return
2.9%
Cap rate
0.5%
Rent to Value Ratio
Active
$3,195,000
3
bds
|
4
ba
|
2,957
sqft
|
built
2015
23 Piedmont St, Boston, MA 02116
$-13,847
Cash flow
-22.6%
Cash-on-Cash Return
1.1%
Cap rate
0.3%
Rent to Value Ratio

Active
$7,250,000
5
bds
|
4
ba
|
5,165
sqft
|
built
1869
381 Beacon St, Boston, MA 02116
$-36,666
Cash flow
-26.4%
Cash-on-Cash Return
0.2%
Cap rate
0.2%
Rent to Value Ratio
Active
$2,149,000
2
bds
|
2
ba
|
1,164
sqft
|
built
2020
135 Seaport Blvd, Boston, MA 02210
$-8,427
Cash flow
-20.5%
Cash-on-Cash Return
1.6%
Cap rate
0.5%
Rent to Value Ratio
Active
$849,000
6
bds
|
2
ba
|
2,308
sqft
|
built
1955
25 Crandall St, Boston, MA 02131
$-2,825
Cash flow
-17.4%
Cash-on-Cash Return
2.3%
Cap rate
0.4%
Rent to Value Ratio

Active
$1,000,000
1
bds
|
2
ba
|
1,280
sqft
|
built
1868
28 Atlantic Ave, Boston, MA 02110
$-4,347
Cash flow
-22.7%
Cash-on-Cash Return
1.0%
Cap rate
0.5%
Rent to Value Ratio
Active
$375,000
2
bds
|
1
ba
|
660
sqft
|
built
1920
57 Brighton Ave, Boston, MA 02134
$-855
Cash flow
-11.9%
Cash-on-Cash Return
3.5%
Cap rate
0.7%
Rent to Value Ratio
Active
$2,299,000
2
bds
|
3
ba
|
1,285
sqft
|
built
2018
133 Seaport Blvd, Boston, MA 02210
$-9,893
Cash flow
-22.5%
Cash-on-Cash Return
1.1%
Cap rate
0.4%
Rent to Value Ratio
Active
$375,000
2
bds
|
1
ba
|
635
sqft
|
built
1920
57 Brighton Ave, Boston, MA 02134
$-861
Cash flow
-12.0%
Cash-on-Cash Return
3.5%
Cap rate
0.7%
Rent to Value Ratio
Active
$2,090,000
2
bds
|
2
ba
|
1,447
sqft
|
built
2019
100 Shawmut Ave, Boston, MA 02118
$-9,222
Cash flow
-23.0%
Cash-on-Cash Return
1.0%
Cap rate
0.4%
Rent to Value Ratio
Active
$1,899,999
1
bds
|
2
ba
|
1,035
sqft
|
built
2015
22 Liberty Pl, Boston, MA 02127
$-6,404
Cash flow
-17.6%
Cash-on-Cash Return
2.2%
Cap rate
0.4%
Rent to Value Ratio
Active
$19,995,000
7
bds
|
8
ba
|
9,924
sqft
|
built
1870
4 Gloucester St, Boston, MA 02115
$-103,089
Cash flow
-26.9%
Cash-on-Cash Return
0.1%
Cap rate
0.1%
Rent to Value Ratio
Active
$2,195,000
2
bds
|
3
ba
|
1,637
sqft
|
built
2016
1 Franklin St, Boston, MA 02110
$-9,091
Cash flow
-21.6%
Cash-on-Cash Return
1.3%
Cap rate
0.5%
Rent to Value Ratio
Active
$1,199,000
2
bds
|
2
ba
|
1,082
sqft
|
built
2018
65 Lewis St, Boston, MA 02128
$-3,573
Cash flow
-15.5%
Cash-on-Cash Return
2.7%
Cap rate
0.5%
Rent to Value Ratio

Active
$5,395,000
2
bds
|
3
ba
|
2,341
sqft
|
built
1987
10 Rowes Wharf, Boston, MA 02110
$-31,218
Cash flow
-30.2%
Cash-on-Cash Return
-0.7%
Cap rate
0.2%
Rent to Value Ratio
Active
$499,000
2
bds
|
2
ba
|
1,066
sqft
|
built
2022
1214 Vfw Pkwy, Boston, MA 02132
$-1,468
Cash flow
-15.3%
Cash-on-Cash Return
2.7%
Cap rate
0.6%
Rent to Value Ratio
Active
$654,500
2
bds
|
2
ba
|
1,045
sqft
|
built
2021
127 E Cottage St, Boston, MA 02125
$-1,930
Cash flow
-15.4%
Cash-on-Cash Return
2.7%
Cap rate
0.5%
Rent to Value Ratio

Active
$663,000
3
bds
|
2
ba
|
1,201
sqft
|
built
1945
37 Halliday St, Boston, MA 02131
$-1,306
Cash flow
-10.3%
Cash-on-Cash Return
3.9%
Cap rate
0.6%
Rent to Value Ratio

Active
$9,350,000
5
bds
|
6
ba
|
6,082
sqft
|
built
1899
9 Walnut St, Boston, MA 02108
$-48,296
Cash flow
-26.9%
Cash-on-Cash Return
0.1%
Cap rate
0.1%
Rent to Value Ratio

Active
$11,900,000
4
bds
|
7
ba
|
4,788
sqft
|
built
1868
126 Marlborough St, Boston, MA 02116
$-59,529
Cash flow
-26.1%
Cash-on-Cash Return
0.3%
Cap rate
0.1%
Rent to Value Ratio
Active
$799,000
3
bds
|
1
ba
|
2,049
sqft
|
built
1890
42 Deckard St, Boston, MA 02121
$-2,846
Cash flow
-18.6%
Cash-on-Cash Return
2.0%
Cap rate
0.4%
Rent to Value Ratio
Active
$1,645,000
2
bds
|
2
ba
|
1,161
sqft
|
built
2016
1 Franklin St, Boston, MA 02110
$-5,657
Cash flow
-17.9%
Cash-on-Cash Return
2.1%
Cap rate
0.5%
Rent to Value Ratio

Active
$1,798,999
8
bds
|
3
ba
|
2,997
sqft
|
built
1905
8 Porter St, Boston, MA 02130
$-7,996
Cash flow
-23.2%
Cash-on-Cash Return
0.9%
Cap rate
0.2%
Rent to Value Ratio