Brandon, FL Investment Properties for Sale
Browse homes for sale and investment properties in Brandon, FL. Refine your search by price, property type, or more.
Best cash flowing properties in Brandon, FL
Active
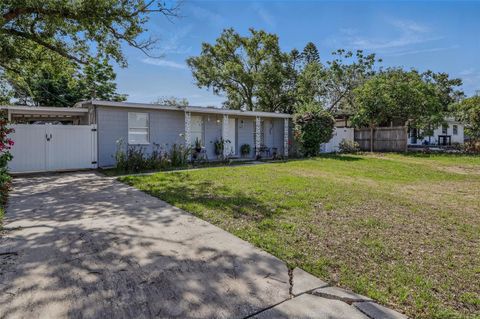
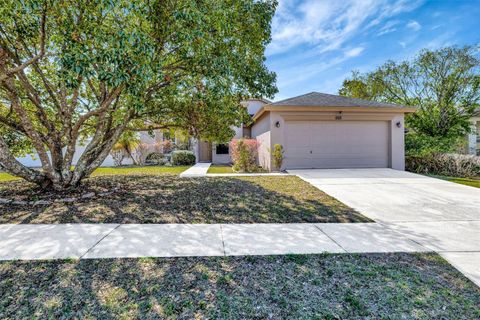
$152,000
2
bds
|
2
ba
|
1,068
sqft
|
built
1981
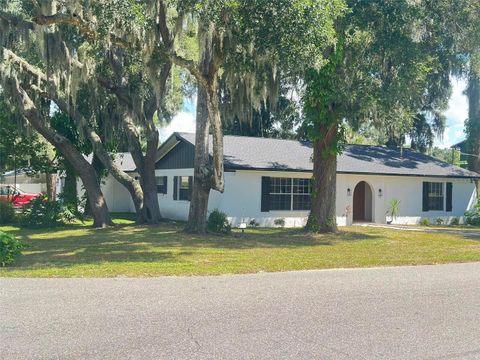
107 Caldwell Dr, Brandon, FL 33510
$182
Cash flow
6.2%
Cash-on-Cash Return
7.6%
Cap rate
1.1%
Rent to Value Ratio
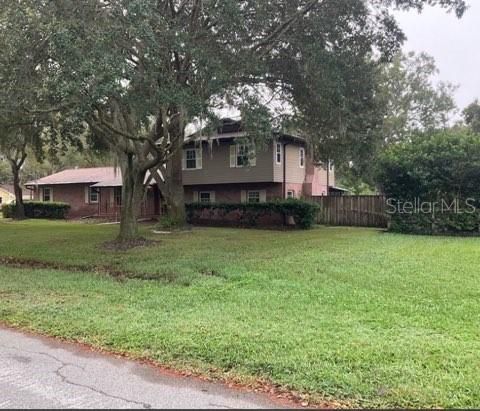
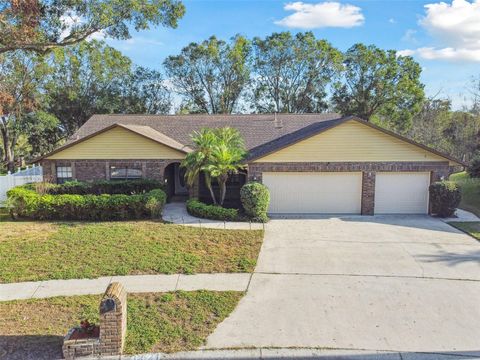
Active
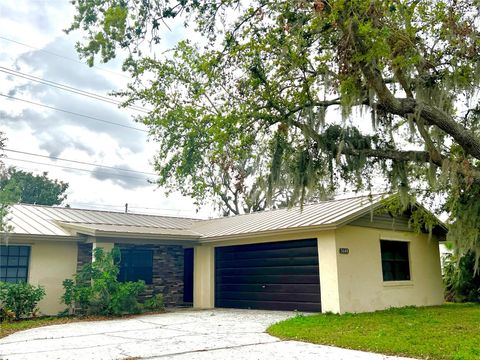
$459,900
4
bds
|
2
ba
|
2,366
sqft
|
built
1995
1515 Lions Club Dr, Brandon, FL 33511
$-241
Cash flow
-2.7%
Cash-on-Cash Return
5.5%
Cap rate
0.7%
Rent to Value Ratio
160 out of 169 properties for sale in Brandon, FL
Limited Results Shown
Create a free account, or log in to reveal all property listings and enjoy the complete experience.
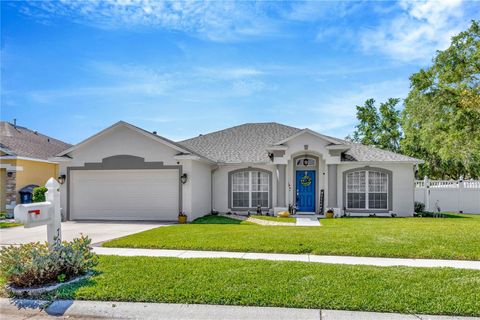
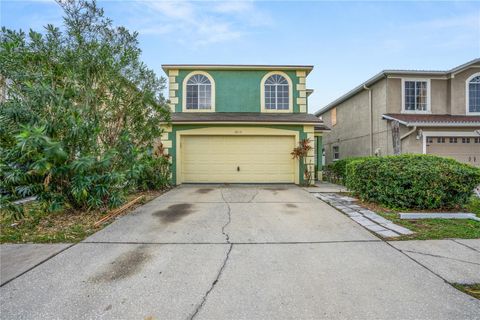
Active
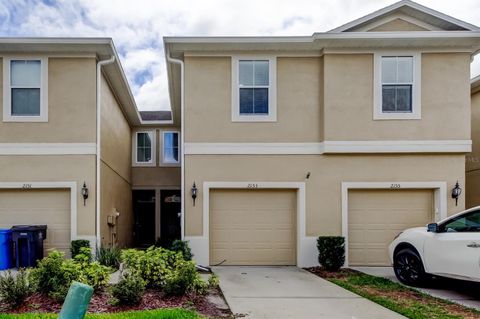
$510,000
4
bds
|
4
ba
|
1,735
sqft
|
built
1978
500 Hillpine Way, Brandon, FL 33510
$-1,020
Cash flow
-10.4%
Cash-on-Cash Return
3.7%
Cap rate
0.5%
Rent to Value Ratio
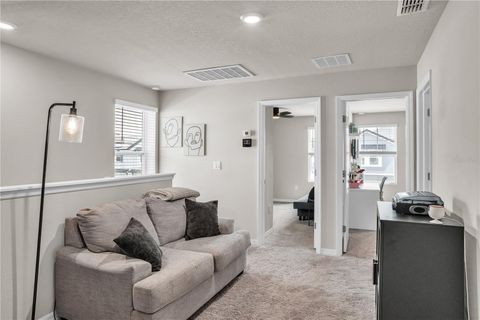
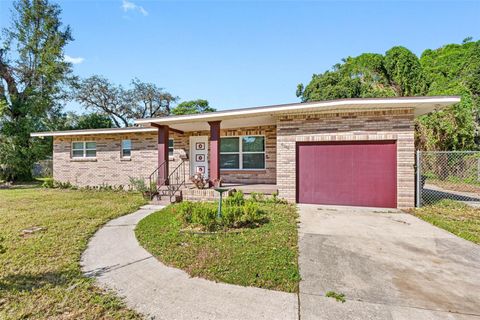
Active
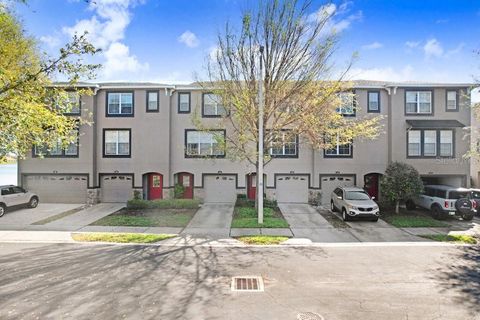
$284,900
3
bds
|
3
ba
|
1,536
sqft
|
built
2016
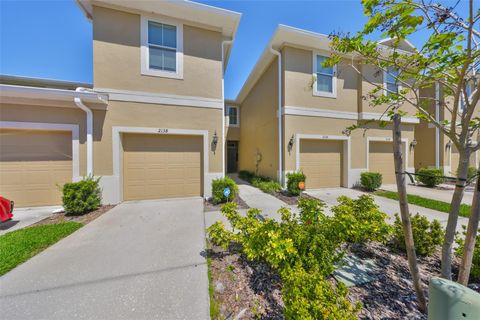
2138 Broadway View Ave, Brandon, FL 33510
$-683
Cash flow
-12.5%
Cash-on-Cash Return
3.3%
Cap rate
0.7%
Rent to Value Ratio
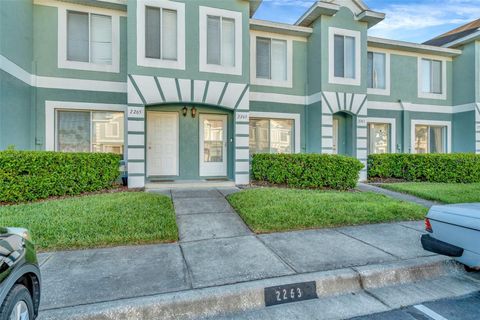
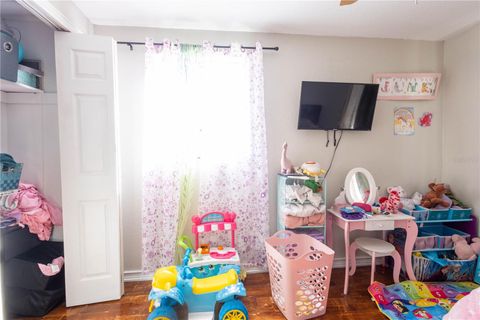
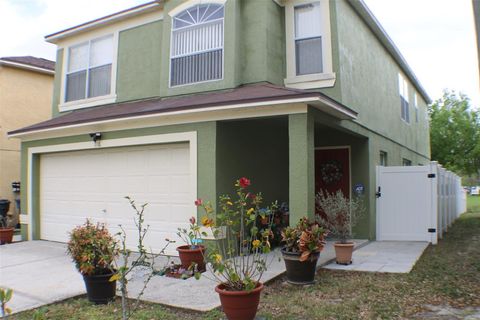
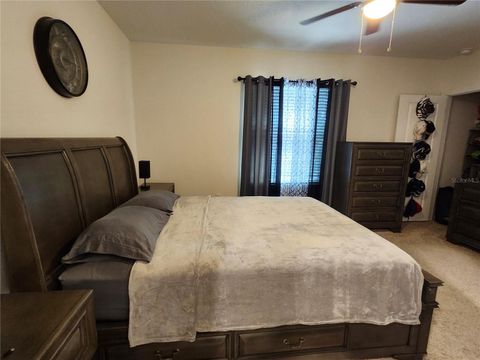
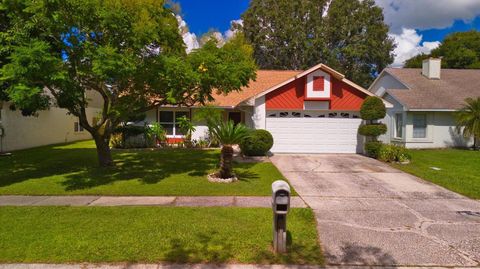
Active
$229,000
2
bds
|
3
ba
|
1,490
sqft
|
built
2002
2263 Fluorshire Dr, Brandon, FL 33511
$-449
Cash flow
-10.2%
Cash-on-Cash Return
3.8%
Cap rate
0.8%
Rent to Value Ratio
Active
$384,900
4
bds
|
2
ba
|
1,700
sqft
|
built
1972
724 Tradewinds Dr, Brandon, FL 33511
$-590
Cash flow
-8.0%
Cash-on-Cash Return
4.3%
Cap rate
0.6%
Rent to Value Ratio

Active
$525,000
4
bds
|
3
ba
|
2,716
sqft
|
built
1983
3952 Applegate Cir, Brandon, FL 33511
$-983
Cash flow
-9.8%
Cash-on-Cash Return
3.9%
Cap rate
0.5%
Rent to Value Ratio
Active
$389,000
4
bds
|
3
ba
|
2,113
sqft
|
built
1999
716 Burlwood St, Brandon, FL 33511
$-383
Cash flow
-5.1%
Cash-on-Cash Return
5.0%
Cap rate
0.7%
Rent to Value Ratio
Active
$325,000
3
bds
|
3
ba
|
1,707
sqft
|
built
2020
3267 Pleasant Willow Ct, Brandon, FL 33511
$-582
Cash flow
-9.3%
Cash-on-Cash Return
4.0%
Cap rate
0.7%
Rent to Value Ratio
Active
$330,000
3
bds
|
2
ba
|
1,152
sqft
|
built
1962
1211 E Camellia Dr, Brandon, FL 33510
$-587
Cash flow
-9.3%
Cash-on-Cash Return
4.0%
Cap rate
0.6%
Rent to Value Ratio
Active
$626,999
4
bds
|
3
ba
|
2,044
sqft
|
built
1978
411 El Greco Dr, Brandon, FL 33511
$-1,260
Cash flow
-10.5%
Cash-on-Cash Return
3.7%
Cap rate
0.6%
Rent to Value Ratio
Active
$454,900
4
bds
|
2
ba
|
2,152
sqft
|
built
2002
703 June Lake Ln, Brandon, FL 33510
$-727
Cash flow
-8.3%
Cash-on-Cash Return
4.2%
Cap rate
0.6%
Rent to Value Ratio
Active
$304,900
3
bds
|
3
ba
|
1,525
sqft
|
built
2022
2718 Chestnut Creek Pl, Brandon, FL 33510
$-549
Cash flow
-9.4%
Cash-on-Cash Return
4.0%
Cap rate
0.8%
Rent to Value Ratio
Active
$357,000
3
bds
|
2
ba
|
1,457
sqft
|
built
1996
669 Lakemont Dr, Brandon, FL 33510
$-621
Cash flow
-9.1%
Cash-on-Cash Return
4.1%
Cap rate
0.6%
Rent to Value Ratio
Active
$411,000
4
bds
|
2
ba
|
1,500
sqft
|
built
1979
3608 Oak Bark Ln, Brandon, FL 33511
$-977
Cash flow
-12.4%
Cash-on-Cash Return
3.3%
Cap rate
0.5%
Rent to Value Ratio
Active
$300,000
3
bds
|
3
ba
|
1,536
sqft
|
built
2017
2153 Broadway View Ave, Brandon, FL 33510
$-560
Cash flow
-9.7%
Cash-on-Cash Return
3.9%
Cap rate
0.7%
Rent to Value Ratio
Active
$308,500
3
bds
|
4
ba
|
1,917
sqft
|
built
2006
1208 Chatham Pine Pl, Brandon, FL 33511
$-288
Cash flow
-4.9%
Cash-on-Cash Return
5.0%
Cap rate
0.7%
Rent to Value Ratio
Active
$489,900
4
bds
|
3
ba
|
2,203
sqft
|
built
1999
3017 Minuteman Ln, Brandon, FL 33511
$-1,079
Cash flow
-11.5%
Cash-on-Cash Return
3.5%
Cap rate
0.6%
Rent to Value Ratio

Active
$369,999
3
bds
|
2
ba
|
1,307
sqft
|
built
1990
1728 Elk Spring Dr, Brandon, FL 33511
$-608
Cash flow
-8.6%
Cash-on-Cash Return
4.2%
Cap rate
0.7%
Rent to Value Ratio
Active
$475,000
4
bds
|
2
ba
|
1,610
sqft
|
built
1964
3908 Alafia Blvd, Brandon, FL 33511
$-971
Cash flow
-10.7%
Cash-on-Cash Return
3.7%
Cap rate
0.6%
Rent to Value Ratio
Active
$275,000
3
bds
|
3
ba
|
1,684
sqft
|
built
2004
2824 Conch Hollow Dr, Brandon, FL 33511
$-505
Cash flow
-9.6%
Cash-on-Cash Return
3.9%
Cap rate
0.8%
Rent to Value Ratio
Active
$339,999
3
bds
|
3
ba
|
1,525
sqft
|
built
2022
2710 Chestnut Creek Pl, Brandon, FL 33510
$-581
Cash flow
-8.9%
Cash-on-Cash Return
4.1%
Cap rate
0.7%
Rent to Value Ratio
Active
$449,900
4
bds
|
3
ba
|
2,270
sqft
|
built
2007
3510 Brook Crossing Dr, Brandon, FL 33511
$-831
Cash flow
-9.6%
Cash-on-Cash Return
3.9%
Cap rate
0.6%
Rent to Value Ratio

Active
$499,000
5
bds
|
3
ba
|
2,605
sqft
|
built
2021
2604 Knight Island Dr, Brandon, FL 33511
$-969
Cash flow
-10.1%
Cash-on-Cash Return
3.8%
Cap rate
0.6%
Rent to Value Ratio

Active
$294,999
3
bds
|
3
ba
|
1,525
sqft
|
built
2022
2764 Emory Sound Pl, Brandon, FL 33510
$-543
Cash flow
-9.6%
Cash-on-Cash Return
3.9%
Cap rate
0.8%
Rent to Value Ratio
Active
$475,000
4
bds
|
3
ba
|
2,950
sqft
|
built
1999
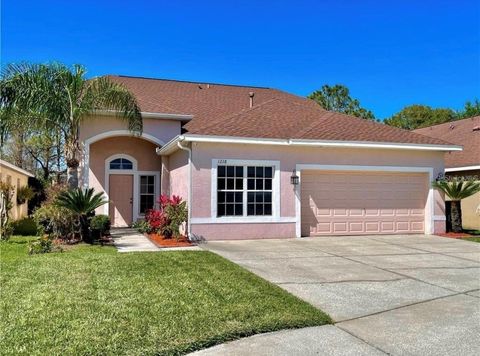
1218 Vinetree Dr, Brandon, FL 33510
$-549
Cash flow
-6.0%
Cash-on-Cash Return
4.8%
Cap rate
0.7%
Rent to Value Ratio
Active
$364,900
3
bds
|
2
ba
|
1,624
sqft
|
built
2000
1652 Open Field Loop, Brandon, FL 33510
$-570
Cash flow
-8.1%
Cash-on-Cash Return
4.3%
Cap rate
0.7%
Rent to Value Ratio
Active
$320,000
3
bds
|
3
ba
|
1,785
sqft
|
built
2022
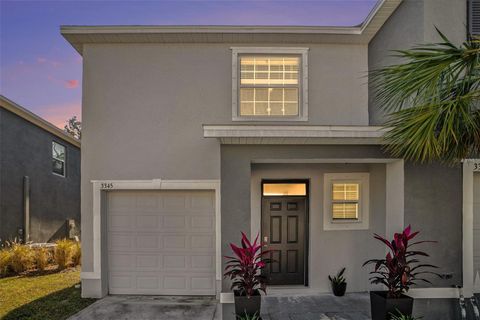
3345 Pleasant Willow Ct, Brandon, FL 33511
$-704
Cash flow
-11.5%
Cash-on-Cash Return
3.5%
Cap rate
0.7%
Rent to Value Ratio
Active
$450,000
4
bds
|
2
ba
|
2,200
sqft
|
built
1993
1121 Belladonna Dr, Brandon, FL 33510
$-716
Cash flow
-8.3%
Cash-on-Cash Return
4.2%
Cap rate
0.6%
Rent to Value Ratio
Active
$359,000
4
bds
|
3
ba
|
1,899
sqft
|
built
1996
1613 Prowmore Dr, Brandon, FL 33511
$-335
Cash flow
-4.9%
Cash-on-Cash Return
5.1%
Cap rate
0.7%
Rent to Value Ratio
Active
$415,000
3
bds
|
2
ba
|
1,677
sqft
|
built
1958
404 E Morgan St, Brandon, FL 33510
$-659
Cash flow
-8.3%
Cash-on-Cash Return
4.2%
Cap rate
0.7%
Rent to Value Ratio
Active
$392,999
3
bds
|
2
ba
|
1,516
sqft
|
built
1986
2011 Green Juniper Ln, Brandon, FL 33511
$-487
Cash flow
-6.5%
Cash-on-Cash Return
4.7%
Cap rate
0.6%
Rent to Value Ratio
Active
$349,900
3
bds
|
2
ba
|
1,572
sqft
|
built
1999
1122 Vinetree Dr, Brandon, FL 33510
$-454
Cash flow
-6.8%
Cash-on-Cash Return
4.6%
Cap rate
0.7%
Rent to Value Ratio
Active
$449,900
4
bds
|
3
ba
|
2,125
sqft
|
built
1976
701 S Oakwood Ave, Brandon, FL 33511
$-596
Cash flow
-6.9%
Cash-on-Cash Return
4.6%
Cap rate
0.7%
Rent to Value Ratio

Active
$725,000
4
bds
|
3
ba
|
1,902
sqft
|
built
1956
4617 John Moore Rd, Brandon, FL 33511
$-1,473
Cash flow
-10.6%
Cash-on-Cash Return
3.7%
Cap rate
0.6%
Rent to Value Ratio
Active
$200,000
2
bds
|
2
ba
|
1,068
sqft
|
built
1981
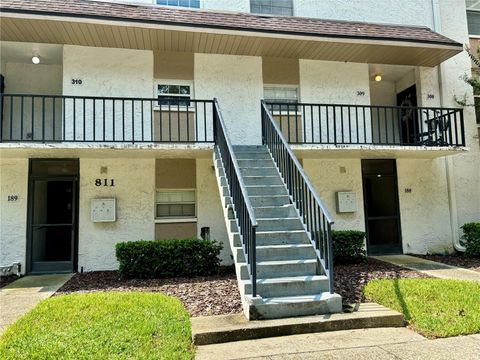
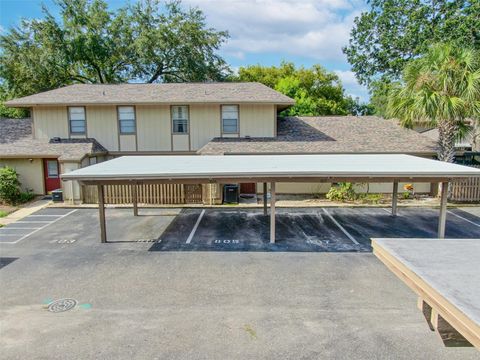
811 Russell Ln, Brandon, FL 33510
$-279
Cash flow
-7.3%
Cash-on-Cash Return
4.5%
Cap rate
0.9%
Rent to Value Ratio

Active
$329,900
3
bds
|
3
ba
|
1,525
sqft
|
built
2022
2714 Chestnut Creek Pl, Brandon, FL 33510
$-538
Cash flow
-8.5%
Cash-on-Cash Return
4.2%
Cap rate
0.8%
Rent to Value Ratio
Active
$215,000
3
bds
|
2
ba
|
1,256
sqft
|
built
1975
807 Hunters Ct, Brandon, FL 33511
$-373
Cash flow
-9.1%
Cash-on-Cash Return
4.1%
Cap rate
0.8%
Rent to Value Ratio
Active
$564,900
4
bds
|
4
ba
|
2,688
sqft
|
built
2001
805 Woodcarver Ln, Brandon, FL 33510
$-1,291
Cash flow
-11.9%
Cash-on-Cash Return
3.4%
Cap rate
0.6%
Rent to Value Ratio
Active
$539,000
2
bds
|
1
ba
|
1,092
sqft
|
built
1961
411 Bryan Rd, Brandon, FL 33511
$-1,116
Cash flow
-10.8%
Cash-on-Cash Return
3.7%
Cap rate
0.5%
Rent to Value Ratio