Brandon, FL Investment Properties for Sale
Browse homes for sale and investment properties in Brandon, FL. Refine your search by price, property type, or more.
Best cash flowing properties in Brandon, FL
Active
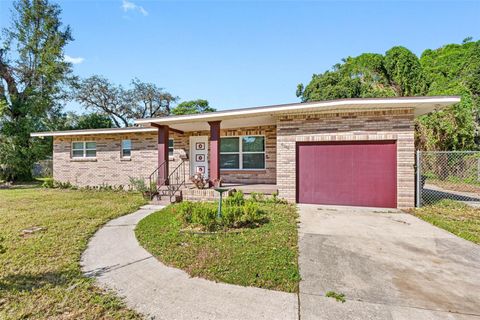
$152,000
2
bds
|
2
ba
|
1,068
sqft
|
built
1981
107 Caldwell Dr, Brandon, FL 33510
$182
Cash flow
6.2%
Cash-on-Cash Return
7.6%
Cap rate
1.1%
Rent to Value Ratio
Active
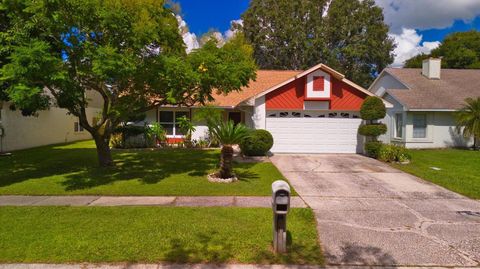
$459,900
4
bds
|
2
ba
|
2,366
sqft
|
built
1995
1515 Lions Club Dr, Brandon, FL 33511
$-241
Cash flow
-2.7%
Cash-on-Cash Return
5.5%
Cap rate
0.7%
Rent to Value Ratio
202 out of 213 properties for sale in Brandon, FL
Limited Results Shown
Create a free account, or log in to reveal all property listings and enjoy the complete experience.
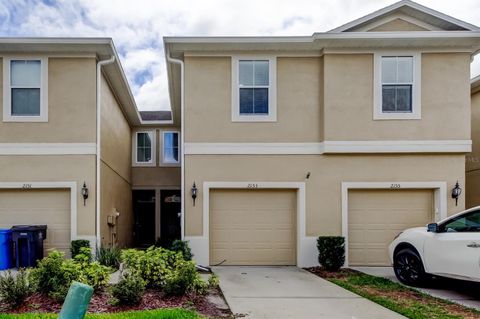
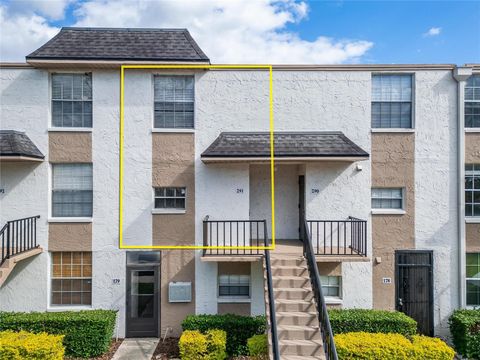
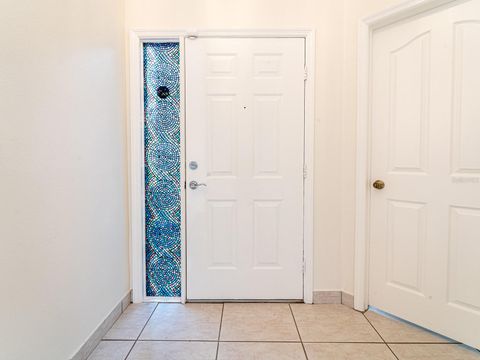
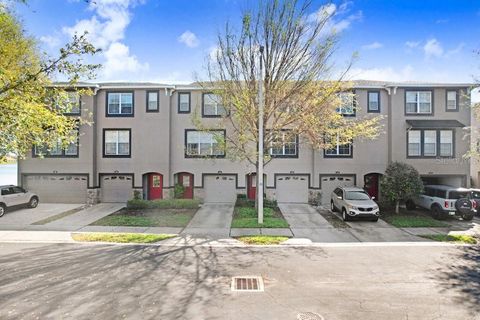
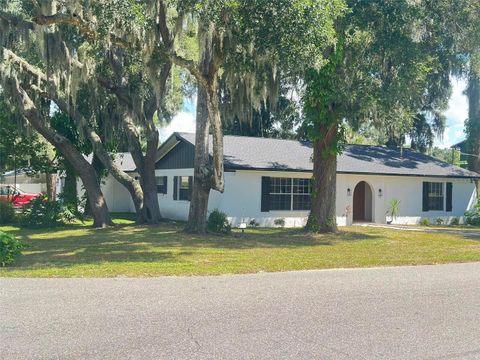
Active
$300,000
3
bds
|
3
ba
|
1,536
sqft
|
built
2017
2153 Broadway View Ave, Brandon, FL 33510
$-560
Cash flow
-9.7%
Cash-on-Cash Return
3.9%
Cap rate
0.7%
Rent to Value Ratio
Active
$308,500
3
bds
|
4
ba
|
1,917
sqft
|
built
2006
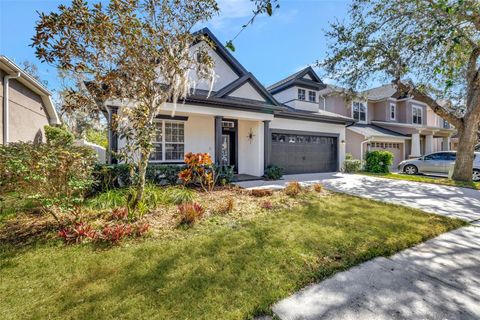
1208 Chatham Pine Pl, Brandon, FL 33511
$-288
Cash flow
-4.9%
Cash-on-Cash Return
5.0%
Cap rate
0.7%
Rent to Value Ratio
Active
$489,900
4
bds
|
3
ba
|
2,203
sqft
|
built
1999
3017 Minuteman Ln, Brandon, FL 33511
$-1,079
Cash flow
-11.5%
Cash-on-Cash Return
3.5%
Cap rate
0.6%
Rent to Value Ratio

Active
$369,999
3
bds
|
2
ba
|
1,307
sqft
|
built
1990
1728 Elk Spring Dr, Brandon, FL 33511
$-608
Cash flow
-8.6%
Cash-on-Cash Return
4.2%
Cap rate
0.7%
Rent to Value Ratio
Active
$475,000
4
bds
|
2
ba
|
1,610
sqft
|
built
1964
3908 Alafia Blvd, Brandon, FL 33511
$-971
Cash flow
-10.7%
Cash-on-Cash Return
3.7%
Cap rate
0.6%
Rent to Value Ratio
Active
$275,000
3
bds
|
3
ba
|
1,684
sqft
|
built
2004
2824 Conch Hollow Dr, Brandon, FL 33511
$-505
Cash flow
-9.6%
Cash-on-Cash Return
3.9%
Cap rate
0.8%
Rent to Value Ratio
Active
$339,999
3
bds
|
3
ba
|
1,525
sqft
|
built
2022
2710 Chestnut Creek Pl, Brandon, FL 33510
$-581
Cash flow
-8.9%
Cash-on-Cash Return
4.1%
Cap rate
0.7%
Rent to Value Ratio
Active
$355,000
3
bds
|
2
ba
|
1,615
sqft
|
built
1990
1731 Elk Spring Dr, Brandon, FL 33511
$-414
Cash flow
-6.1%
Cash-on-Cash Return
4.7%
Cap rate
0.6%
Rent to Value Ratio
Active
$269,000
2
bds
|
3
ba
|
1,574
sqft
|
built
2005
2712 Conch Hollow Dr, Brandon, FL 33511
$-529
Cash flow
-10.3%
Cash-on-Cash Return
3.8%
Cap rate
0.7%
Rent to Value Ratio
Active
$449,900
4
bds
|
3
ba
|
2,270
sqft
|
built
2007
3510 Brook Crossing Dr, Brandon, FL 33511
$-831
Cash flow
-9.6%
Cash-on-Cash Return
3.9%
Cap rate
0.6%
Rent to Value Ratio

Active
$279,900
3
bds
|
3
ba
|
1,496
sqft
|
built
2012
780 Spring Flowers Trl, Brandon, FL 33511
$-776
Cash flow
-14.5%
Cash-on-Cash Return
2.8%
Cap rate
0.7%
Rent to Value Ratio

Active
$499,000
5
bds
|
3
ba
|
2,605
sqft
|
built
2021
2604 Knight Island Dr, Brandon, FL 33511
$-969
Cash flow
-10.1%
Cash-on-Cash Return
3.8%
Cap rate
0.6%
Rent to Value Ratio

Active
$294,999
3
bds
|
3
ba
|
1,525
sqft
|
built
2022
2764 Emory Sound Pl, Brandon, FL 33510
$-543
Cash flow
-9.6%
Cash-on-Cash Return
3.9%
Cap rate
0.8%
Rent to Value Ratio

Active
$259,900
2
bds
|
3
ba
|
1,398
sqft
|
built
2005
1552 Blue Magnolia Rd, Brandon, FL 33510
$-312
Cash flow
-6.3%
Cash-on-Cash Return
4.7%
Cap rate
0.8%
Rent to Value Ratio
Active
$475,000
4
bds
|
3
ba
|
2,950
sqft
|
built
1999
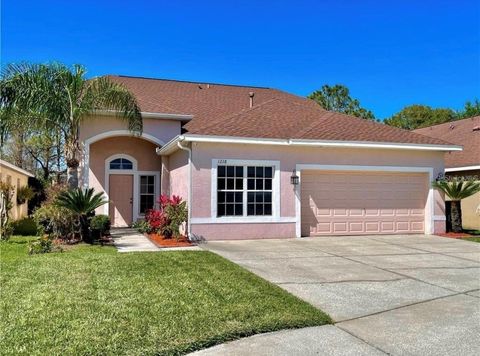
1218 Vinetree Dr, Brandon, FL 33510
$-549
Cash flow
-6.0%
Cash-on-Cash Return
4.8%
Cap rate
0.7%
Rent to Value Ratio
Active
$305,000
3
bds
|
3
ba
|
1,785
sqft
|
built
2019
3830 Vignoble Ln, Brandon, FL 33511
$-474
Cash flow
-8.1%
Cash-on-Cash Return
4.3%
Cap rate
0.8%
Rent to Value Ratio
Active
$364,900
3
bds
|
2
ba
|
1,624
sqft
|
built
2000
1652 Open Field Loop, Brandon, FL 33510
$-570
Cash flow
-8.1%
Cash-on-Cash Return
4.3%
Cap rate
0.7%
Rent to Value Ratio
Active
$399,800
4
bds
|
2
ba
|
1,608
sqft
|
built
1974
516 Highview Cir N, Brandon, FL 33510
$-536
Cash flow
-7.0%
Cash-on-Cash Return
4.7%
Cap rate
0.7%
Rent to Value Ratio

Active
$375,000
3
bds
|
2
ba
|
1,471
sqft
|
built
1997
1706 Kirtley Dr, Brandon, FL 33511
$-387
Cash flow
-5.4%
Cash-on-Cash Return
4.9%
Cap rate
0.7%
Rent to Value Ratio
Active
$440,000
3
bds
|
2
ba
|
1,450
sqft
|
built
1979
3911 King Dr, Brandon, FL 33511
$-544
Cash flow
-6.5%
Cash-on-Cash Return
4.7%
Cap rate
0.7%
Rent to Value Ratio
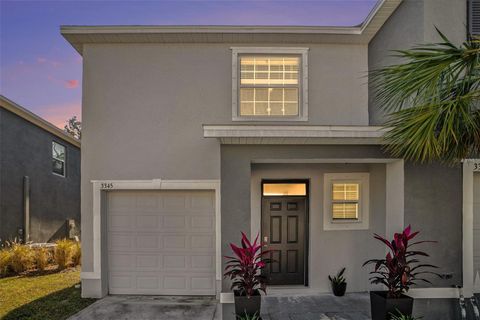
Active
$320,000
3
bds
|
3
ba
|
1,785
sqft
|
built
2022
3345 Pleasant Willow Ct, Brandon, FL 33511
$-704
Cash flow
-11.5%
Cash-on-Cash Return
3.5%
Cap rate
0.7%
Rent to Value Ratio
Active
$459,900
4
bds
|
2
ba
|
2,366
sqft
|
built
1995
1515 Lions Club Dr, Brandon, FL 33511
$-241
Cash flow
-2.7%
Cash-on-Cash Return
5.5%
Cap rate
0.7%
Rent to Value Ratio
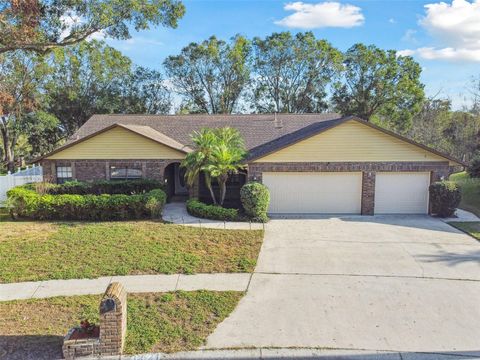
Active
$450,000
4
bds
|
2
ba
|
2,200
sqft
|
built
1993
1121 Belladonna Dr, Brandon, FL 33510
$-716
Cash flow
-8.3%
Cash-on-Cash Return
4.2%
Cap rate
0.6%
Rent to Value Ratio
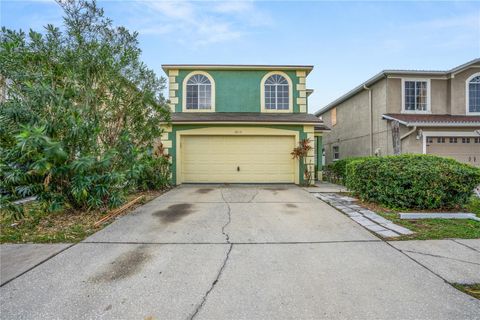
Active
$359,000
4
bds
|
3
ba
|
1,899
sqft
|
built
1996
1613 Prowmore Dr, Brandon, FL 33511
$-335
Cash flow
-4.9%
Cash-on-Cash Return
5.1%
Cap rate
0.7%
Rent to Value Ratio
Active
$152,000
2
bds
|
2
ba
|
1,068
sqft
|
built
1981
107 Caldwell Dr, Brandon, FL 33510
$182
Cash flow
6.2%
Cash-on-Cash Return
7.6%
Cap rate
1.1%
Rent to Value Ratio
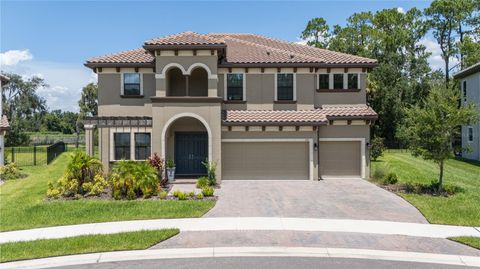
Active
$1,689,900
4
bds
|
3
ba
|
2,280
sqft
|
built
2014
2720 Garden Falls Dr, Brandon, FL 33511
$-7,636
Cash flow
-23.6%
Cash-on-Cash Return
0.7%
Cap rate
0.1%
Rent to Value Ratio
Active
$415,000
3
bds
|
2
ba
|
1,677
sqft
|
built
1958
404 E Morgan St, Brandon, FL 33510
$-659
Cash flow
-8.3%
Cash-on-Cash Return
4.2%
Cap rate
0.7%
Rent to Value Ratio
Active
$392,999
3
bds
|
2
ba
|
1,516
sqft
|
built
1986
2011 Green Juniper Ln, Brandon, FL 33511
$-487
Cash flow
-6.5%
Cash-on-Cash Return
4.7%
Cap rate
0.6%
Rent to Value Ratio
Active
$449,900
4
bds
|
3
ba
|
2,125
sqft
|
built
1976
701 S Oakwood Ave, Brandon, FL 33511
$-596
Cash flow
-6.9%
Cash-on-Cash Return
4.6%
Cap rate
0.7%
Rent to Value Ratio
Active
$349,900
3
bds
|
2
ba
|
1,572
sqft
|
built
1999
1122 Vinetree Dr, Brandon, FL 33510
$-454
Cash flow
-6.8%
Cash-on-Cash Return
4.6%
Cap rate
0.7%
Rent to Value Ratio
Active
$880,000
4
bds
|
4
ba
|
3,725
sqft
|
built
2006
918 Shoals Landing Dr, Brandon, FL 33511
$-2,243
Cash flow
-13.3%
Cash-on-Cash Return
3.1%
Cap rate
0.6%
Rent to Value Ratio

Active
$725,000
4
bds
|
3
ba
|
1,902
sqft
|
built
1956
4617 John Moore Rd, Brandon, FL 33511
$-1,473
Cash flow
-10.6%
Cash-on-Cash Return
3.7%
Cap rate
0.6%
Rent to Value Ratio
Active
$925,000
5
bds
|
4
ba
|
3,546
sqft
|
built
2022
291 Mossy River Ct, Brandon, FL 33511
$-2,166
Cash flow
-12.2%
Cash-on-Cash Return
3.3%
Cap rate
0.6%
Rent to Value Ratio
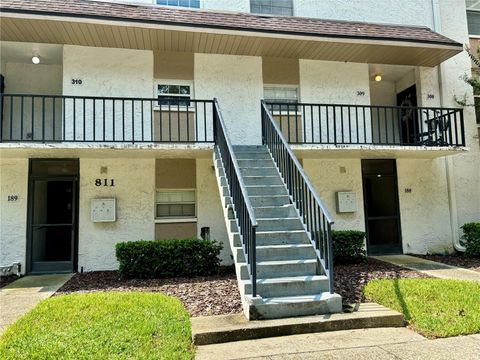
Active
$200,000
2
bds
|
2
ba
|
1,068
sqft
|
built
1981
811 Russell Ln, Brandon, FL 33510
$-279
Cash flow
-7.3%
Cash-on-Cash Return
4.5%
Cap rate
0.9%
Rent to Value Ratio

Active
$329,900
3
bds
|
3
ba
|
1,525
sqft
|
built
2022
2714 Chestnut Creek Pl, Brandon, FL 33510
$-538
Cash flow
-8.5%
Cash-on-Cash Return
4.2%
Cap rate
0.8%
Rent to Value Ratio
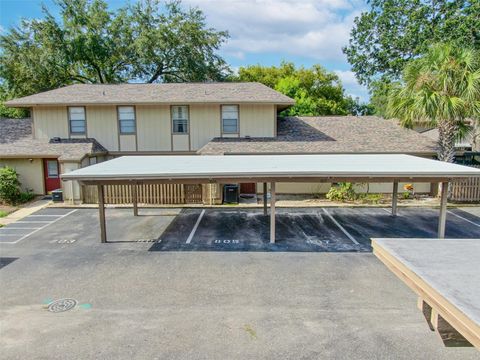
Active
$215,000
3
bds
|
2
ba
|
1,256
sqft
|
built
1975
807 Hunters Ct, Brandon, FL 33511
$-373
Cash flow
-9.1%
Cash-on-Cash Return
4.1%
Cap rate
0.8%
Rent to Value Ratio
Active
$378,900
3
bds
|
2
ba
|
1,690
sqft
|
built
1966
508 Brooker Rd, Brandon, FL 33511
$-368
Cash flow
-5.1%
Cash-on-Cash Return
5.0%
Cap rate
0.7%
Rent to Value Ratio
Active
$564,900
4
bds
|
4
ba
|
2,688
sqft
|
built
2001
805 Woodcarver Ln, Brandon, FL 33510
$-1,291
Cash flow
-11.9%
Cash-on-Cash Return
3.4%
Cap rate
0.6%
Rent to Value Ratio

Active
$689,900
4
bds
|
3
ba
|
3,434
sqft
|
built
2007
614 Vintage Way, Brandon, FL 33511
$-1,768
Cash flow
-13.4%
Cash-on-Cash Return
3.1%
Cap rate
0.6%
Rent to Value Ratio

Active
$449,000
4
bds
|
3
ba
|
2,026
sqft
|
built
1996
1553 Scotch Pine Dr, Brandon, FL 33511
$-474
Cash flow
-5.5%
Cash-on-Cash Return
4.9%
Cap rate
0.7%
Rent to Value Ratio