Brighton, CO Investment Properties for Sale
Browse homes for sale and investment properties in Brighton, CO. Refine your search by price, property type, or more.
Best cash flowing properties in Brighton, CO

Active
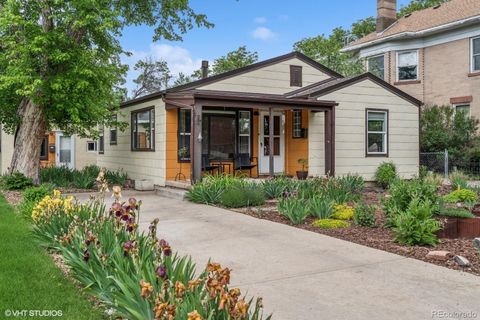
$395,000
5
bds
|
2
ba
|
1,828
sqft
|
built
1973
362 Dogwood Ave, Brighton, CO 80601
$-199
Cash flow
-2.6%
Cash-on-Cash Return
5.1%
Cap rate
0.7%
Rent to Value Ratio

Active
$399,500
2
bds
|
1
ba
|
870
sqft
|
built
1949
544 S 3rd Ave, Brighton, CO 80601
$-506
Cash flow
-6.6%
Cash-on-Cash Return
4.2%
Cap rate
0.6%
Rent to Value Ratio
129 out of 142 properties for sale in Brighton, CO
Limited Results Shown
Create a free account, or log in to reveal all property listings and enjoy the complete experience.
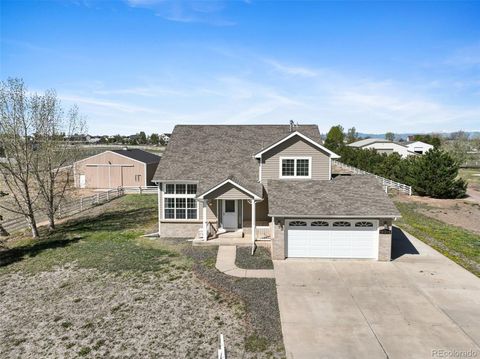
Active
$2,700,000
4
bds
|
6
ba
|
6,623
sqft
|
built
2021
634 County Road 37, Brighton, CO 80603
$-11,184
Cash flow
-21.6%
Cash-on-Cash Return
0.7%
Cap rate
0.1%
Rent to Value Ratio
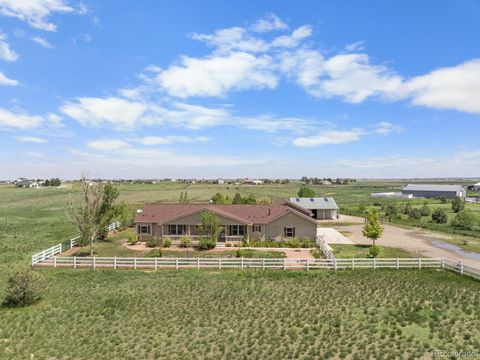
Active
$1,140,000
4
bds
|
4
ba
|
4,218
sqft
|
built
2002
16021 Verbena St, Brighton, CO 80602
$-3,055
Cash flow
-14.0%
Cash-on-Cash Return
2.5%
Cap rate
0.4%
Rent to Value Ratio
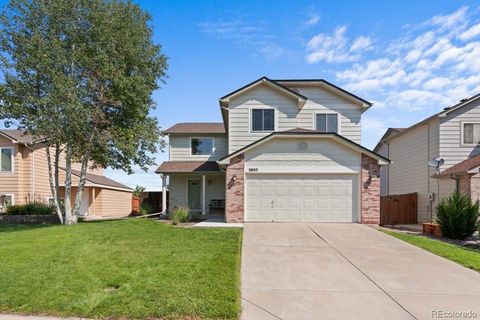
Active
$473,900
3
bds
|
3
ba
|
1,816
sqft
|
built
2022
676 Hearthstone Ave, Brighton, CO 80601
$-772
Cash flow
-8.5%
Cash-on-Cash Return
3.7%
Cap rate
0.6%
Rent to Value Ratio
Active
$735,000
4
bds
|
4
ba
|
3,133
sqft
|
built
2019
728 Larkspur Ct, Brighton, CO 80601
$-1,410
Cash flow
-10.0%
Cash-on-Cash Return
3.4%
Cap rate
0.5%
Rent to Value Ratio
Active
$500,000
3
bds
|
2
ba
|
1,608
sqft
|
built
1944
113 S 4th Ave, Brighton, CO 80601
$-642
Cash flow
-6.7%
Cash-on-Cash Return
4.1%
Cap rate
0.6%
Rent to Value Ratio
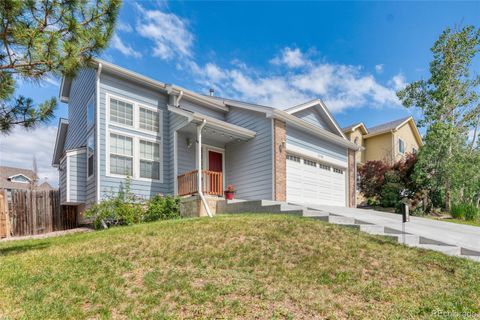
Active
$559,900
4
bds
|
3
ba
|
2,144
sqft
|
built
1999
12388 Jasmine St, Brighton, CO 80602
$-1,003
Cash flow
-9.3%
Cash-on-Cash Return
3.5%
Cap rate
0.5%
Rent to Value Ratio

Active
$469,900
6
bds
|
3
ba
|
1,120
sqft
|
built
1963
61 S 17th Avenue Dr, Brighton, CO 80601
$-522
Cash flow
-5.8%
Cash-on-Cash Return
4.3%
Cap rate
0.6%
Rent to Value Ratio
Active
$470,000
3
bds
|
3
ba
|
1,564
sqft
|
built
2005
4436 Windmill Dr, Brighton, CO 80601
$-747
Cash flow
-8.3%
Cash-on-Cash Return
3.8%
Cap rate
0.6%
Rent to Value Ratio

Active
$685,000
5
bds
|
3
ba
|
3,622
sqft
|
built
2018
5540 Juniper Dr, Brighton, CO 80601
$-1,502
Cash flow
-11.4%
Cash-on-Cash Return
3.0%
Cap rate
0.5%
Rent to Value Ratio

Active
$589,000
4
bds
|
3
ba
|
2,113
sqft
|
built
2005
3978 Balderas St, Brighton, CO 80601
$-1,043
Cash flow
-9.2%
Cash-on-Cash Return
3.6%
Cap rate
0.5%
Rent to Value Ratio

Active
$680,000
5
bds
|
4
ba
|
3,956
sqft
|
built
2019
1982 Griffin Dr, Brighton, CO 80601
$-1,530
Cash flow
-11.7%
Cash-on-Cash Return
3.0%
Cap rate
0.5%
Rent to Value Ratio

Active
$799,000
3
bds
|
3
ba
|
2,550
sqft
|
built
1996
15665 Havana Way, Brighton, CO 80602
$-2,145
Cash flow
-14.0%
Cash-on-Cash Return
2.5%
Cap rate
0.4%
Rent to Value Ratio

Active
$1,395,000
5
bds
|
5
ba
|
5,103
sqft
|
built
2018
11040 E 161st Ave, Brighton, CO 80602
$-3,667
Cash flow
-13.7%
Cash-on-Cash Return
2.5%
Cap rate
0.4%
Rent to Value Ratio

Active
$800,000
3
bds
|
2
ba
|
1,714
sqft
|
built
2000
30344 E 165th Ave, Brighton, CO 80603
$-2,236
Cash flow
-14.6%
Cash-on-Cash Return
2.3%
Cap rate
0.4%
Rent to Value Ratio

Active
$549,900
4
bds
|
3
ba
|
1,973
sqft
|
built
1996
551 Longhurst Pl, Brighton, CO 80601
$-951
Cash flow
-9.0%
Cash-on-Cash Return
3.6%
Cap rate
0.5%
Rent to Value Ratio

Active
$975,000
4
bds
|
3
ba
|
2,578
sqft
|
built
1999
16791 Telluride St, Brighton, CO 80601
$-2,574
Cash flow
-13.8%
Cash-on-Cash Return
2.5%
Cap rate
0.4%
Rent to Value Ratio
Active
$580,000
4
bds
|
3
ba
|
2,789
sqft
|
built
2014
19 S 45th Ave, Brighton, CO 80601
$-895
Cash flow
-8.1%
Cash-on-Cash Return
3.8%
Cap rate
0.6%
Rent to Value Ratio

Active
$650,000
4
bds
|
4
ba
|
4,319
sqft
|
built
2020
607 Azalea St, Brighton, CO 80601
$-1,143
Cash flow
-9.2%
Cash-on-Cash Return
3.6%
Cap rate
0.6%
Rent to Value Ratio

Active
$485,000
3
bds
|
3
ba
|
1,912
sqft
|
built
2000
395 Longspur Dr, Brighton, CO 80601
$-903
Cash flow
-9.7%
Cash-on-Cash Return
3.4%
Cap rate
0.6%
Rent to Value Ratio
Active
$739,000
3
bds
|
3
ba
|
1,767
sqft
|
built
1999
16275 Electra St, Brighton, CO 80603
$-1,991
Cash flow
-14.1%
Cash-on-Cash Return
2.4%
Cap rate
0.4%
Rent to Value Ratio
Active
$870,000
3
bds
|
3
ba
|
1,728
sqft
|
built
2000
32501 E 137th Way, Brighton, CO 80603
$-2,356
Cash flow
-14.1%
Cash-on-Cash Return
2.4%
Cap rate
0.4%
Rent to Value Ratio

Active
$1,100,000
5
bds
|
5
ba
|
3,515
sqft
|
built
2016
11343 E 163rd Ct, Brighton, CO 80602
$-2,811
Cash flow
-13.3%
Cash-on-Cash Return
2.6%
Cap rate
0.4%
Rent to Value Ratio

Active
$454,999
4
bds
|
3
ba
|
1,567
sqft
|
built
1999
1086 Mockingbird St, Brighton, CO 80601
$-712
Cash flow
-8.2%
Cash-on-Cash Return
3.8%
Cap rate
0.6%
Rent to Value Ratio
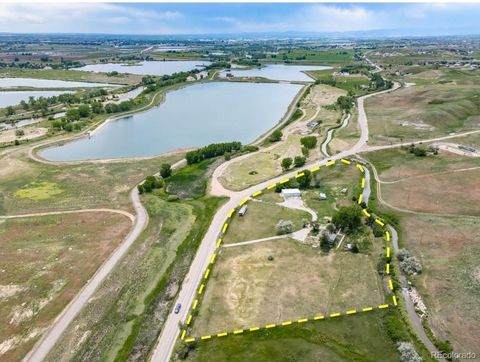
Active
$785,000
3
bds
|
1
ba
|
1,056
sqft
|
built
1959
14831 Riverdale Rd, Brighton, CO 80602
$-1,621
Cash flow
-10.8%
Cash-on-Cash Return
3.2%
Cap rate
0.4%
Rent to Value Ratio

Active
$595,000
3
bds
|
3
ba
|
2,576
sqft
|
built
1997
525 Badger Creek Dr, Brighton, CO 80601
$-909
Cash flow
-8.0%
Cash-on-Cash Return
3.8%
Cap rate
0.5%
Rent to Value Ratio

Active
$720,000
5
bds
|
5
ba
|
3,939
sqft
|
built
2021
5840 Longs Peak St, Brighton, CO 80601
$-1,607
Cash flow
-11.6%
Cash-on-Cash Return
3.0%
Cap rate
0.5%
Rent to Value Ratio
Active
$529,900
3
bds
|
3
ba
|
1,484
sqft
|
built
1993
5805 E 124th Way, Brighton, CO 80602
$-807
Cash flow
-7.9%
Cash-on-Cash Return
3.9%
Cap rate
0.5%
Rent to Value Ratio

Active
$449,000
3
bds
|
3
ba
|
1,611
sqft
|
built
2005
5055 Pelican St, Brighton, CO 80601
$-804
Cash flow
-9.3%
Cash-on-Cash Return
3.5%
Cap rate
0.6%
Rent to Value Ratio

Active
$450,000
3
bds
|
2
ba
|
1,208
sqft
|
built
1901
405 S 4th Ave, Brighton, CO 80601
$-685
Cash flow
-7.9%
Cash-on-Cash Return
3.9%
Cap rate
0.5%
Rent to Value Ratio
Active
$699,900
5
bds
|
4
ba
|
4,054
sqft
|
built
2002
1138 Coneflower Way, Brighton, CO 80601
$-1,423
Cash flow
-10.6%
Cash-on-Cash Return
3.2%
Cap rate
0.5%
Rent to Value Ratio

Active
$779,000
5
bds
|
2
ba
|
3,109
sqft
|
built
1985
13410 Granby St, Brighton, CO 80601
$-1,991
Cash flow
-13.3%
Cash-on-Cash Return
2.6%
Cap rate
0.4%
Rent to Value Ratio

Active
$925,000
4
bds
|
5
ba
|
4,827
sqft
|
built
2002
14701 Yosemite St, Brighton, CO 80602
$-2,263
Cash flow
-12.8%
Cash-on-Cash Return
2.7%
Cap rate
0.4%
Rent to Value Ratio
Active
$779,000
4
bds
|
4
ba
|
2,911
sqft
|
built
1997
29145 E 160th Ct, Brighton, CO 80603
$-2,102
Cash flow
-14.1%
Cash-on-Cash Return
2.4%
Cap rate
0.4%
Rent to Value Ratio

Active
$530,000
4
bds
|
3
ba
|
2,463
sqft
|
built
2016
467 S 36th Ave, Brighton, CO 80601
$-749
Cash flow
-7.4%
Cash-on-Cash Return
4.0%
Cap rate
0.6%
Rent to Value Ratio

Active
$1,100,000
5
bds
|
5
ba
|
4,850
sqft
|
built
2006
9965 E 143rd Way, Brighton, CO 80602
$-2,557
Cash flow
-12.1%
Cash-on-Cash Return
2.9%
Cap rate
0.5%
Rent to Value Ratio

Active
$854,900
3
bds
|
4
ba
|
3,942
sqft
|
built
2000
29852 E 163rd Pl, Brighton, CO 80603
$-2,259
Cash flow
-13.8%
Cash-on-Cash Return
2.5%
Cap rate
0.4%
Rent to Value Ratio
Active
$623,000
5
bds
|
4
ba
|
3,560
sqft
|
built
2003
3406 Purcell St, Brighton, CO 80601
$-593
Cash flow
-5.0%
Cash-on-Cash Return
4.5%
Cap rate
0.6%
Rent to Value Ratio

Active
$624,900
5
bds
|
3
ba
|
2,772
sqft
|
built
2020
3074 Kestrel St, Brighton, CO 80601
$-1,165
Cash flow
-9.7%
Cash-on-Cash Return
3.4%
Cap rate
0.6%
Rent to Value Ratio