Broken Arrow, OK Investment Properties for Sale
Browse homes for sale and investment properties in Broken Arrow, OK. Refine your search by price, property type, or more.
Best cash flowing properties in Broken Arrow, OK
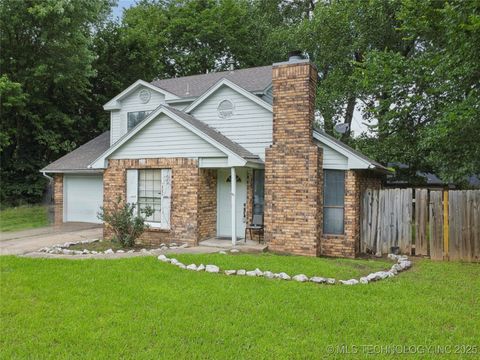
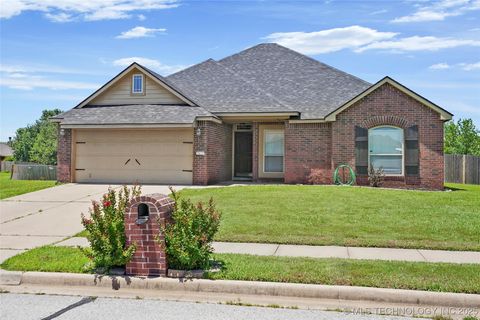
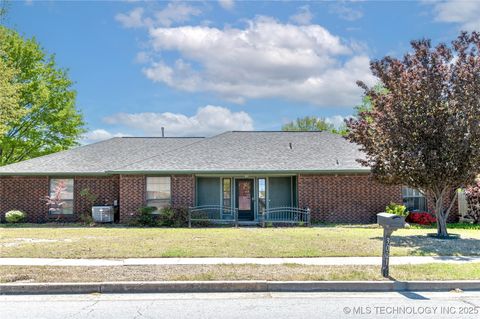
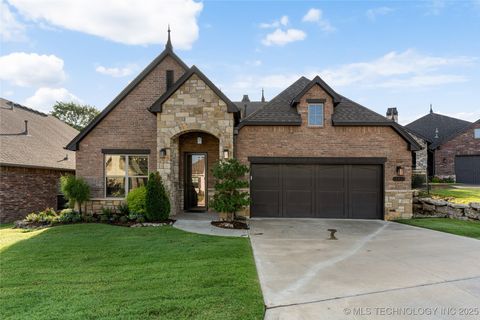
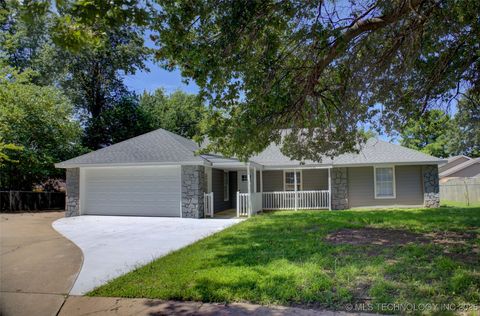
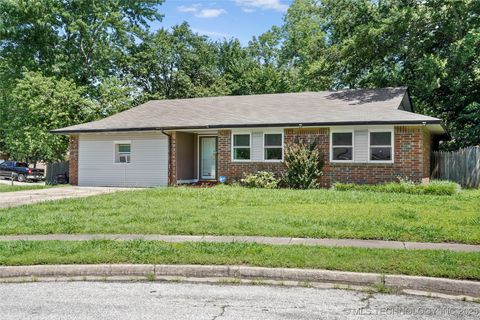
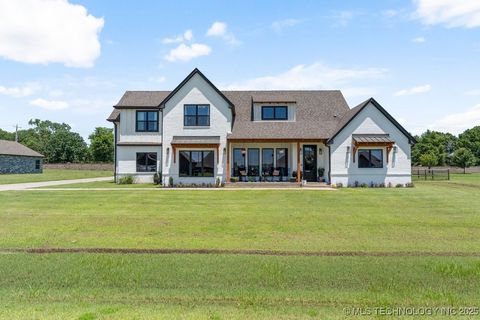
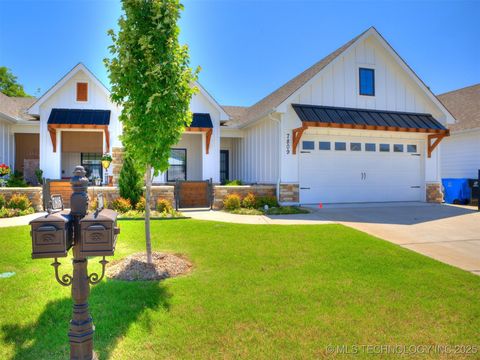
Active
$175,000
3
bds
|
2
ba
|
1,479
sqft
|
built
1985
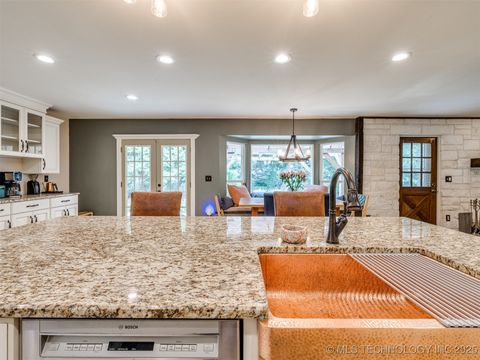
5609 S Juniper Ave, Broken Arrow, OK 74011
$13
Cash flow
0.4%
Cash-on-Cash Return
6.4%
Cap rate
0.9%
Rent to Value Ratio
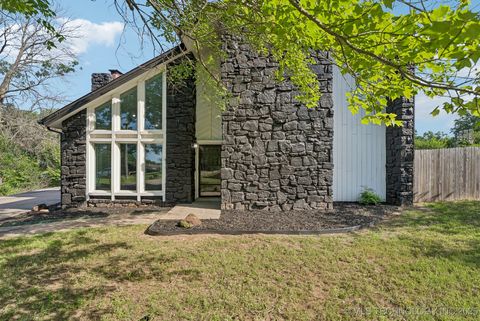
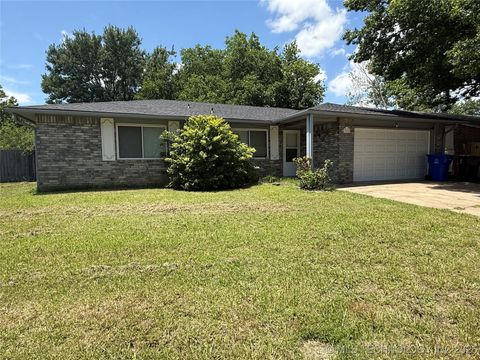
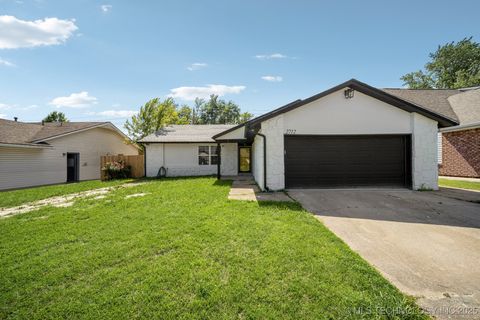
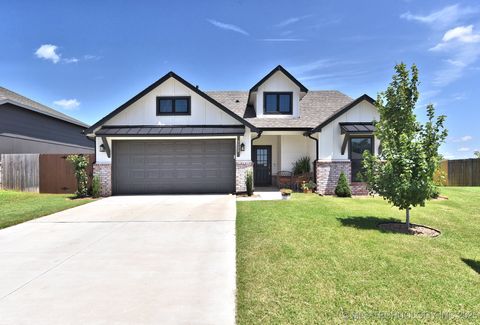
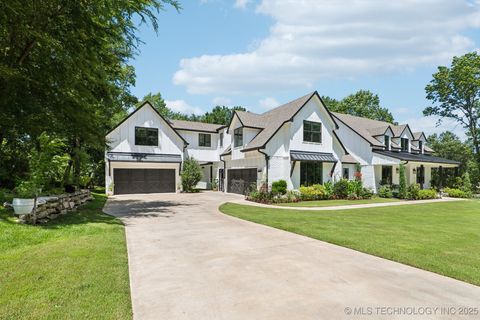
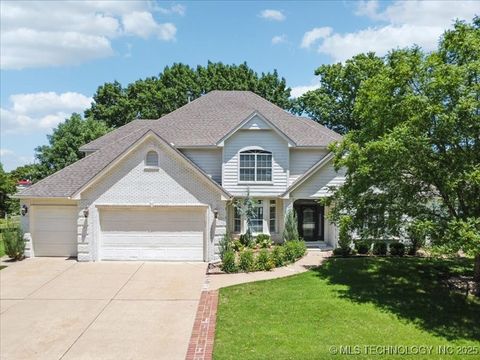
Active
$380,000
4
bds
|
4
ba
|
3,875
sqft
|
built
1979
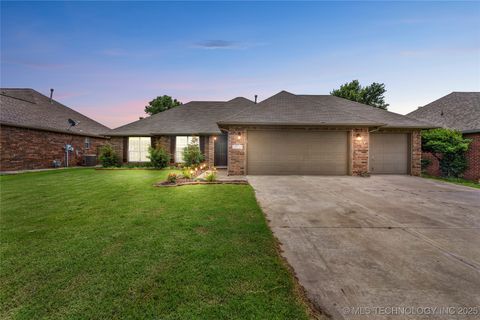
12505 E 136th St S, Broken Arrow, OK 74011
$-12
Cash flow
-0.2%
Cash-on-Cash Return
5.6%
Cap rate
0.8%
Rent to Value Ratio
307 out of 430 properties for sale in Broken Arrow, OK
Limited Results Shown
Create a free account, or log in to reveal all property listings and enjoy the complete experience.
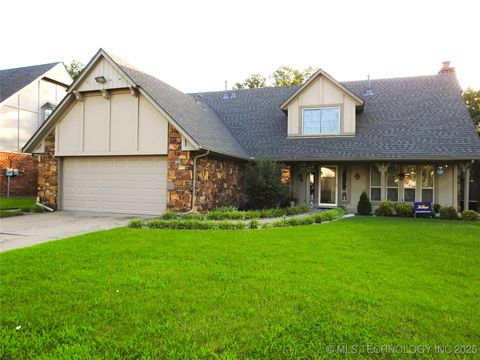
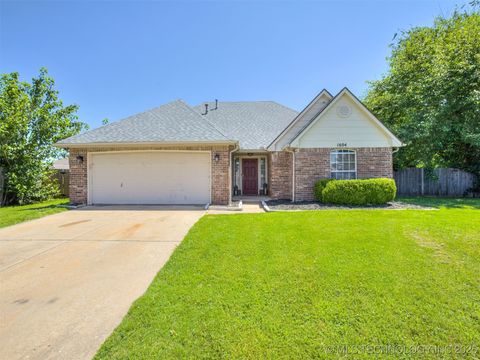
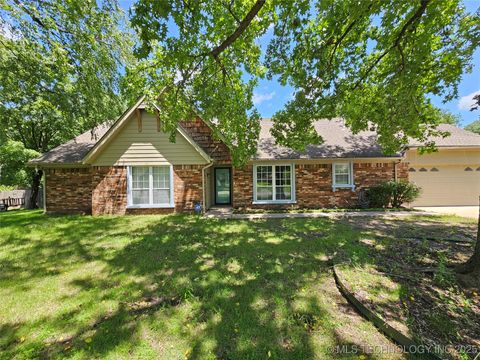
Active
$319,500
4
bds
|
3
ba
|
2,465
sqft
|
built
1978
1604 S Chestnut Ave, Broken Arrow, OK 74012
$-320
Cash flow
-5.2%
Cash-on-Cash Return
4.5%
Cap rate
0.7%
Rent to Value Ratio
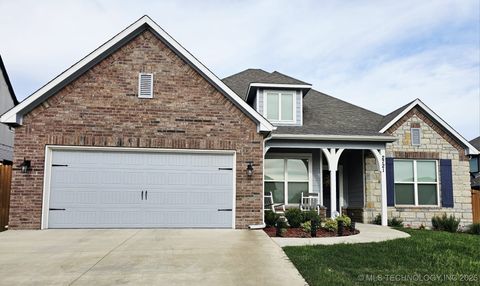
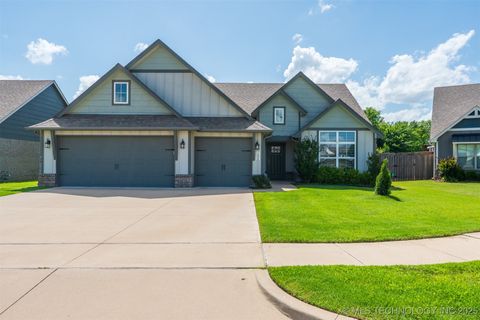
Active
$529,000
4
bds
|
4
ba
|
2,763
sqft
|
built
2022
2721 S 8th St, Broken Arrow, OK 74012
$-1,288
Cash flow
-12.7%
Cash-on-Cash Return
2.8%
Cap rate
0.5%
Rent to Value Ratio
Active
$269,900
3
bds
|
2
ba
|
1,560
sqft
|
built
2007
5612 N 31st St, Broken Arrow, OK 74014
$-603
Cash flow
-11.7%
Cash-on-Cash Return
3.6%
Cap rate
0.6%
Rent to Value Ratio
Active
$290,000
4
bds
|
3
ba
|
2,488
sqft
|
built
1978
1101 S Chestnut Ave, Broken Arrow, OK 74012
$-347
Cash flow
-6.2%
Cash-on-Cash Return
4.2%
Cap rate
0.7%
Rent to Value Ratio
Active
$359,000
4
bds
|
2
ba
|
2,141
sqft
|
built
2021
2008 E Union St, Broken Arrow, OK 74011
$-524
Cash flow
-7.6%
Cash-on-Cash Return
3.9%
Cap rate
0.6%
Rent to Value Ratio
Active
$369,990
3
bds
|
3
ba
|
2,341
sqft
|
built
1998
105 S Desert Palm Ave, Broken Arrow, OK 74012
$-860
Cash flow
-12.1%
Cash-on-Cash Return
3.5%
Cap rate
0.5%
Rent to Value Ratio
Active
$284,900
3
bds
|
2
ba
|
1,763
sqft
|
built
1997
1604 W Los Angeles Cir, Broken Arrow, OK 74011
$-475
Cash flow
-8.7%
Cash-on-Cash Return
4.3%
Cap rate
0.6%
Rent to Value Ratio
Active
$264,000
3
bds
|
2
ba
|
1,545
sqft
|
built
2003
20409 E 49th St S, Broken Arrow, OK 74014
$-471
Cash flow
-9.3%
Cash-on-Cash Return
4.1%
Cap rate
0.6%
Rent to Value Ratio
Active
$370,000
4
bds
|
3
ba
|
2,574
sqft
|
built
2003
19722 E 50th Ct S, Broken Arrow, OK 74014
$-649
Cash flow
-9.2%
Cash-on-Cash Return
3.6%
Cap rate
0.5%
Rent to Value Ratio
Active
$425,000
4
bds
|
3
ba
|
2,172
sqft
|
built
2021
3610 S Fir Ct, Broken Arrow, OK 74011
$-784
Cash flow
-9.6%
Cash-on-Cash Return
4.1%
Cap rate
0.7%
Rent to Value Ratio
Active
$249,900
3
bds
|
2
ba
|
1,822
sqft
|
built
1979
3001 W Broadway St, Broken Arrow, OK 74012
$-116
Cash flow
-2.4%
Cash-on-Cash Return
5.1%
Cap rate
0.7%
Rent to Value Ratio
Active
$260,000
2
bds
|
2
ba
|
1,380
sqft
|
built
2015
445 S Cypress Ave, Broken Arrow, OK 74012
$-615
Cash flow
-12.3%
Cash-on-Cash Return
3.4%
Cap rate
0.6%
Rent to Value Ratio
Active
$300,000
3
bds
|
1
ba
|
912
sqft
|
built
1956
705 W Hartford Pl, Broken Arrow, OK 74012
$-671
Cash flow
-11.7%
Cash-on-Cash Return
3.6%
Cap rate
0.5%
Rent to Value Ratio
Active
$293,000
3
bds
|
2
ba
|
1,696
sqft
|
built
2007
1801 E Montgomery St, Broken Arrow, OK 74012
$-606
Cash flow
-10.8%
Cash-on-Cash Return
3.8%
Cap rate
0.6%
Rent to Value Ratio
Active
$529,900
3
bds
|
3
ba
|
2,177
sqft
|
built
2021
3735 S Redwood Dr, Broken Arrow, OK 74011
$-1,499
Cash flow
-14.8%
Cash-on-Cash Return
2.9%
Cap rate
0.5%
Rent to Value Ratio
Active
$199,900
3
bds
|
2
ba
|
1,644
sqft
|
built
1974
3024 S Ash Ct, Broken Arrow, OK 74012
$-136
Cash flow
-3.5%
Cash-on-Cash Return
5.5%
Cap rate
0.8%
Rent to Value Ratio
Active
$389,500
3
bds
|
2
ba
|
2,346
sqft
|
built
2004
921 S 75th St, Broken Arrow, OK 74014
$-806
Cash flow
-10.8%
Cash-on-Cash Return
3.8%
Cap rate
0.6%
Rent to Value Ratio
Active
$384,000
5
bds
|
3
ba
|
2,404
sqft
|
built
2006
2611 S 15th Pl, Broken Arrow, OK 74012
$-672
Cash flow
-9.1%
Cash-on-Cash Return
4.2%
Cap rate
0.7%
Rent to Value Ratio
Active
$279,000
4
bds
|
2
ba
|
2,028
sqft
|
built
1977
1304 N Ironwood Ave, Broken Arrow, OK 74012
$-402
Cash flow
-7.5%
Cash-on-Cash Return
4.5%
Cap rate
0.6%
Rent to Value Ratio
Active
$285,000
3
bds
|
2
ba
|
1,526
sqft
|
built
1981
2712 S Fir Ave, Broken Arrow, OK 74012
$-576
Cash flow
-10.5%
Cash-on-Cash Return
3.8%
Cap rate
0.6%
Rent to Value Ratio
Active
$210,000
3
bds
|
1
ba
|
1,199
sqft
|
built
1972
11837 E 61st Pl, Broken Arrow, OK 74012
$-233
Cash flow
-5.8%
Cash-on-Cash Return
4.9%
Cap rate
0.7%
Rent to Value Ratio
Active
$339,900
3
bds
|
2
ba
|
1,873
sqft
|
built
1980
205 S Kalanchoe Ave, Broken Arrow, OK 74012
$-762
Cash flow
-11.7%
Cash-on-Cash Return
3.6%
Cap rate
0.5%
Rent to Value Ratio
Active
$225,000
3
bds
|
2
ba
|
1,394
sqft
|
built
1974
2030 W Richmond St, Broken Arrow, OK 74012
$-167
Cash flow
-3.9%
Cash-on-Cash Return
5.4%
Cap rate
0.7%
Rent to Value Ratio
Active
$310,000
3
bds
|
2
ba
|
1,614
sqft
|
built
2021
3122 W Baton Rouge Pl, Broken Arrow, OK 74011
$-563
Cash flow
-9.5%
Cash-on-Cash Return
3.5%
Cap rate
0.6%
Rent to Value Ratio
Active
$534,900
4
bds
|
3
ba
|
2,521
sqft
|
built
1974
7705 S 232nd East Ave, Broken Arrow, OK 74014
$-1,862
Cash flow
-18.2%
Cash-on-Cash Return
2.1%
Cap rate
0.3%
Rent to Value Ratio
Active
$820,000
4
bds
|
5
ba
|
4,751
sqft
|
built
1998
8766 Haskell Dr, Broken Arrow, OK 74014
$-2,385
Cash flow
-15.2%
Cash-on-Cash Return
2.8%
Cap rate
0.4%
Rent to Value Ratio
Active
$585,000
4
bds
|
4
ba
|
3,393
sqft
|
built
2020
21933 E 101st Pl S, Broken Arrow, OK 74014
$-1,515
Cash flow
-13.5%
Cash-on-Cash Return
2.6%
Cap rate
0.4%
Rent to Value Ratio
Active
$820,000
3
bds
|
5
ba
|
4,244
sqft
|
built
2020
7604 S 6th St, Broken Arrow, OK 74011
$-2,098
Cash flow
-13.3%
Cash-on-Cash Return
3.2%
Cap rate
0.5%
Rent to Value Ratio
Active
$284,500
3
bds
|
2
ba
|
1,825
sqft
|
built
1979
12717 E 133rd Pl S, Broken Arrow, OK 74011
$-512
Cash flow
-9.4%
Cash-on-Cash Return
4.1%
Cap rate
0.6%
Rent to Value Ratio
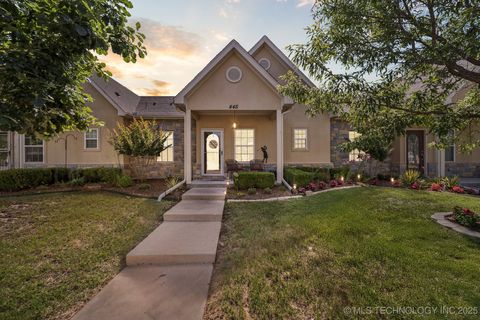
Active
$349,000
4
bds
|
2
ba
|
1,931
sqft
|
built
2019
3624 N 32nd St, Broken Arrow, OK 74014
$-781
Cash flow
-11.7%
Cash-on-Cash Return
3.6%
Cap rate
0.6%
Rent to Value Ratio
Active
$319,000
2
bds
|
2
ba
|
1,726
sqft
|
built
2021
7809 S Redbud Ave, Broken Arrow, OK 74011
$-661
Cash flow
-10.8%
Cash-on-Cash Return
3.8%
Cap rate
0.7%
Rent to Value Ratio
Active
$639,900
4
bds
|
4
ba
|
5,050
sqft
|
built
1994
408 Fairway Ct, Broken Arrow, OK 74011
$-1,051
Cash flow
-8.6%
Cash-on-Cash Return
4.3%
Cap rate
0.6%
Rent to Value Ratio
Active
$525,000
5
bds
|
3
ba
|
3,452
sqft
|
built
2018
6904 S Chestnut Ave, Broken Arrow, OK 74011
$-1,284
Cash flow
-12.8%
Cash-on-Cash Return
3.3%
Cap rate
0.5%
Rent to Value Ratio
Active
$272,500
3
bds
|
2
ba
|
1,850
sqft
|
built
1983
1800 N 26th St, Broken Arrow, OK 74014
$-308
Cash flow
-5.9%
Cash-on-Cash Return
4.3%
Cap rate
0.6%
Rent to Value Ratio
Active
$389,000
4
bds
|
3
ba
|
2,821
sqft
|
built
1978
7001 S Redbud Ave, Broken Arrow, OK 74011
$-176
Cash flow
-2.4%
Cash-on-Cash Return
5.1%
Cap rate
0.7%
Rent to Value Ratio
Active
$274,000
3
bds
|
2
ba
|
1,676
sqft
|
built
2002
19714 E 44th Pl S, Broken Arrow, OK 74014
$-551
Cash flow
-10.5%
Cash-on-Cash Return
3.8%
Cap rate
0.6%
Rent to Value Ratio
Active
$269,900
3
bds
|
2
ba
|
1,870
sqft
|
built
1998
1000 W Inglewood St, Broken Arrow, OK 74011
$-364
Cash flow
-7.0%
Cash-on-Cash Return
4.6%
Cap rate
0.7%
Rent to Value Ratio
Active
$725,000
5
bds
|
4
ba
|
5,530
sqft
|
built
1994
4405 W Ithica St, Broken Arrow, OK 74012
$-1,086
Cash flow
-7.8%
Cash-on-Cash Return
3.9%
Cap rate
0.6%
Rent to Value Ratio