Broken Arrow, OK Investment Properties for Sale
Browse homes for sale and investment properties in Broken Arrow, OK. Refine your search by price, property type, or more.
Best cash flowing properties in Broken Arrow, OK
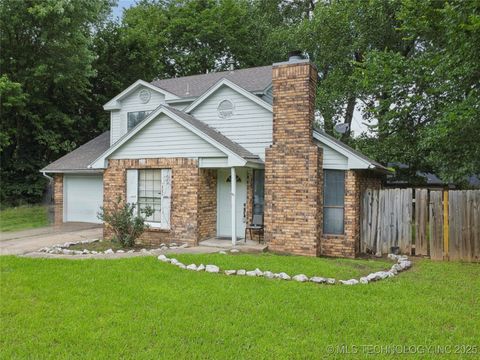
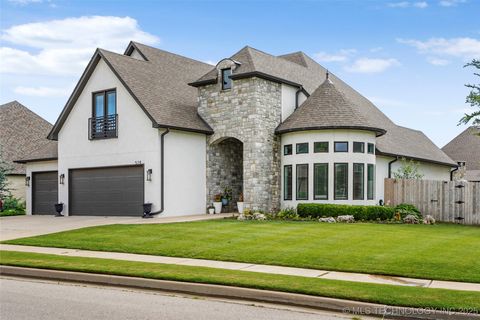
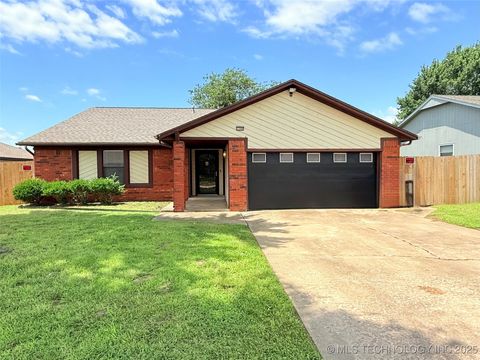
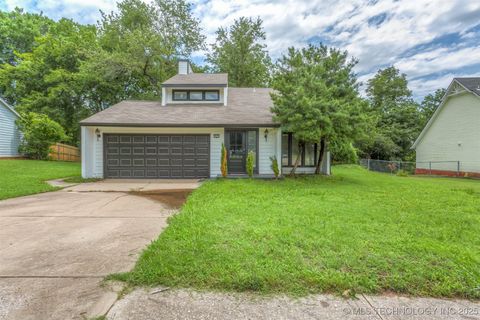
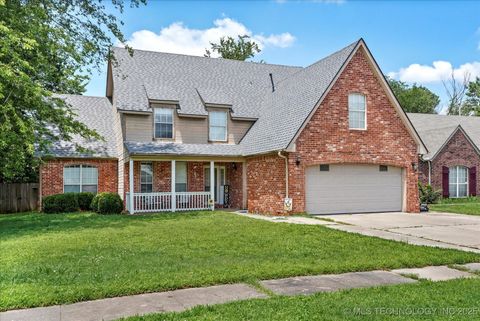
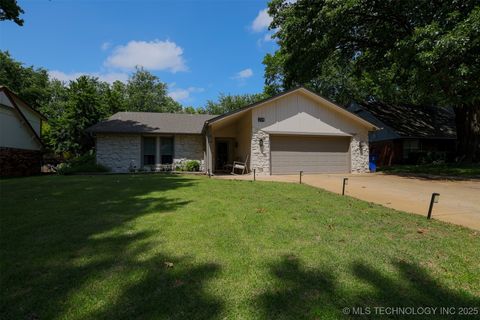
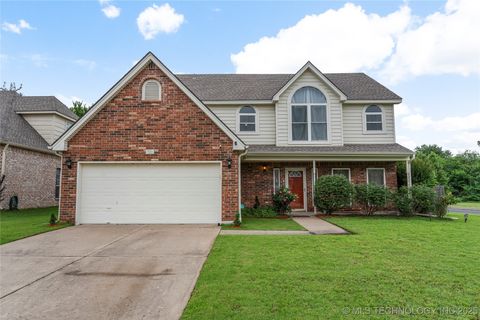
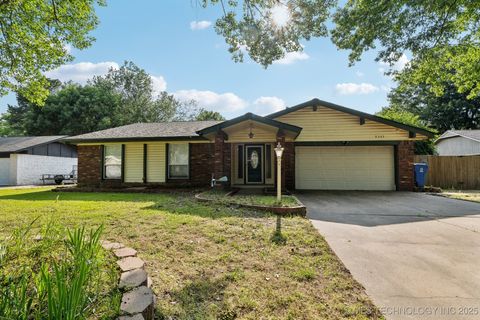
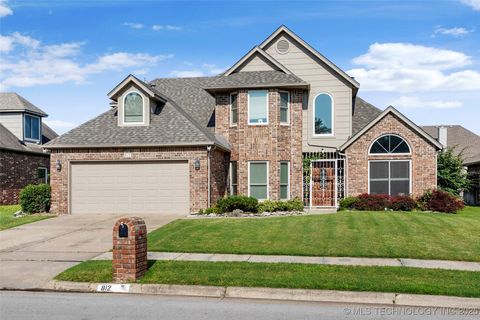
Active
$175,000
3
bds
|
2
ba
|
1,479
sqft
|
built
1985
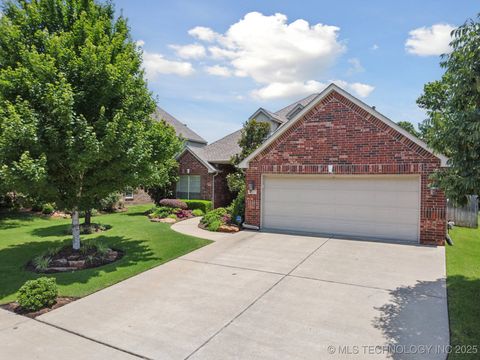
5609 S Juniper Ave, Broken Arrow, OK 74011
$13
Cash flow
0.4%
Cash-on-Cash Return
6.4%
Cap rate
0.9%
Rent to Value Ratio
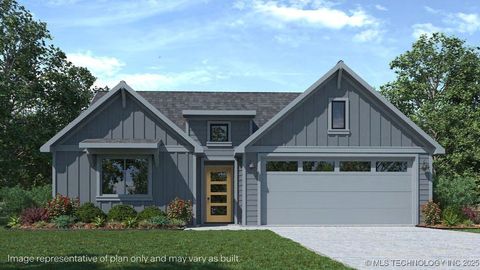
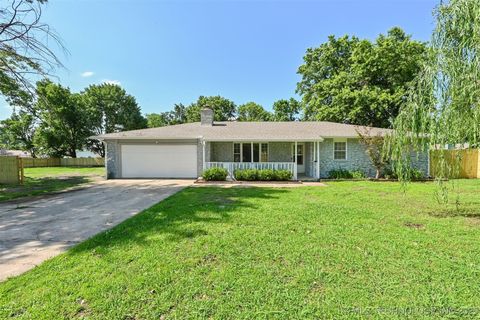
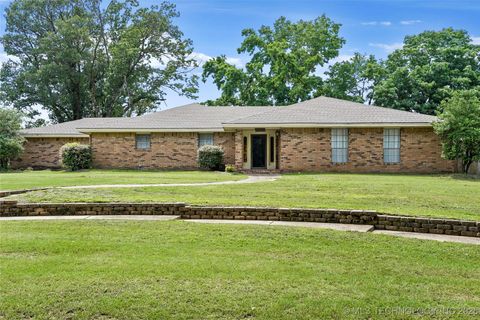
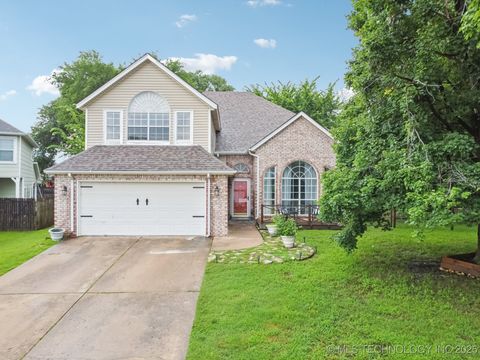
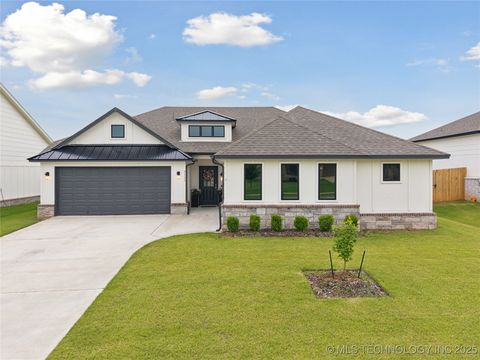
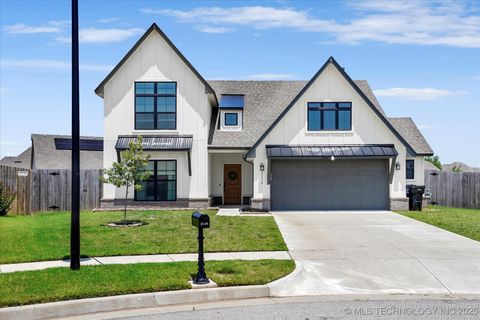
Active
$309,900
4
bds
|
2
ba
|
1,796
sqft
|
built
2025
3413 E Montpelier Pl, Broken Arrow, OK 74014
$-96
Cash flow
-1.6%
Cash-on-Cash Return
5.9%
Cap rate
0.7%
Rent to Value Ratio
307 out of 430 properties for sale in Broken Arrow, OK
Limited Results Shown
Create a free account, or log in to reveal all property listings and enjoy the complete experience.
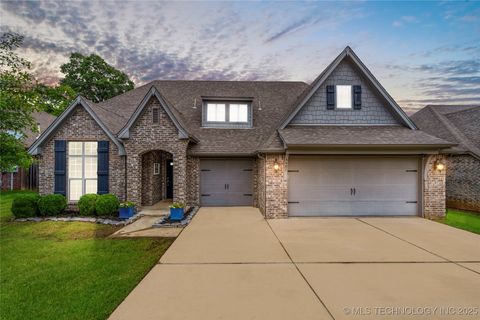
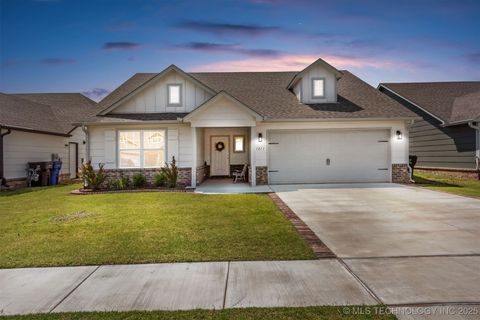
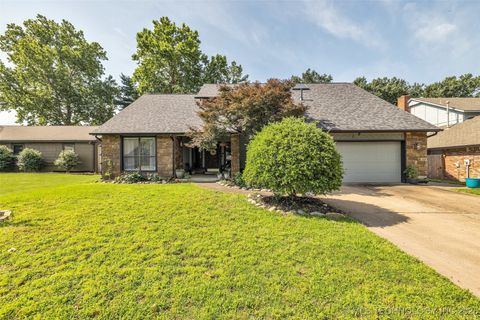
Active
$454,500
4
bds
|
3
ba
|
3,032
sqft
|
built
2018
6605 S Elder Ave, Broken Arrow, OK 74011
$-647
Cash flow
-7.4%
Cash-on-Cash Return
4.0%
Cap rate
0.6%
Rent to Value Ratio
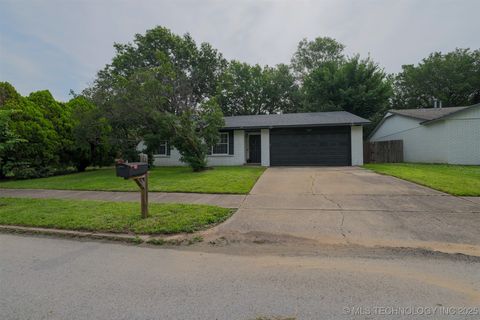
Active
$320,000
4
bds
|
3
ba
|
2,701
sqft
|
built
1993
3909 W El Paso St, Broken Arrow, OK 74012
$-302
Cash flow
-4.9%
Cash-on-Cash Return
4.5%
Cap rate
0.7%
Rent to Value Ratio
Active
$700,000
5
bds
|
3
ba
|
3,865
sqft
|
built
2019
524 N 85th St, Broken Arrow, OK 74014
$-1,377
Cash flow
-10.3%
Cash-on-Cash Return
3.3%
Cap rate
0.6%
Rent to Value Ratio
Active
$265,000
4
bds
|
3
ba
|
1,953
sqft
|
built
1984
6316 S Ash Ave, Broken Arrow, OK 74011
$-323
Cash flow
-6.4%
Cash-on-Cash Return
4.8%
Cap rate
0.7%
Rent to Value Ratio
Active
$285,000
3
bds
|
3
ba
|
1,710
sqft
|
built
1981
1304 W Kent St, Broken Arrow, OK 74012
$-567
Cash flow
-10.4%
Cash-on-Cash Return
3.9%
Cap rate
0.6%
Rent to Value Ratio
Active
$229,000
3
bds
|
2
ba
|
1,371
sqft
|
built
1976
904 W Norman St, Broken Arrow, OK 74012
$-246
Cash flow
-5.6%
Cash-on-Cash Return
5.0%
Cap rate
0.7%
Rent to Value Ratio
Active
$239,900
3
bds
|
2
ba
|
1,782
sqft
|
built
1980
1300 S 30th St, Broken Arrow, OK 74014
$-364
Cash flow
-7.9%
Cash-on-Cash Return
4.4%
Cap rate
0.7%
Rent to Value Ratio
Active
$254,900
3
bds
|
6
ba
|
1,428
sqft
|
built
1976
20935 E 38th St S, Broken Arrow, OK 74014
$-568
Cash flow
-11.6%
Cash-on-Cash Return
3.6%
Cap rate
0.5%
Rent to Value Ratio
Active
$359,900
4
bds
|
2
ba
|
2,249
sqft
|
built
2002
1516 W Trenton St, Broken Arrow, OK 74012
$-664
Cash flow
-9.6%
Cash-on-Cash Return
4.1%
Cap rate
0.6%
Rent to Value Ratio
Active
$359,500
3
bds
|
2
ba
|
1,997
sqft
|
built
2021
2012 W Huntsville Pl, Broken Arrow, OK 74011
$-855
Cash flow
-12.4%
Cash-on-Cash Return
3.4%
Cap rate
0.6%
Rent to Value Ratio
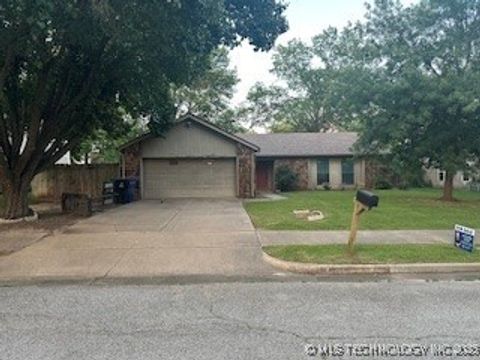
Active
$219,000
3
bds
|
2
ba
|
1,396
sqft
|
built
1982
5117 S Lions Ave, Broken Arrow, OK 74011
$-132
Cash flow
-3.1%
Cash-on-Cash Return
5.0%
Cap rate
0.7%
Rent to Value Ratio
Active
$285,000
3
bds
|
2
ba
|
2,028
sqft
|
built
1977
2528 W Commercial St, Broken Arrow, OK 74012
$-451
Cash flow
-8.3%
Cash-on-Cash Return
4.4%
Cap rate
0.7%
Rent to Value Ratio
Active
$399,000
5
bds
|
3
ba
|
2,427
sqft
|
built
2015
905 W Elmira St, Broken Arrow, OK 74012
$-576
Cash flow
-7.5%
Cash-on-Cash Return
4.5%
Cap rate
0.7%
Rent to Value Ratio

Active
$450,000
4
bds
|
2
ba
|
1,880
sqft
|
built
1979
12424 S 185th East Ave, Broken Arrow, OK 74011
$-1,240
Cash flow
-14.4%
Cash-on-Cash Return
3.0%
Cap rate
0.4%
Rent to Value Ratio
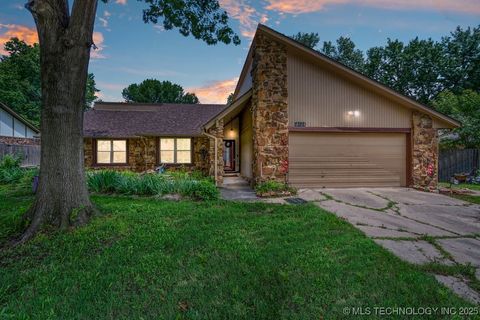
Active
$237,000
3
bds
|
2
ba
|
1,752
sqft
|
built
1983
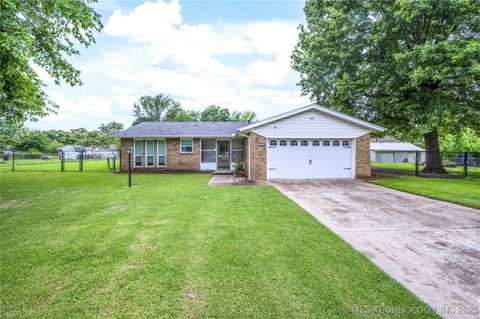
113 S Kalanchoe Ave, Broken Arrow, OK 74012
$-258
Cash flow
-5.7%
Cash-on-Cash Return
5.0%
Cap rate
0.7%
Rent to Value Ratio
Active
$285,000
4
bds
|
3
ba
|
2,918
sqft
|
built
1997
1720 S Juniper Ave, Broken Arrow, OK 74012
$-161
Cash flow
-2.9%
Cash-on-Cash Return
5.6%
Cap rate
0.8%
Rent to Value Ratio
Active
$269,900
3
bds
|
3
ba
|
1,930
sqft
|
built
1987
6223 S Cedar Pl, Broken Arrow, OK 74011
$-419
Cash flow
-8.1%
Cash-on-Cash Return
4.4%
Cap rate
0.7%
Rent to Value Ratio
Active
$270,000
3
bds
|
2
ba
|
1,632
sqft
|
built
2012
2708 W Fredericksburg St, Broken Arrow, OK 74011
$-233
Cash flow
-4.5%
Cash-on-Cash Return
4.6%
Cap rate
0.7%
Rent to Value Ratio
Active
$325,000
2
bds
|
2
ba
|
1,726
sqft
|
built
2021
1914 W Imperial St, Broken Arrow, OK 74011
$-3,672
Cash flow
-58.9%
Cash-on-Cash Return
-7.3%
Cap rate
0.6%
Rent to Value Ratio
Active
$399,999
4
bds
|
3
ba
|
2,599
sqft
|
built
2003
4205 N Narcissus Ave, Broken Arrow, OK 74012
$-1,001
Cash flow
-13.1%
Cash-on-Cash Return
3.3%
Cap rate
0.6%
Rent to Value Ratio
Active
$255,000
3
bds
|
2
ba
|
1,424
sqft
|
built
1970
12922 S 123rd East Ave, Broken Arrow, OK 74011
$-391
Cash flow
-8.0%
Cash-on-Cash Return
4.4%
Cap rate
0.6%
Rent to Value Ratio
Active
$2,395,000
5
bds
|
6
ba
|
6,944
sqft
|
built
2022
8401 S Desert Palm Ave, Broken Arrow, OK 74011
$-12,281
Cash flow
-26.8%
Cash-on-Cash Return
0.1%
Cap rate
0.1%
Rent to Value Ratio
Active
$415,000
4
bds
|
3
ba
|
1,577
sqft
|
built
1969
20861 E 161st St S, Broken Arrow, OK 74014
$-1,304
Cash flow
-16.4%
Cash-on-Cash Return
2.5%
Cap rate
0.4%
Rent to Value Ratio
Active
$315,000
3
bds
|
2
ba
|
2,429
sqft
|
built
1976
204 W Albuquerque St, Broken Arrow, OK 74011
$-435
Cash flow
-7.2%
Cash-on-Cash Return
4.6%
Cap rate
0.7%
Rent to Value Ratio
Active
$337,500
4
bds
|
4
ba
|
2,878
sqft
|
built
1976
13050 S 143rd East Ave, Broken Arrow, OK 74011
$-404
Cash flow
-6.2%
Cash-on-Cash Return
4.8%
Cap rate
0.7%
Rent to Value Ratio
Active
$410,000
3
bds
|
4
ba
|
3,000
sqft
|
built
2000
524 S 67th St, Broken Arrow, OK 74014
$-625
Cash flow
-8.0%
Cash-on-Cash Return
3.8%
Cap rate
0.6%
Rent to Value Ratio
Active
$400,000
4
bds
|
3
ba
|
2,591
sqft
|
built
2012
1620 E Boston Ct, Broken Arrow, OK 74012
$-879
Cash flow
-11.5%
Cash-on-Cash Return
3.6%
Cap rate
0.5%
Rent to Value Ratio
Active
$359,500
4
bds
|
3
ba
|
2,522
sqft
|
built
1994
701 N Indianwood Ave, Broken Arrow, OK 74012
$-725
Cash flow
-10.5%
Cash-on-Cash Return
3.8%
Cap rate
0.6%
Rent to Value Ratio
Active
$330,000
5
bds
|
3
ba
|
2,707
sqft
|
built
1993
4514 W Toledo Ct, Broken Arrow, OK 74012
$-637
Cash flow
-10.1%
Cash-on-Cash Return
3.9%
Cap rate
0.6%
Rent to Value Ratio
Active
$349,000
3
bds
|
2
ba
|
1,936
sqft
|
built
2022
1813 E Van Buren Pl, Broken Arrow, OK 74011
$-691
Cash flow
-10.3%
Cash-on-Cash Return
3.3%
Cap rate
0.6%
Rent to Value Ratio
Active
$215,000
3
bds
|
2
ba
|
1,329
sqft
|
built
1976
4341 S Elm Ave, Broken Arrow, OK 74011
$-100
Cash flow
-2.4%
Cash-on-Cash Return
5.1%
Cap rate
0.7%
Rent to Value Ratio
Active
$255,000
3
bds
|
2
ba
|
1,925
sqft
|
built
1987
8202 S Ash Pl, Broken Arrow, OK 74011
$-158
Cash flow
-3.2%
Cash-on-Cash Return
4.9%
Cap rate
0.7%
Rent to Value Ratio
Active
$365,000
4
bds
|
2
ba
|
2,027
sqft
|
built
2022
3117 W Winston St, Broken Arrow, OK 74011
$-180
Cash flow
-2.6%
Cash-on-Cash Return
5.1%
Cap rate
0.6%
Rent to Value Ratio
Active
$349,900
3
bds
|
3
ba
|
2,602
sqft
|
built
2005
1701 W Durham St, Broken Arrow, OK 74011
$-512
Cash flow
-7.6%
Cash-on-Cash Return
3.9%
Cap rate
0.6%
Rent to Value Ratio
Active
$449,000
4
bds
|
4
ba
|
3,536
sqft
|
built
1983
503 Fairway Dr, Broken Arrow, OK 74011
$-427
Cash flow
-5.0%
Cash-on-Cash Return
4.5%
Cap rate
0.7%
Rent to Value Ratio
Active
$425,000
4
bds
|
3
ba
|
2,743
sqft
|
built
1995
812 N Butternut Ave, Broken Arrow, OK 74012
$-805
Cash flow
-9.9%
Cash-on-Cash Return
3.4%
Cap rate
0.5%
Rent to Value Ratio
Active
$385,000
4
bds
|
3
ba
|
2,161
sqft
|
built
2021
3118 W Yuma Ct, Broken Arrow, OK 74011
$-497
Cash flow
-6.7%
Cash-on-Cash Return
4.1%
Cap rate
0.6%
Rent to Value Ratio
Active
$288,500
3
bds
|
2
ba
|
2,049
sqft
|
built
1983
3501 W Richmond St, Broken Arrow, OK 74012
$-378
Cash flow
-6.8%
Cash-on-Cash Return
4.1%
Cap rate
0.6%
Rent to Value Ratio