Santa Barbara County Investment Properties for Sale
Browse homes for sale and investment properties in Santa Barbara County. Refine your search by price, property type, or more.
Best cash flowing properties in Santa Barbara County
Active
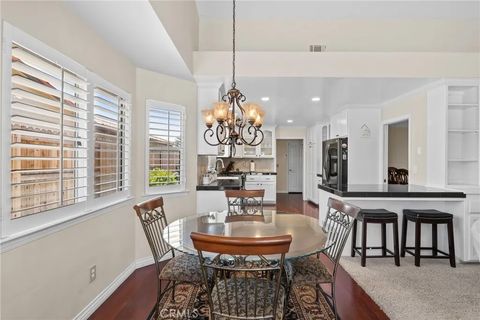
$869,000
4
bds
|
3
ba
|
2,448
sqft
|
built
1993
4817 Claybrook Ct, Santa Maria, CA 93455
$-1,634
Cash flow
-9.8%
Cash-on-Cash Return
3.8%
Cap rate
0.5%
Rent to Value Ratio
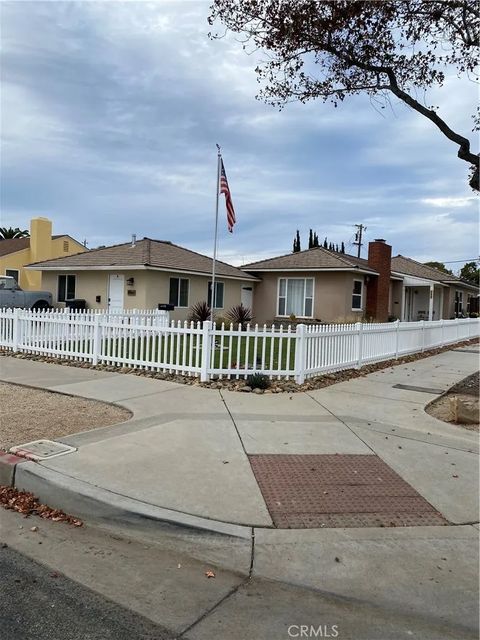
Active
$799,000
4
bds
|
3
ba
|
0
sqft
|
built
1951
843 E Orange St, Santa Maria, CA 93454
$-1,832
Cash flow
-12.0%
Cash-on-Cash Return
3.3%
Cap rate
0.4%
Rent to Value Ratio
8 out of 177 properties for sale in Santa Barbara County
Limited Results Shown
Create a free account, or log in to reveal all property listings and enjoy the complete experience.
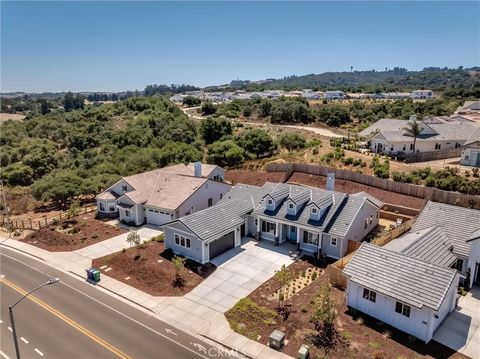
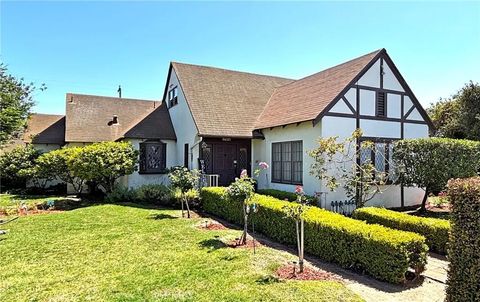
Active
$1,185,000
4
bds
|
4
ba
|
2,472
sqft
|
built
2024
1422 Black Oak Dr, Santa Maria, CA 93455
$-2,288
Cash flow
-10.1%
Cash-on-Cash Return
3.8%
Cap rate
0.5%
Rent to Value Ratio
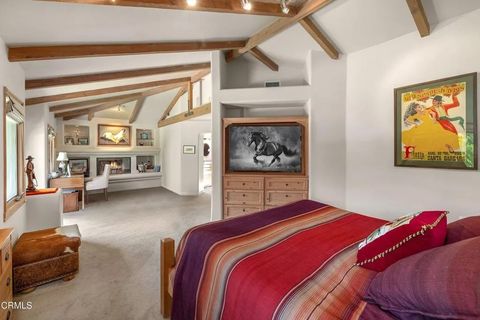
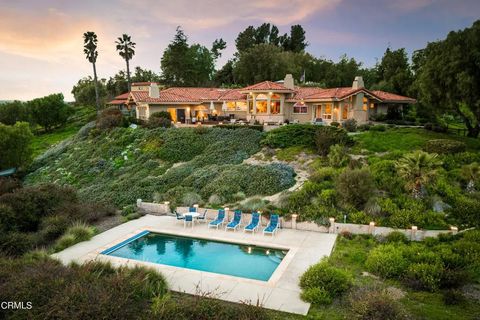
Active
$5,295,000
3
bds
|
4
ba
|
3,542
sqft
|
built
1978
3951 Tims Rd, Santa Ynez, CA 93460
$-20,752
Cash flow
-20.4%
Cash-on-Cash Return
1.4%
Cap rate
0.2%
Rent to Value Ratio
Active
$1,499,000
6
bds
|
5
ba
|
0
sqft
|
built
422 E Hermosa St, Santa Maria, CA 93454
$-6,200
Cash flow
-21.6%
Cash-on-Cash Return
1.1%
Cap rate
0.1%
Rent to Value Ratio
Active
$3,995,000
3
bds
|
4
ba
|
3,520
sqft
|
built
1990
2408 Latigo Dr, Solvang, CA 93463
$-13,055
Cash flow
-17.0%
Cash-on-Cash Return
2.1%
Cap rate
0.3%
Rent to Value Ratio
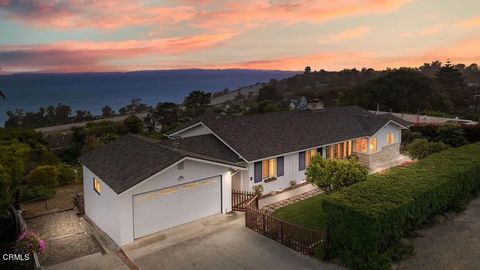
Active
$2,995,000
3
bds
|
3
ba
|
1,792
sqft
|
built
1957
2335 Whitney Ave, Summerland, CA 93067
$-8,244
Cash flow
-14.4%
Cash-on-Cash Return
2.8%
Cap rate
0.3%
Rent to Value Ratio

Active
$3,795,000
10
bds
|
8
ba
|
0
sqft
|
built
1958
618 E Olive Ave, Lompoc, CA 93436
$-17,051
Cash flow
-23.4%
Cash-on-Cash Return
0.7%
Cap rate
0.1%
Rent to Value Ratio