Chatham, MA Investment Properties for Sale
Browse homes for sale and investment properties in Chatham, MA. Refine your search by price, property type, or more.
Best cash flowing properties in Chatham, MA
Active
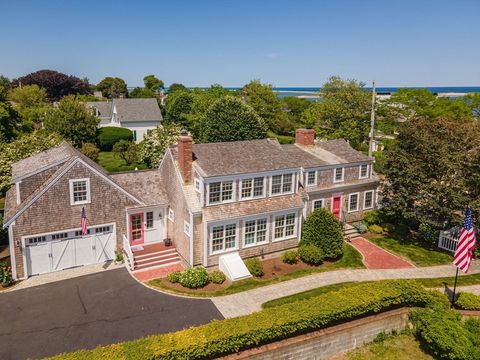
$995,000
3
bds
|
2
ba
|
1,726
sqft
|
built
1972
144 Lakeview Ave, Chatham, MA 02633
$-2,162
Cash flow
-11.3%
Cash-on-Cash Return
3.1%
Cap rate
0.4%
Rent to Value Ratio
Active
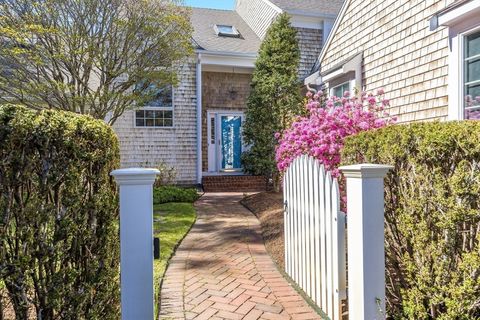
$1,195,000
3
bds
|
3
ba
|
2,202
sqft
|
built
1984
319 Riverview Dr, Chatham, MA 02633
$-2,485
Cash flow
-10.8%
Cash-on-Cash Return
3.2%
Cap rate
0.4%
Rent to Value Ratio
32 out of 38 properties for sale in Chatham, MA
Limited Results Shown
Create a free account, or log in to reveal all property listings and enjoy the complete experience.
Active
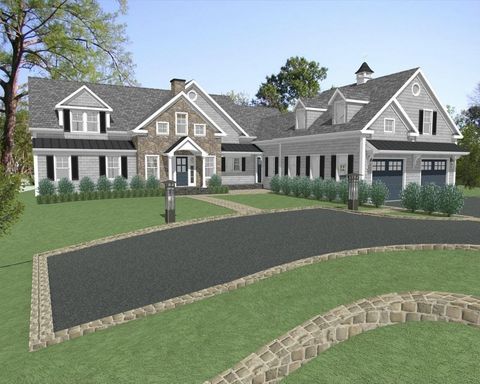
$5,900,000
2
bds
|
3
ba
|
1,850
sqft
|
built
2004
99 Uncle Alberts Drive Ext, Chatham, MA 02633
$-23,505
Cash flow
-20.8%
Cash-on-Cash Return
0.9%
Cap rate
0.1%
Rent to Value Ratio
Active
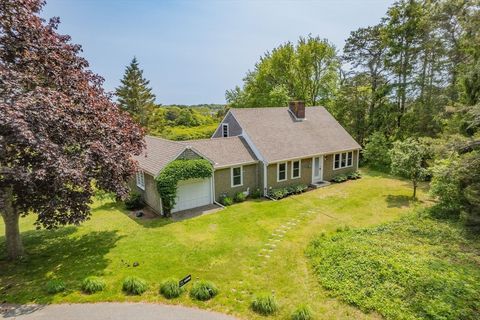
$6,695,000
4
bds
|
5
ba
|
3,225
sqft
|
built
2010
101 Morris Island Rd, Chatham, MA 02633
$-28,325
Cash flow
-22.1%
Cash-on-Cash Return
0.6%
Cap rate
0.1%
Rent to Value Ratio
Active
$1,995,000
4
bds
|
4
ba
|
2,770
sqft
|
built
1970
20 Hardings Beach Rd, Chatham, MA 02633
$-6,725
Cash flow
-17.6%
Cash-on-Cash Return
1.6%
Cap rate
0.2%
Rent to Value Ratio
Active
$1,599,000
4
bds
|
2
ba
|
2,392
sqft
|
built
1979
56 Skyline Dr, Chatham, MA 02633
$-4,443
Cash flow
-14.5%
Cash-on-Cash Return
2.3%
Cap rate
0.3%
Rent to Value Ratio
Active
$2,200,000
3
bds
|
3
ba
|
2,510
sqft
|
built
1972
55 Christopher Harding Ln, Chatham, MA 02633
$-5,983
Cash flow
-14.2%
Cash-on-Cash Return
2.4%
Cap rate
0.3%
Rent to Value Ratio
Active
$1,299,000
3
bds
|
2
ba
|
1,775
sqft
|
built
2023
1775 Main St, Chatham, MA 02633
$-3,694
Cash flow
-14.8%
Cash-on-Cash Return
2.3%
Cap rate
0.3%
Rent to Value Ratio
Active
$1,195,000
3
bds
|
2
ba
|
1,708
sqft
|
built
1971
56 Riverview Dr, Chatham, MA 02633
$-3,137
Cash flow
-13.7%
Cash-on-Cash Return
2.5%
Cap rate
0.3%
Rent to Value Ratio
Active
$8,500,000
7
bds
|
7
ba
|
6,521
sqft
|
built
1925
44 Buena Vista Rd, Chatham, MA 02633
$-38,948
Cash flow
-23.9%
Cash-on-Cash Return
0.2%
Cap rate
0.0%
Rent to Value Ratio
Active
$8,250,000
5
bds
|
4
ba
|
4,307
sqft
|
built
1986
127 Wapoos Trl, Chatham, MA 02633
$-37,202
Cash flow
-23.5%
Cash-on-Cash Return
0.3%
Cap rate
0.1%
Rent to Value Ratio
Active
$5,295,000
4
bds
|
6
ba
|
4,989
sqft
|
built
2025
14 Pond View Ln, Chatham, MA 02633
$-22,466
Cash flow
-22.1%
Cash-on-Cash Return
0.6%
Cap rate
0.1%
Rent to Value Ratio
Active
$3,895,000
4
bds
|
4
ba
|
3,000
sqft
|
built
2004
17 Bucks Ln, Chatham, MA 02633
$-14,993
Cash flow
-20.1%
Cash-on-Cash Return
1.1%
Cap rate
0.2%
Rent to Value Ratio
Active
$7,299,000
4
bds
|
5
ba
|
4,214
sqft
|
built
2019
12 Pond St, Chatham, MA 02633
$-30,825
Cash flow
-22.0%
Cash-on-Cash Return
0.6%
Cap rate
0.1%
Rent to Value Ratio
Active
$3,399,000
3
bds
|
5
ba
|
4,361
sqft
|
built
1998
86 Champlain Rd, Chatham, MA 02633
$-12,771
Cash flow
-19.6%
Cash-on-Cash Return
1.2%
Cap rate
0.2%
Rent to Value Ratio
Active
$3,500,000
5
bds
|
4
ba
|
2,659
sqft
|
built
1820
92 Barcliff Ave, Chatham, MA 02633
$-12,882
Cash flow
-19.2%
Cash-on-Cash Return
1.3%
Cap rate
0.2%
Rent to Value Ratio
Active
$4,950,000
4
bds
|
4
ba
|
3,878
sqft
|
built
1997
38 Indian Trl, Chatham, MA 02633
$-18,261
Cash flow
-19.2%
Cash-on-Cash Return
1.3%
Cap rate
0.2%
Rent to Value Ratio
Active
$6,750,000
5
bds
|
6
ba
|
5,620
sqft
|
built
2007
15 Windy Hl, Chatham, MA 02633
$-29,617
Cash flow
-22.9%
Cash-on-Cash Return
0.4%
Cap rate
0.1%
Rent to Value Ratio
Active
$4,200,000
6
bds
|
4
ba
|
3,808
sqft
|
built
1840
150 Barcliff Ave, Chatham, MA 02633
$-16,183
Cash flow
-20.1%
Cash-on-Cash Return
1.1%
Cap rate
0.2%
Rent to Value Ratio
Active
$1,475,000
3
bds
|
4
ba
|
2,225
sqft
|
built
2004
355 Training Field Rd, Chatham, MA 02633
$-3,626
Cash flow
-12.8%
Cash-on-Cash Return
2.7%
Cap rate
0.4%
Rent to Value Ratio
Active
$5,900,000
4
bds
|
5
ba
|
4,654
sqft
|
built
1965
25 Wikis Way, Chatham, MA 02633
$-25,742
Cash flow
-22.8%
Cash-on-Cash Return
0.4%
Cap rate
0.1%
Rent to Value Ratio
Active
$2,300,000
4
bds
|
2
ba
|
1,238
sqft
|
built
1850
213 Main St, Chatham, MA 02633
$-8,536
Cash flow
-19.4%
Cash-on-Cash Return
1.2%
Cap rate
0.2%
Rent to Value Ratio
Active
$1,575,000
3
bds
|
3
ba
|
2,340
sqft
|
built
1971
307 Riverview Dr, Chatham, MA 02633
$-4,423
Cash flow
-14.7%
Cash-on-Cash Return
2.3%
Cap rate
0.3%
Rent to Value Ratio
Active
$7,200,000
5
bds
|
3
ba
|
1,896
sqft
|
built
1916
238 Cranberry Ln, Chatham, MA 02633
$-31,936
Cash flow
-23.1%
Cash-on-Cash Return
0.4%
Cap rate
0.1%
Rent to Value Ratio
Active
$4,400,000
3
bds
|
4
ba
|
2,998
sqft
|
built
1820
85 Main St, Chatham, MA 02633
$-17,965
Cash flow
-21.3%
Cash-on-Cash Return
0.8%
Cap rate
0.1%
Rent to Value Ratio
Active
$2,500,000
4
bds
|
4
ba
|
3,834
sqft
|
built
1987
106 Stage Neck Rd, Chatham, MA 02633
$-7,749
Cash flow
-16.2%
Cash-on-Cash Return
2.0%
Cap rate
0.3%
Rent to Value Ratio
Active
$6,995,000
5
bds
|
7
ba
|
5,700
sqft
|
built
2025
13 Captain Kendrick Dr, Chatham, MA 02633
$-30,797
Cash flow
-23.0%
Cash-on-Cash Return
0.4%
Cap rate
0.1%
Rent to Value Ratio
Active
$1,700,000
3
bds
|
2
ba
|
2,008
sqft
|
built
1954
9 Bettys Path, Chatham, MA 02633
$-5,695
Cash flow
-17.5%
Cash-on-Cash Return
1.7%
Cap rate
0.2%
Rent to Value Ratio
Active
$3,495,000
4
bds
|
4
ba
|
4,857
sqft
|
built
2005
36 Moonbeam Ln, Chatham, MA 02633
$-11,412
Cash flow
-17.0%
Cash-on-Cash Return
1.8%
Cap rate
0.3%
Rent to Value Ratio
Active
$2,995,000
4
bds
|
5
ba
|
3,603
sqft
|
built
2005
290 Old Comers Rd, Chatham, MA 02633
$-8,557
Cash flow
-14.9%
Cash-on-Cash Return
2.3%
Cap rate
0.3%
Rent to Value Ratio
Active
$4,750,000
4
bds
|
6
ba
|
5,372
sqft
|
built
2007
335 Stage Island Rd, Chatham, MA 02633
$-17,569
Cash flow
-19.3%
Cash-on-Cash Return
1.2%
Cap rate
0.2%
Rent to Value Ratio
Active
$1,469,000
5
bds
|
10
ba
|
11,000
sqft
|
built
2017
558 Fox Hill Rd, Chatham, MA 02633
$-5,830
Cash flow
-20.7%
Cash-on-Cash Return
0.9%
Cap rate
0.4%
Rent to Value Ratio